

Between June 10-13, Rasmussen surveyed 900 likely voters and, with a margin of error of 3%, found that only 29% agreed with Biden that climate change was the “greatest threat” facing the nation. Disagreeing with that assessment were 54% of Americans, while 17% were unsure either way.
Interestingly, only about 42% of Democrats agreed with Biden on climate change being the “greatest threat,” while roughly one-third of Democrats disagreed. Meanwhile, 76% of Republicans and 56% of independents also disagreed with the president’s ranking of climate change as the biggest threat facing the United States.
----------
CO2 not Pollution but the Gas of Life
By Joseph D’Aleo, CCM
I have always considered myself an environmentalist and conservationist. I worked on my doctorate in the 1970s with an atmospheric chemistry grant dealing with pollution.
In the post war boom, we had problems with air pollution from factories, coal plants, cars, inefficient home heating systems and incinerators in apartments.
We had air quality issues with pollutants like soot, SO2, ozone, hydrocarbons, NOx, and lead. Smog events in Donora PA 1948 saw 6,000 of the 14,000 population suffer damaged lungs, and the great London 1952 event which led to 6000 deaths helped drive global action.
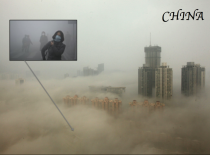
The problem was soot (particulates including carbon) and sulfur dioxide. When there is a fog with a low-level inversion preventing dispersion traps the particulates and the sulfur dioxide reacts with the water droplets to form sulfuric acid mist, which causes lung damage as well as damage to property. Today in a similar industrial boom with heavy coal use in places like China, they are experiencing similar issues.
My colleagues who became part of the EPA or their advisory boards helped them set standards that had to be met by industry and automakers. We were hugely successful.
The EPA reports:
“Between 1970 and 2019, the combined emissions of the six common pollutants (PM2.5 and PM10, SO2, NOx, VOCs, CO and Pb) dropped by 77 percent. For nearly 50 years, the Clean Air Act has brought Americans cleaner air and lower risks of adverse health effects.”
The EPA tracks the Air Quality Trends common pollutants nationally and reports that concentrations of air pollutants have dropped significantly since 1990:
* Carbon Monoxide (CO) 8-Hour, down 78%
* Lead (Pb) 3-Month Average, down 85% (from 2010)
* Nitrogen Dioxide (NO2) Annual, down 59%
* Nitrogen Dioxide (NO2) 1-Hour, down 51%
* Ozone (O3) 8-Hour, 25%
* Particulate Matter 10 microns (PM10) 24-Hour, down 46%
* Particulate Matter 2.5 microns (PM2.5) Annual, down 43% (from 2000)
* Particulate Matter 2.5 microns (PM2.5) 24-Hour, down 44% (from 2000)
* Sulfur Dioxide (SO2) 1-Hour, down 90%
You should note CO2 is not on the list of criteria pollutants.
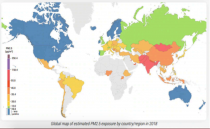
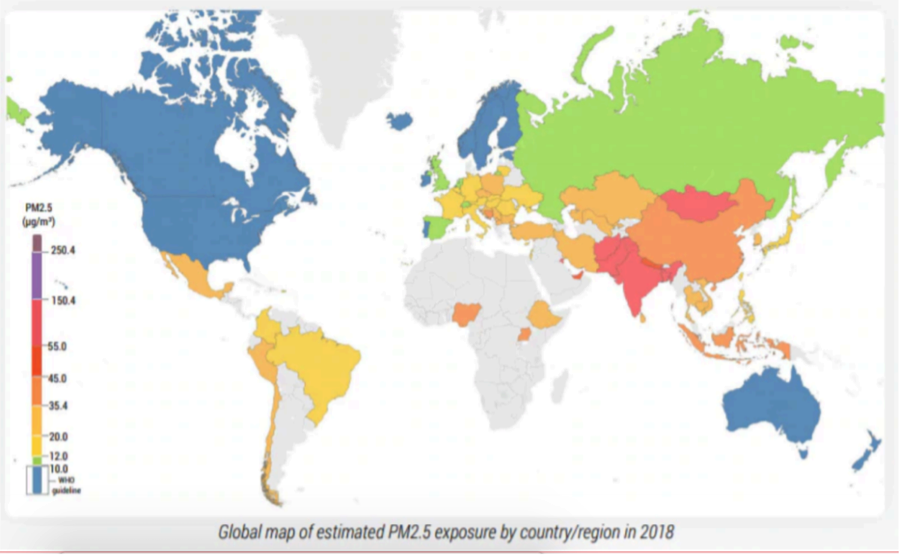
We have the cleanest air in my lifetime and well below the EPA health standards. In fact, the global trend of PM2.5 from NASA and the WHO shows the U.S. with reliance on clean natural gas has the lowest small particulate count (along with Scandinavia and Australia) in the world.
Enlarged
‘
The EPA notes “During this same period, the U.S. economy continued to grow, Americans drove more miles, and population and energy use increased.”
The IER agrees see “Breathe a Little Easier, Why America’s Air is Among the Cleanest in the World” here.
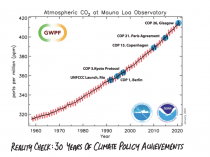
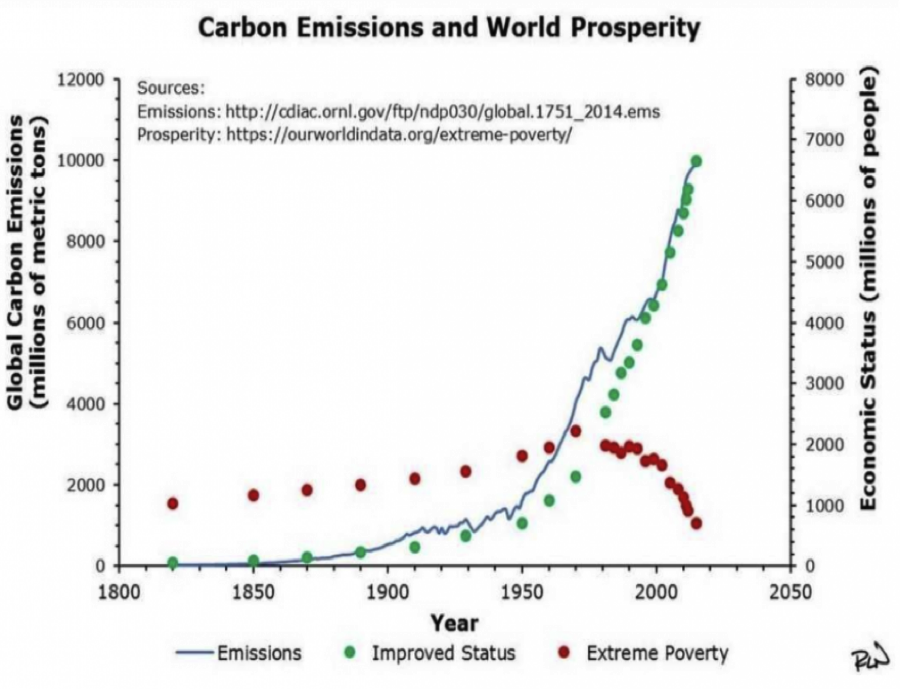
CO2 is not carbon. CO2 is not a pollutant. Shown here the other CO2 driven climate claims are either demonstrably false or can be entirely explained by natural factors. World prosperity and decreased poverty and death have resulted from the measurable benefits of the use of fossil fuels to mankind as shown below.
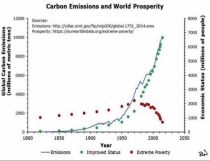
Enlarged
See much more here
---------------
NOAA, NASA, EPA associated with the CO2 and the supposed weather impacts have been altering data to support their theories and models. The media plays along as if it was actually even worse than forecast although not any of the 50 climate scares have come close to verifying.
See the temperature problems in this peer review paper. We listed uncertainties here. With Anthony Watts and many others, we did this thorough review over a decade ago. We have fact checked alarmist claims of CO2 increased extremes here.
Anthony exposed how the Biden Administration is reinventing data to align with the predictions made to get the desired policies though the congress.
EPA Disappears More Inconvenient Climate Data, Including the 1930s U.S. Dust Bowl
By Anthony Watts -May 26, 2021
The U.S. Environmental Protection Agency (EPA) brought back its Climate Change Indicator’s platform last week under the new Biden administration. In the new web presentation, EPA has simply disappeared data that was inconvenient to the narrative that humans are causing dangerous climate change. By not presenting the full historical data-set EPA previously showed, the agency is misleading the public by playing fast and loose with climate facts. Climate Realism first demonstrated this Biden administration data disappearing act in our report National Fire Center Disappears ‘Inconvenient’ U.S. Wildfire Data.
Now the EPA is doing the same thing - erasing important historic temperature data. EPA has deleted its earlier web page Climate Change Indicators: High and Low Temperature and replaced it with a new one. Previously, they showed the U.S. Heat Wave Index from 1895 to 2015 that clearly established the unique drought and heat period of the 1930s.
Fortunately, the Internet never forgets, and as recently as May 1st, 2021, the original EPA page was archived on the Internet, as shown as Figure 1.
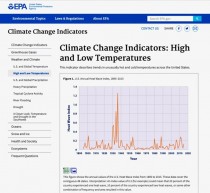
Figure 1. Previous EPA graph before the Biden administration change with data from 1895 to 2015. Enlarged
Note in Figure 1 that there is a very prominent spike of temperatures during the 1930s during the so-called “dust bowl” period in United States history. According to the National Weather Service,
“The “Dust Bowl” years of 1930-36 brought some of the hottest summers on record to the United States, especially across the Plains, Upper Midwest and Great Lake States. For the Upper Mississippi River Valley, the first few weeks of July 1936 provided the hottest temperatures of that period, including many all-time record highs.
The string of hot, dry days was also deadly. Nationally, around 5000 deaths were associated with the heat wave.”
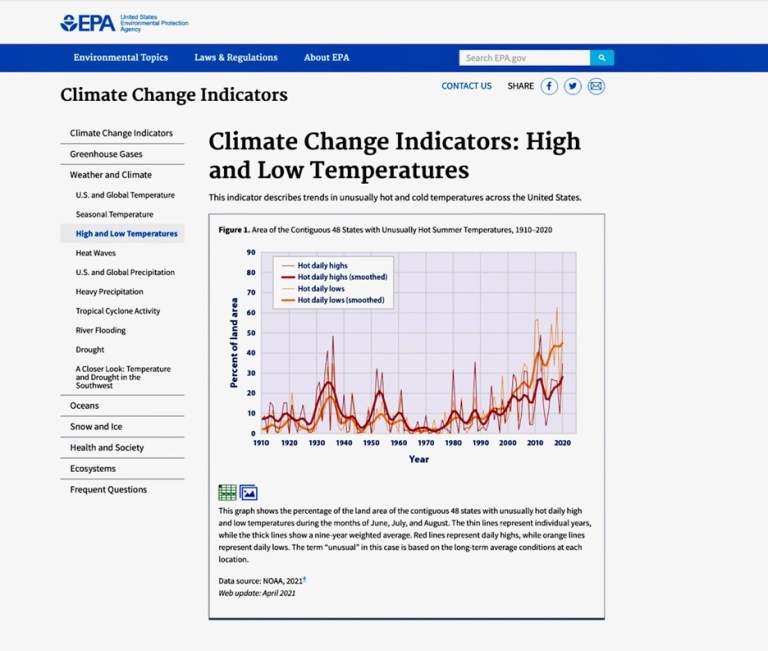
That long-standing heat wave index chart has now been replaced by a new chart which simply “disappears” any notion of the great heat wave period of the 1930s. The EPA erased the previous data, substituting data more favorable to an alarmist narrative, as Figure 2 below shows.

Figure 2. New EPA chart after the Biden administration change with data from 1910 to 2015. Enlarged
The EPA has also added another new page Climate Change Indicators: Heat Waves that does not even contain the 1930s “dust bowl.” Instead, EPA’s report starts in the 1960s, a low-point for heatwaves in the 20th century, as seen in Figure 3. By starting the new graphs in the 1960s, rather than using all the available data back to 1895, EPA ensures a positive and uninterrupted upward trend in heat waves.
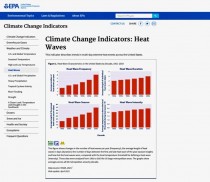
Figure 3, EPA’s new page showing data only from 1960, totally eliminating the 1930s dust bowl period Enlarged
On a positive note, the EPA has retained the original page, Climate Change Indicators: Drought seen in Figure 4, which remains the same and shows no worsening drought trend in the United States. Given the recent changes EPA’s other charts, this non-alarming drought chart is probably short-lived on EPA’s webpage.
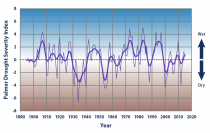
Figure 4. EPA page Climate Change Indicators: Drought Enlarged
At the outset of its Climate Change Indicator’s page EPA makes some demonstrably false statements
“The Earths climate is changing. Temperatures are rising, snow and rainfall patterns are shifting, and more extreme climate events - like heavy rainstorms and record high temperatures - are already happening. Many of these observed changes are linked to the rising levels of carbon dioxide and other greenhouse gases in our atmosphere, caused by human activities.”
The decision to erase weather and climate data history makes it clear EPA’s opening argument is weak, based on cherry picking data that only agrees with their premise.
It appears that we have entered the Soviet style era of “disappearing” charts and data. If the EPA’s new Climate Change Indicators Series is any indication of the future government climate reports, it appears we are now entering the era of the “Biden inconvenient climate data purge.”
Anthony Watts is a senior fellow for environment and climate at The Heartland Institute. Watts has been in the weather business both in front of, and behind the camera as an on-air television meteorologist since 1978, and currently does daily radio forecasts. He has created weather graphics presentation systems for television, specialized weather instrumentation, as well as co-authored peer-reviewed papers on climate issues. He operates the most viewed website in the world on climate, the award-winning website wattsupwiththat.com.