Oct 11, 2008
Record Early Snow Hitting Northern Rockies
By Zack Benoit, Billings Gazette
An early-winter storm kicked into high gear Friday, blanketing much of southern Montana and northern Wyoming with snow. Wet, heavy snow fell throughout the day in Billings. The storm is expected to continue at least through Sunday and bring as much as 20 inches of snow to the Billings area. A snowfall record for Oct. 11 was set in Billings yesterday. According the National Weather Service, Billings saw 3.1 inches of snow Friday. The old record of 2.8 inches was set in 1969. See video story here.
By 9 a.m. today, many towns in the region were reporting heavy snowfall. Park City and Colstrip each received 5 inches, Red Lodge reported 18 inches and Nye had 19. As of 3pm MDT Saturday, Cole Creek reported 34 inches. Areas in Eastern Montana have not received much snow, but it has been raining - Miles City reported about 0.5 inches this morning - but snow is expected to begin falling there this evening. Read more here.
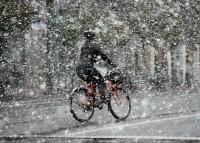
Meanwhile to the west in Idaho according to the Idaho Stateman story, Boise had the earliest snow on record. Big snow flakes fell early Friday evening, turning Downtown Boise into a giant snow bowl for people on their way home from work. The snow caught many people off guard, including this bicyclist heading down Idaho Street between 8th and 9th around 5:45 p.m.

Across the Treasure Valley, tree branches heavy with wet, snow-covered leaves fell on power lines, causing scattered power outages.
This is the earliest measurable snowfall in Boise since record keeping began in 1898, according to the National Weather Service. At 10 p.m., the Weather Service said 1.7 inches of snow had fallen. The previous earliest recorded snowfall was Oct. 12, 1969, when a little more than an inch fell. And if the snow wasn’t enough, meteorologists say winds across southwestern Idaho will average 25 to 40 mph through Saturday afternoon, with gusts up to 55 mph. Sustained winds of 30 to 40 mph are expected, which can make driving difficult.
Oct 08, 2008
Implications of PDO and NAO Shifts and Global Climate in Upcoming Decades
By Dr. Don Easterbrook
In a Geological Society of America abstract, Dr. Don Easterbrook, Professor of Geology at Western Washington University, presents data showing that the global warming cycle from 1977 to 1998 is now over and we have entered into a new global cooling period that should last for the next three decades. He also suggests that since the IPCC climate models are now so far off from what is actually happening that their projections for both this decade and century must be considered highly unreliable.
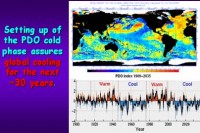
The Pacific Ocean has a warm temperature mode and a cool temperature mode and in the past century has switched back forth between these two modes every 25-30 years (known as the Pacific Decadal Oscillation or PDO). In 1977 the Pacific abruptly shifted from its cool mode (where it had been since about 1945) into its warm mode, and this initiated global warming from 1977 to 1998. The correlation between the PDO and global climate is well established. The announcement by NASA’s Jet Propulsion Laboratory that the Pacific Decadal Oscillation (PDO) had shifted to its cool phase is right on schedule as predicted by past climate and PDO changes (Easterbrook, 2001, 2006, 2007). The PDO typically lasts 25-30 years and assures North America of cool, wetter climates during its cool phases and warmer, drier climates during its warm phases. The establishment of the cool PDO, together with similar cooling of the North Atlantic Oscillation (NAO), virtually assures several decades of global cooling and the end of the past 30-year warm phase. It also means that the IPCC predictions of catastrophic global warming this century were highly inaccurate.

See larger image here
As shown by the historic pattern of PDOs over the past century and by corresponding global warming and cooling, the pattern is part of ongoing warm/cool cycles that last 25-30 years. The global cooling phase from 1880 to 1910, characterized by advance of glaciers worldwide, was followed by a shift to the warm-phase PDO for 30 years, global warming and rapid glacier recession. The cool-phase PDO returned in ~1945 accompanied by global cooling and glacial advance for 30 years. Shift to the warm-phase PDO in 1977 initiated global warming and recession of glaciers that persisted until 1998. Recent establishment of the PDO cool phase appeared right on target and assuming that its effect will be similar to past history, global climates can be expected to cool over the next 25-30 years. The IPCC prediction of global temperatures 1 F warmer by 2011 and 2 F by 2038 stand little chance of being correct.
The global warming of this century is exactly in phase with the normal climatic pattern of cyclic warming and cooling and we have now switched from a warm phase to a cool phase right at the predicted time (see graph below).

See larger image here
See full post here.
Oct 05, 2008
Peru Studies Climate Riddle
By Terry Wade, Reuters
Scientists are using everything from a yellow submarine to weather balloons and special airplanes to solve a climate conundrum: why is Peru getting colder while the rest of the world heats up? Researchers from Europe, the United States and South America started collecting reams of data this week from clouds, the shoreline and deep underwater to try to figure out the dynamics of the southeastern Pacific. The area, home to a fifth of the world’s fish stocks, plays a crucial part in global weather patterns and scientists want to discover why temperatures have dropped on the desert coast.
“Peru has a very important role in global climate,” said Alexis Chaigneau, a French scientist leading experiments in Peru. “Over the past 50 years, the Peruvian coast has gotten colder, mainly because of stronger winds that have pulled up the deep cold waters of the ocean current.” The Humboldt current, which flows north to Peru from the frigid southern waters off Chile, is considered the world’s most productive marine ecosystem, in part because deep cold waters rich in nutrients interact with the sun’s energy to create life.
For the next three months, everything from a small satellite-controlled submarine to cloud-hugging airplanes will feed computers with information on oxygen levels in the water, temperature, salinity, wind speeds and current. Along the way, they also hope to solve the riddles of the famous El Nino and La Nina weather phenomenon that occur in the southeastern Pacific—the periodic oscillations in surface water temperatures that are linked to floods and droughts. Read more here.
Icecap Notes: A few things should be noted. Some of the world’s warming (most peer-reviewed studies suggest 50%) in the last half of the 20th century was due to urbanization and land use changes not properly accounted for by the national centers. Of course neither population nor land use is an issue in the waters off Peru. As the late John Daly showed here, most non-urban stations, island locations may have shown cyclical but no net changes long term.
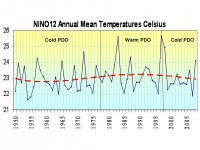
Secondly the PDO cycle which went from cold 50 years ago to warm from 1979 to 1998 then cold again should produce no net change over 50 years but a net cooling over 30 years. Here is a plot of temperatures from the eastern most NINO regions (NINO12) - annual mean surface ocean temperatures fron 0 to 10 degrees south and between 80 and 90 degrees west. You see a no net change since 1950 but a warming from the first few decades to the 1980s and 1990s as in the Warm PDO, more El Ninos occurred and then a slight cooling recently with a return to a cold PDO.

See larger image here.
The TAO Triton buoy network established in 1984 after the super El Nino of 1982/83 provides a lot of valuable information about surface and depth water temperature patterns. Additional data analyses and plots are available here.
Oct 03, 2008
Winds are Dominant Cause of Greenland and West Antarctic Ice Sheet Losses
Climate Research News
Two new studies summarised in a news article in Science magazine point to wind-induced circulation changes in the ocean as the dominant cause of the recent ice losses through the glaciers draining both the Greenland and West Antarctic ice sheets, not ‘global warming.’ See an animation from NSIDC that illustrates the dynamic nature of the arctic here.
The two studies referred to are:
‘Acceleration of Jakobshavn Isbrae triggered by warm subsurface ocean waters’ by Holland et al, published in Nature Geoscience. The Abstract states:
Observations over the past decades show a rapid acceleration of several outlet glaciers in Greenland and Antarctica. One of the largest changes is a sudden switch of Jakobshavn Isbræ, a large outlet glacier feeding a deep-ocean fjord on Greenland’s west coast, from slow thickening to rapid thinning in 1997, associated with a doubling in glacier velocity. Suggested explanations for the speed-up of Jakobshavn Isbrae include increased lubrication of the ice–bedrock interface as more meltwater has drained to the glacier bed during recent warmer summers and weakening and break-up of the floating ice tongue that buttressed the glacier. Here we present hydrographic data that show a sudden increase in subsurface ocean temperature in 1997 along the entire west coast of Greenland, suggesting that the changes in Jakobshavn Isbræ were instead triggered by the arrival of relatively warm water originating from the Irminger Sea near Iceland. We trace these oceanic changes back to changes in the atmospheric circulation in the North Atlantic region. We conclude that the prediction of future rapid dynamic responses of other outlet glaciers to climate change will require an improved understanding of the effect of changes in regional ocean and atmosphere circulation on the delivery of warm subsurface waters to the periphery of the ice sheets. And:
‘Modelling Circumpolar Deep Water intrusions on the Amundsen Sea continental shelf, Antarctica’ by Thoma et al, published in GRL. The Abstract states:
Results are presented from an isopycnic coordinate model of ocean circulation in the Amundsen Sea, focusing on the delivery of Circumpolar Deep Water (CDW) to the inner continental shelf around Pine Island Bay. The warmest waters to reach this region are channeled through a submarine trough, accessed via bathymetric irregularities along the shelf break. Temporal variability in the influx of CDW is related to regional wind forcing. Easterly winds over the shelf edge change to westerlies when the Amundsen Sea Low migrates west and south in winter/spring. This drives seasonal on-shelf flow, while inter-annual changes in the wind forcing lead to inflow variability on a decadal timescale. A modelled period of warming following low CDW influx in the late 1980’s and early 1990’s coincides with a period of observed thinning and acceleration of Pine Island Glacier. Read more here.
See also this late 2007 story from NASA on Trendwatch how “...a team of scientists have assembled data showing that normal, decade-long changes in Arctic Ocean currents (driven by the winds) are largely responsible for the major Arctic climate shifts observed over the past several years. These periodic reversals in the ocean currents move warmer and cooler water around to new places, greatly affecting the climate.”
Oct 03, 2008
Opinion: The Single Minded Stupidity of Energy Policy
By Mac Johnson, The Energy Tribune
The biggest problem in energy supplies today is that politicians think it is a problem with a solution. And by that I mean they seem to think it has exactly one solution. We can’t drill in the Arctic because the solution is conservation. We can’t build nuclear because the solution is solar. Offshore is not needed because the solution is biofuel. Natural gas, clean coal, coastal wind, oil shales, tar sands, tidal turbines, biomass, geothermal, hydroelectric - all in turn are argued against, because something better, or bigger, or cleaner, or cheaper, or more philosophically correct can be supported instead.
Perhaps the most remarkable aspect of our current energy “shortage” is the sheer number of options we have available to us - none of which is apparently the one perfect solution, and so all of which are delayed and obstructed. America’s leaders and would be leaders are pursuing our future energy policy with all the finesse of a child who believes the game must be won by a single home run. Who needs base hits? Because of this, America may be the first country in history to run out of energy due to too many options.
A rational approach to energy would be simple: it’s good, so let’s have more of it. But then nobody would be able to take credit for making the grand choice, would they? So instead we have an interminable debate over what best form energy should take. That we have a small number of people making the choice at all is an even bigger problem. If energy were treated as an economic issue, rather than a political or moral one, the exact modality used to power any region or industry would be left to those actually using the energy. This is known as “the free market.” In its place, a system of energy evolves that is allocation by grand national committee.
The most frustrating thing about a democracy in which government plays a huge role in energy policy is that no portion of the solution can proceed until a majority in Congress says it’s OK. So little is done. If market forces were given more weight, we could drill for oil wherever it’s found. We could build a wind farm wherever it’s windy. We could ship natural gas wherever it’s needed. We could install solar panels wherever they are profitable, guaranteeing them a deserved place on calculators and satellites.
Beyond the egotistical need of politicians to be great deciders, there’s a second reason markets are currently restricted: many would be deeply unhappy with the obvious winners chosen by the marketplace. Biofuels, solar, and the like are all touted as ways to save us from high oil prices. But even with oil at $120, these technologies cannot compete without steep subsidies. The supporters and beneficiaries of these technologies may feed the public a line about fighting high oil prices, but they know better than anyone how cheap oil is, compared to their alleged bargains.
It’s true that there is not enough oil in the Arctic to solve all our energy needs. There is not enough gas off the coast of Florida to solve all our energy needs. Neither can our needs be filled with nuclear or coal or wind alone. And yet all these facts are beside the point. The solution to our energy needs is to stop looking for a grand solution to our energy needs. If we just let the market find many small solutions to many small problems, we will find the larger problem brought down to size. Read Energy Tribune here.
|


