By Joseph D’Aleo, CCM
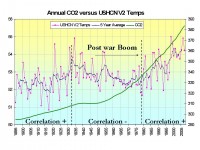
The temperatures over the last century correlated positively with carbon dioxide in the early 20th century but that warming was acknowledged even by the IPCC to be largely natural and minimally anthropogenic.
A negative correlation existed from the early 1930s to the late 1970s as temperatures cooled. This included three decades of the post war economic boom. A very strong positive correlation resumed after the Great Pacific Climate shift in the late 1970s. Data here is the USHCN Version 2.

See full size image here
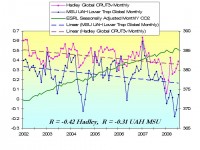
After 1998, temperatures stopped rising and since 2002 have been falling now into the 7th year. Meanwhile CO2 has continued to rise (9.69 ppm or 2.6%) although the Mauna Loa surface data has actually paused this year with the La Nina inspired cooling. The monthly global data is plotted here for Hadley and UAH MSU along the monthly seasonally adjusted CO2 from NOAA ESRL for Mauna Loa. There is no smoothing here of the monthly data. The correlation (Pearson coefficient, r) for the Hadley and CO2 is now a negative (minus 0.4) and for the MSU UAH (minus 0.21). As we have noted, this MAY mark the start of another cooling interlude as predicted by the 60-70 year cycles of the PDO and AMO, and diminished solar.

See full size image here
The on again, off again nature of this correlation suggests that carbon dioxide is not the driving factor in our climate. See pdf here.


