

By Bruce Hall, Hall of Records
If an increased frequency of extreme temperature records are an indicator of a warming trend… as I have quoted that several times from those who advocate the theory of man-made global warming1 ... then take a look at the decadal frequency of those statewide monthly records in the animation below.
See full size animation here
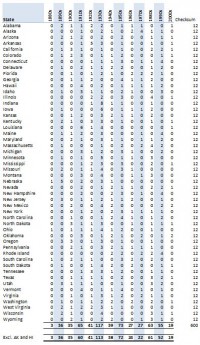
As explained in previous posts, each state can have only 12 statewide, monthly records for the 13 decades tracked here… hence, they are “all-time” records for a state for a month.
Range goes from 0 [white] to 8 [dark red]. Indiana had the highest frequency of records in one decade with 8 still standing from the 1930s. See the table below for the actual count by decade. Old records are replaced if tied or surpassed by subsequent readings.
See larger image here.
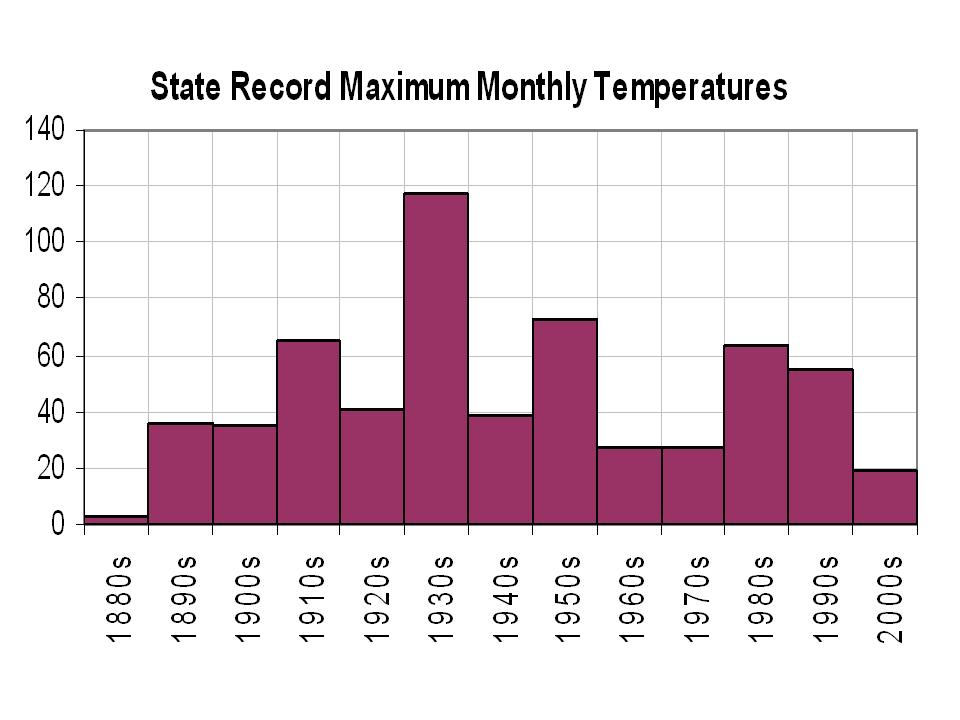
The 1930s experienced the highest number of maximum extreme temperatures for which records have not been tied or surpassed subsequently. While the late 1990s did have a very brief hot period associated with El Nino, the 1990s were a rather ordinary period for extreme temperatures in the contiguous 48 states.
I have excluded Alaska and Hawaii from this animation because they are distinct and separate climate zones. For the record, however, Alaska’s decade of most frequent high temperature records was the 1970s with 4. Hawaii’s decade of most records was the 1910s. Those data are included in the table below.
The 1990s were only particularly hot, as reflected in these records, in New England and Idaho. These selective areas were far more restricted than the geographically widespread heat of the 1930s.
This animation goes to the heart of my arguments regarding global warming as it is reflected in U.S. temperature data.
The trendline used by those claiming a long term warming begins in a very cool climate period. Consequently, any trend from that point will be upward. The late 1990s were an aberration and not indicative of the general climate oscillations presented in these records. Frequency data is shown in the table below.
There is virtually no correlation between increased atmospheric CO2 and extreme high temperatures… at least for the continental United States which is where most of the man-made CO2 is supposed to have originated. I challenge those who claim global warming is real to:
Do a similar analysis for the 1880 - 2008 period for the rest of the world… insofar as any reliable data may exist.
Re-examine the notion that the 1880s is a reasonable starting point for establishing a meaningful trend because it appears to have been abnormally cool.
The data above are in direct conflict with those warming claims as it pertains to the U.S. over 13 decades.
Many others have questioned the failure of global warming computer models to fit past data, database “adjustments” to bias the temperature trend upward, and the impact of poorly sited weather stations as they relate to global warming claims, so it is not necessary to go over those issues here.

See larger image here.
______________
1 [An example] “These new peaks do not in themselves prove global warming, say scientists - but global warming makes them much more likely. “As you get a warming trend in temperatures, which is what we are observing, the risk of exceeding extreme temperatures increases dramatically,” said Peter Stott of the Met Office’s Hadley Centre for Climate Prediction and Research.” [quoted in The Independent; 19 July 2006]