

John R. Christy, PhD
“During the heat wave of late June and early July, high temperature extremes became newsworthy. Claims that there were thousands of records broken each day and that “this is what global warming looks like” got a lot of attention.
However, these headlines were not based on climate science. As shown in Figure 1.3 of my testimony it is scientifically more accurate to say that this is what Mother Nature looks like, since events even worse than these have happened in the past before greenhouse gases were increasing like they are today.
Now, it gives some people great comfort to offer a quick and easy answer when the weather strays from the average rather than to struggle with the real truth, which is, we don’t know enough about the climate to even predict events like this.
A climatologist looking at this heat wave would not be alarmed because the number of daily high temperature records set in the most recent decade was only about half the number set in the 1930s as shown in my written testimony. I suppose most people have forgotten that Oklahoma set a new record low temperature just last year of 31 below. And in the past two years, towns from Alaska to my home state of California established records for snowfall. The recent anomalous weather can’t be blamed on carbon dioxide.”
1. It is popular again to claim that extreme events, such as the current central U.S. drought, are evidence of human-caused climate change. Actually, the Earth is very large, the weather is very dynamic, and extreme events will continue to occur somewhere, every year, naturally. The recent “extremes” were exceeded in previous decades.”
2. The average warming rate of 34 CMIP5 IPCC models is greater than observations, suggesting models are too sensitive to CO2. Policy based on observations, where year-to- year variations cause the most harm, will likely be far more effective than policies based on speculative model output, no matter what the future climate does.
3. New discoveries explain part of the warming found in traditional surface temperature datasets. This partial warming is unrelated to the accumulation of heat due to the extra greenhouse gases, but related to human development around the thermometer stations. This means traditional surface datasets are limited as proxies for greenhouse warming.
4. Widely publicized consensus reports by “thousands” of scientists are misrepresentative of climate science, containing overstated confidence in their assertions of high climate sensitivity. They rarely represent the range of scientific opinion that attends our relatively murky field of climate research. Funding resources are recommended for “Red Teams” of credentialed, independent investigators, who already study low climate sensitivity and the role of natural variability. Policymakers need to be aware of the full range of scientific views, especially when it appears that one-sided-science is the basis for promoting significant increases to the cost of energy for the citizens.
5. Atmospheric CO2 is food for plants which means it is food for people and animals. More CO2 generally means more food for all. Today, affordable carbon-based energy is a key component for lifting people out of crippling poverty. Rising CO2 emissions are, therefore, one indication of poverty-reduction which gives hope for those now living in a marginal existence without basic needs brought by electrification, transportation and industry. Additionally, modern, carbon-based energy reduces the need for deforestation and alleviates other environmental problems such as water and air pollution. Until affordable energy is developed from non-carbon sources, the world will continue to use carbon as the main energy source as it does today.
It is a privilege for me to offer my views of climate change based on my experience as a climate scientist. My research area might be best described as building datasets from scratch to advance our understanding of what the climate is doing and why. This often involves weeks and months of tedious examination of paper records and then digitizing the data for use in computational analysis. I have used traditional surface observations as well as measurements from balloons and satellites to document the climate story. Many of my datasets are used to test hypotheses of climate variability and change. In the following I will address five issues that are part of the discussion of climate change today, some of which will be assisted by the datasets I have built and published.
1. EXTREME EVENTS
Recently it has become popular to try and attribute certain extreme events to human causation. The Earth however, is very large, the weather is very dynamic, especially at local scales, so that extreme events of one type or another will occur somewhere on the planet in every year. Since there are innumerable ways to define an extreme event (i.e. record high/low temperatures, number of days of a certain quantity, precipitation total over 1, 2, 10… days, snowfall amounts, etc.) this essentially assures us that there will be numerous “extreme events” in every year because every year has unique weather patterns. The following assesses some of the recent “extreme events” and demonstrates why they are poor proxies for making claims about human causation.
Extreme High and Low Temperatures
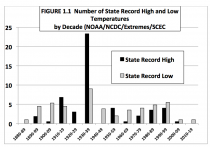
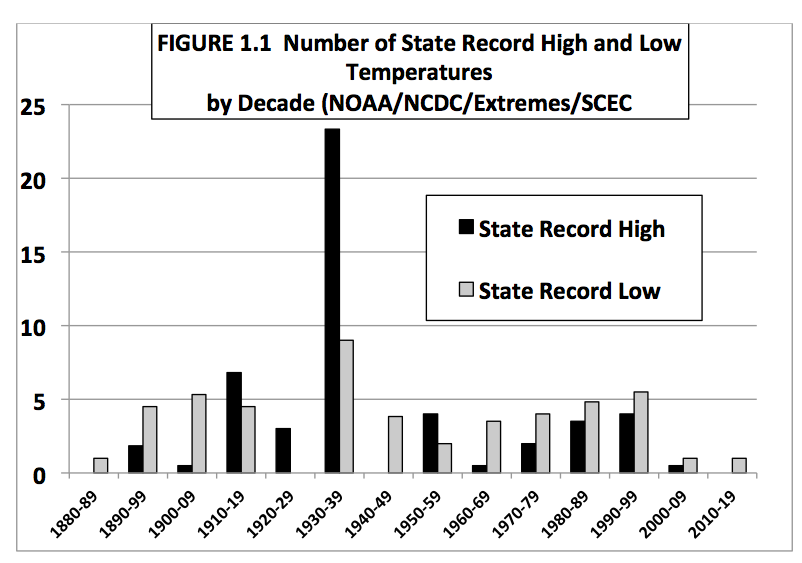
Another extreme metric is the all time record high temperature for each state. The occurrence of the records by decade (Figure 1.1 below) makes it obvious that the 1930s were the most extreme decade and that since 1960, there have been more all-time cold records set than hot records in each decade.
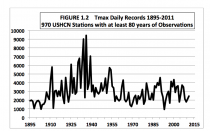
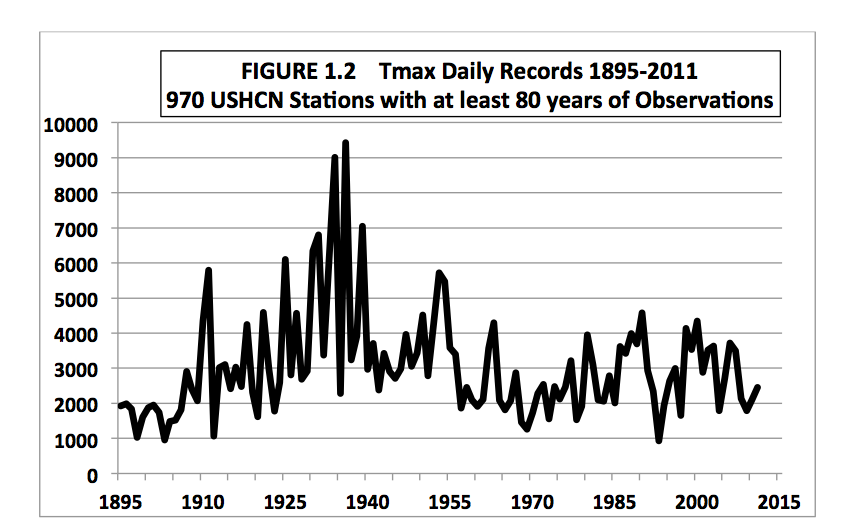
However, there are only 50 states, and this is a number that isn’t large enough to give the best statistical results. Below are the year-by-year numbers of daily all-time record high temperatures from a set of 970 weather stations with at least 80 years of record (NOAA/NCDC/USHCNv2). There are 365 opportunities in each year (366 in leap years) for each of the 970 stations to set a record high (TMax). These have been added up by years and displayed in the Fig. 1.2 below. Note the several years above 6000 events prior to 1940 and none above 5000 since 1954. The clear evidence is that extreme high temperatures are not increasing in frequency, but actually appear to be decreasing. The recent claims about thousands of new record high temperatures were based on stations whose length-of-record could begin as recently as 1981, thus missing the many heat waves of the 20th century. Thus, any moderately hot day now will be publicized as setting records for these young stations because they were not operating in the 1930s. The figure below gives what a climatologist would want to know because it uses only stations with long records.
See the full assessment in his excellent analysis
On the other hand, see Roger Pielke Jr. demolish the testimony of IPCC Lead Author Christopher Field who was loose with the facts and truth.