

By Joe D’Aleo, Weatherbell.com co-chief meteorologist
The EPA technical support document proclaimed:
“Most of the observed increase in global average temperatures since the mid-20th century is very likely due to the observed increase in anthropogenic GHG concentrations. Climate model simulations suggest natural forcing alone (e.g., changes in solar irradiance) cannot explain the observed warming.”
That is because they only considered the brightness changes and solar irradiance/brightness changes only 0.1 to 0.15% in the 11 year cycle and perhaps 0.4% since the Little ice Age. They have ignored all the other solar factors like ultraviolet which can change 8-10% in the 11 year cycle and X-rays 100%. Nor did they consider the geomagnetic changes or the solar wind induced changes in cosmic rays which can alter low cloud cover (and albedo or reflectivity) by 1 or 2%. Low clouds reflect sunshine. A quiet sun means less warming from radiation amplified by more cloudiness. Duke’s Nicola Scafetta has estimated the total solar affects (direct and indirect) could explain 60% of the variance of global temperatures. Much of the other might be explained by urbanization and land use changes, He and his research partners found evidence for 60 year cycles in many data sets. The AMO and PDO are about 60-70 year cycles.
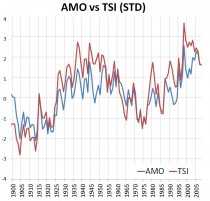
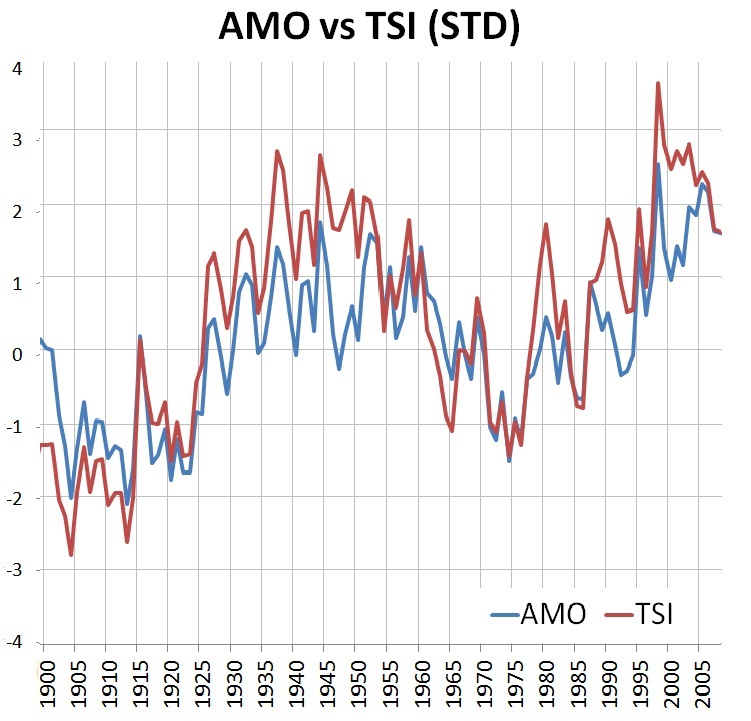
This chart comparing the AMO and the total solar irradiance computed by Hoyt/Schatten and Willson using muliple solar components and calibrated to the recent ACRIMSAT satellites is rather convincing for me. It shows a very tight tracking of the AMO with TSI since 1900.
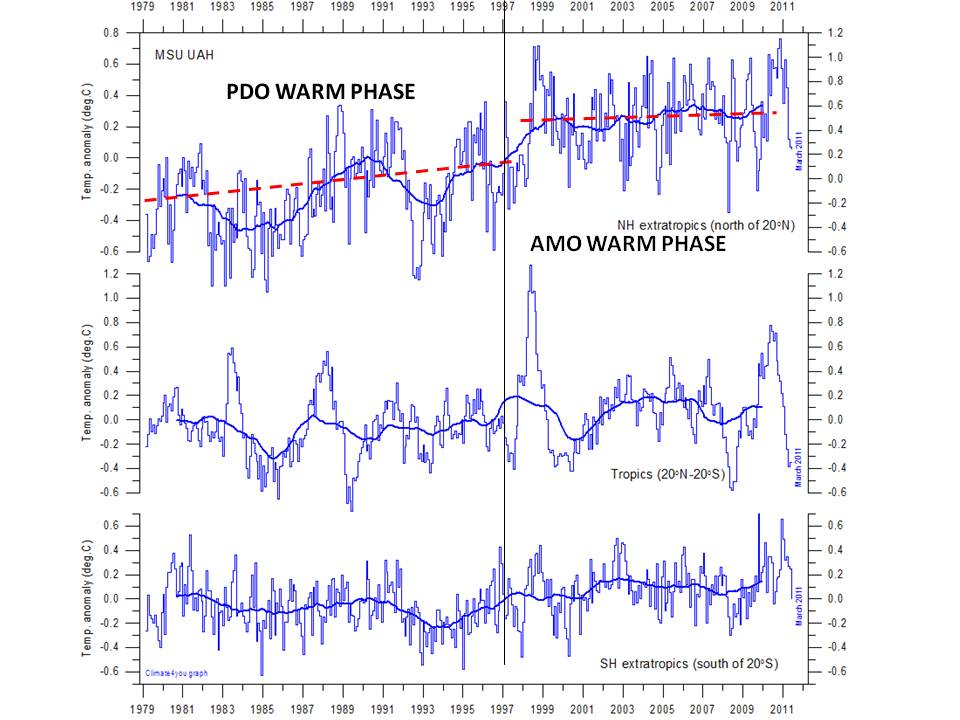
The AMO has a positive correlation most places across the northern hemisphere. This would explain the warmth since 1995. Note most warming is in the northern hemisphere.
You can see the step ladder discontinuity in northern hemisphere temperatures after the AMO flip in 1995. No statistically significant warming is seen in the tropics and southern hemisphere.The positive PDO phase from 1977 to 1998 with its predominance of El Ninos which produce warming had shown a gradual warming.

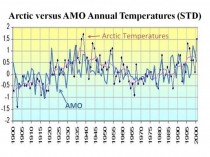
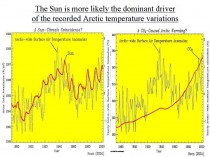
Look at how well the AMO correlates with the arctic temperatures.
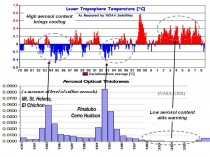
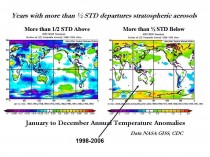
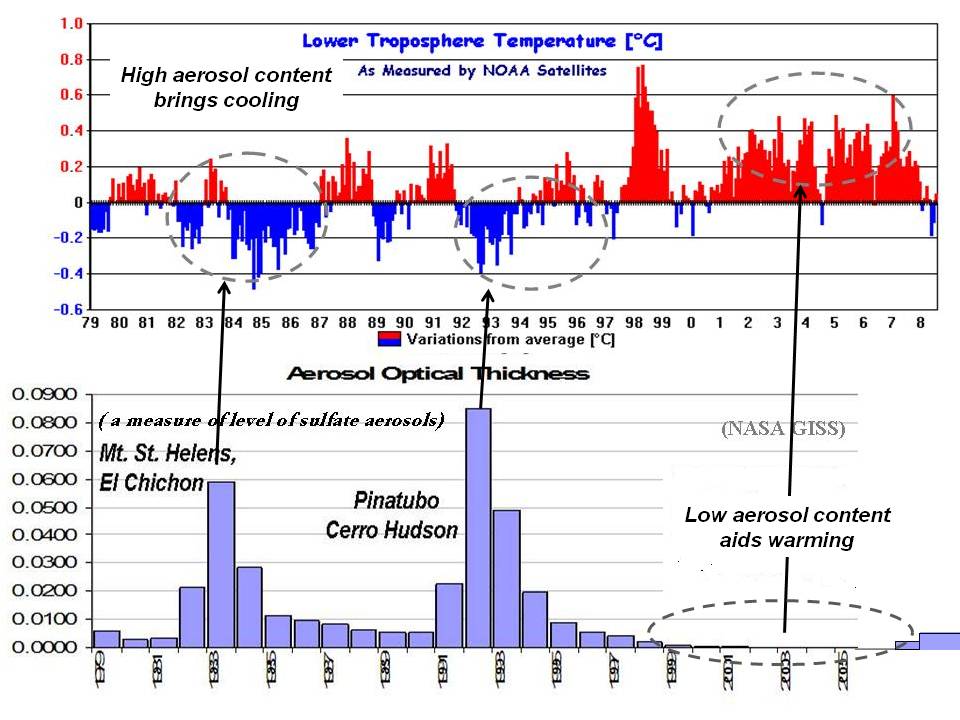
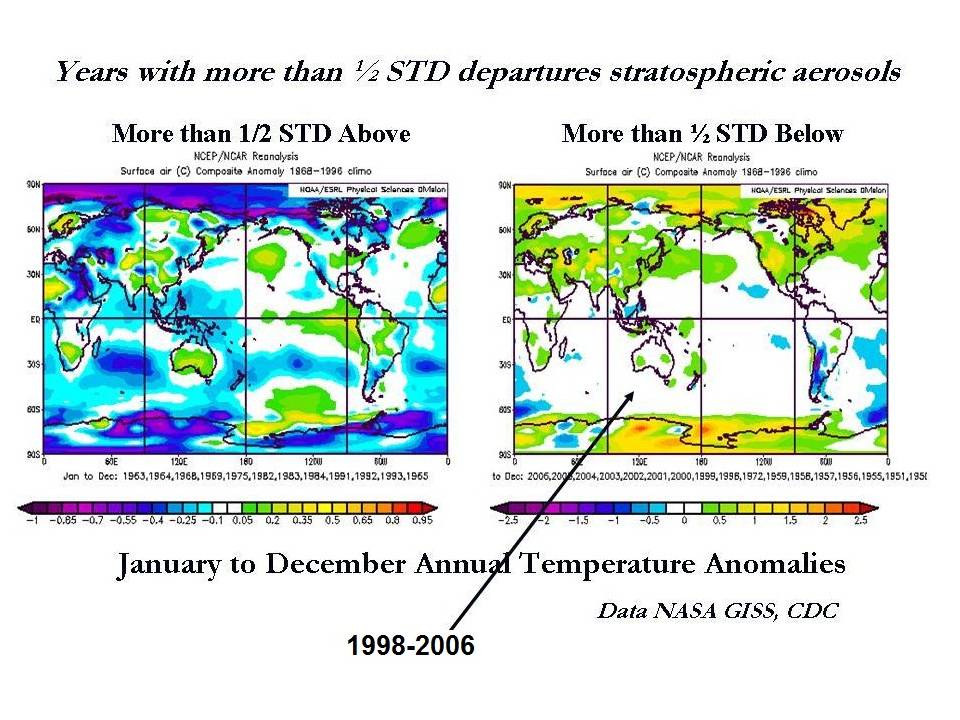
Add to the oceans and solar, the effects of volcanism - big volcanoes with cooling and quiet periods with warming and you can pretty much explain the observed changes despite the ‘models’. This also includes the arctic. Note next the cooling with high stratospheric aerosols and warming from low.
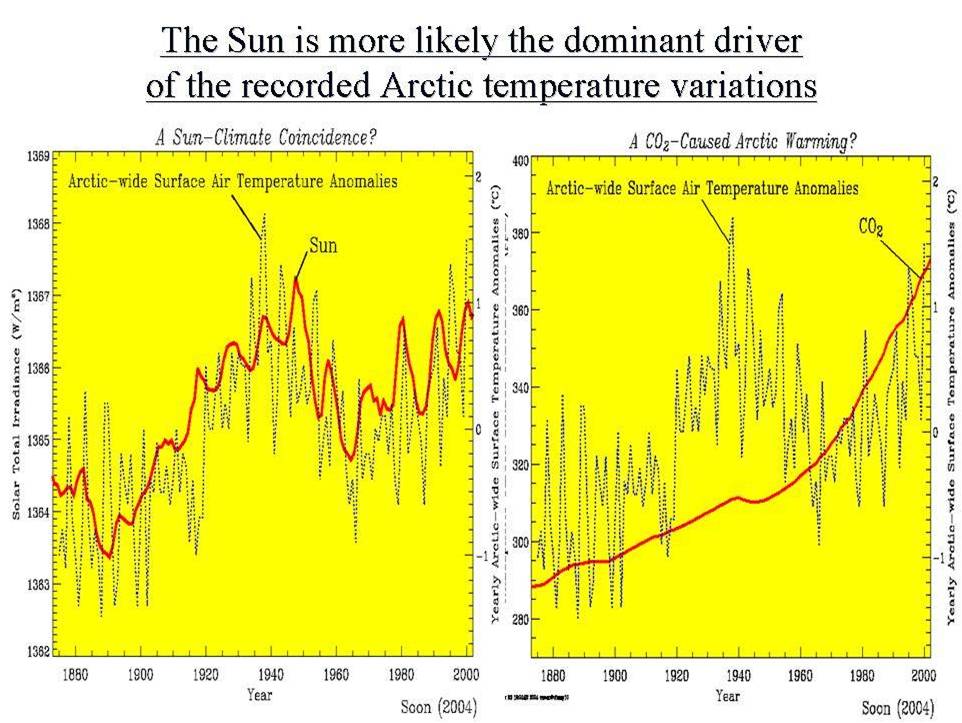
Bringing it full circle and you have the sun tying nicely with arctic temperatures (after Soon).
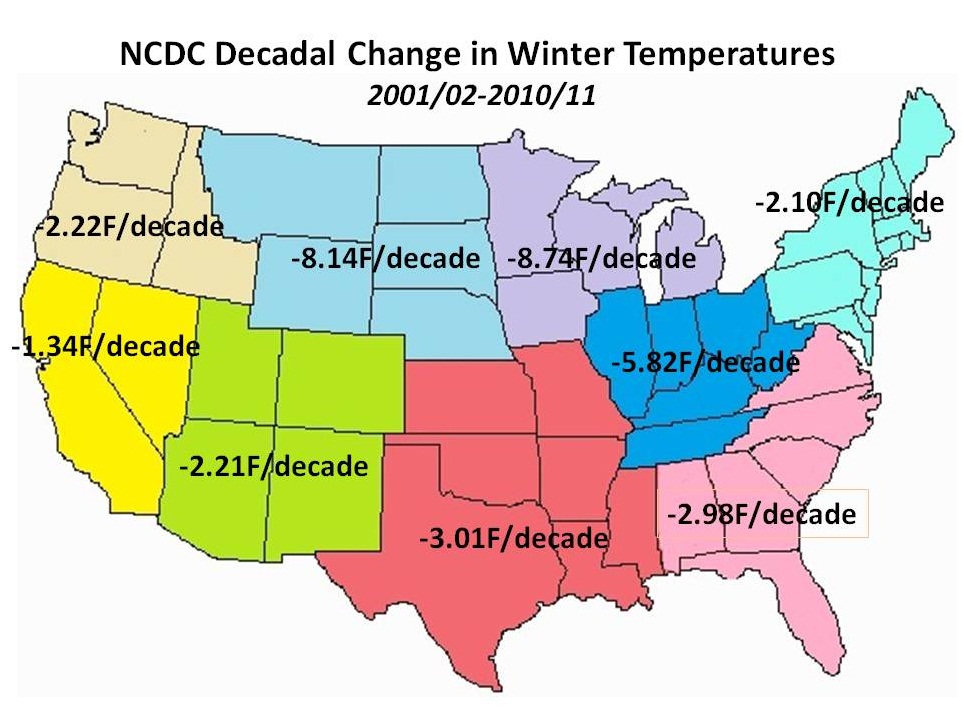
What does this mean for upcoming years/decades? Well if indeed the next few solar cycles harken back to the Dalton Minimum in the early 1800s, we can expect the Atlantic AMO to cool and global and arctic temperatures to decline. Throw in more volcanoes and winters will become even more memorable. We seem to be already on our way.
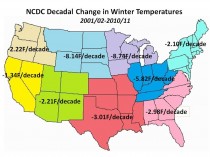
Also note the trend towards cold winters in the US the last decade.
Join us on Weatherbell.com.
http://icecap.us/images/uploads/GLOBAL_UAH_vs_PDO_AMO.jpg