Oct 14, 2025
Extremes - the real story
Joseph DAleo
Sep 28, 2025
Arctic Ice Rebound
By Jim Wallace
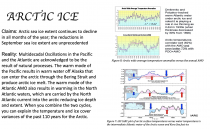
The total Arctic Ice Extent’s minimum, which occurs every year in September, was 36% higher in 2025 than its minimum in 2012, which was the lowest ice extent ever recorded by the NSIDC. On September 10, 2025, Arctic Sea Ice Extent likely reached its annual minimum extent of 4.60 million square kilometers (1.78 million square miles). The minimum is based on Advanced Microwave Scanning Radiometer 2 (AMSR2) data from the Japan Aerospace Exploration Agency (JAXA).
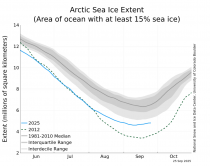
Source: NSIDC (National Snow and Ice Data Center)
The NSIDC has only been measuring the Arctic Ice Extent by Satellite since 1978 and only reporting it since 1981. But this data deserves more attention because ice extents are a much better indicator of any Global Warming than the so called Global Average Surface Temperature data - which has been shown to be totally fabricated. Moreover, CO2 and other Trace GHGs have been shown to have not had a statistically significant impact on any of 14 credible Earth temperature data (see: COMMENT ON EPA’S REPEAL OF ITS 2009 GREENHOUSE GAS ENDANGERMENT FINDING: https://thsresearch.wordpress.com/wp-content/uploads/2025/09/comment-on-epa-repeal-of-its-2009-ghg-ef.pdf, page 5, page 14 and page 16.
Moreover, research cited in this Comment (see Page 8) has shown that the Earth’s 14 most creditable temperature data patterns over this relevant time period are each ready explained by Natural Factors, most importantly the solar, volcanic and oceanic activity. The dramatic decline in UAH Lower Troposphere temperature data in 2025 shown below, is due entirely to Natural factors, and would be consistent with this Arctic Sea Ice Extent behavior.
Enlarged
Jul 24, 2025
WSJ Claim: Extreme Weather Driving Global Food-Price Surges
By Joseph D’Aleo, Meteorologist/Climatologist
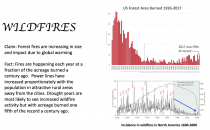
The authors claim: Extreme weather events are driving short-term surges in food prices around the world. Until we get to net-zero emissions, extreme weather will only get worse, but it’s already damaging crops and pushing up the price of food all over the world. The spikes are linked to heat, drought and heavy rainfall conditions, the report said.
Actually, extremes of weather are part of our climate system and are not worsening.
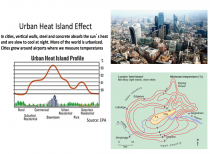
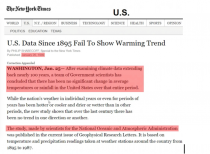
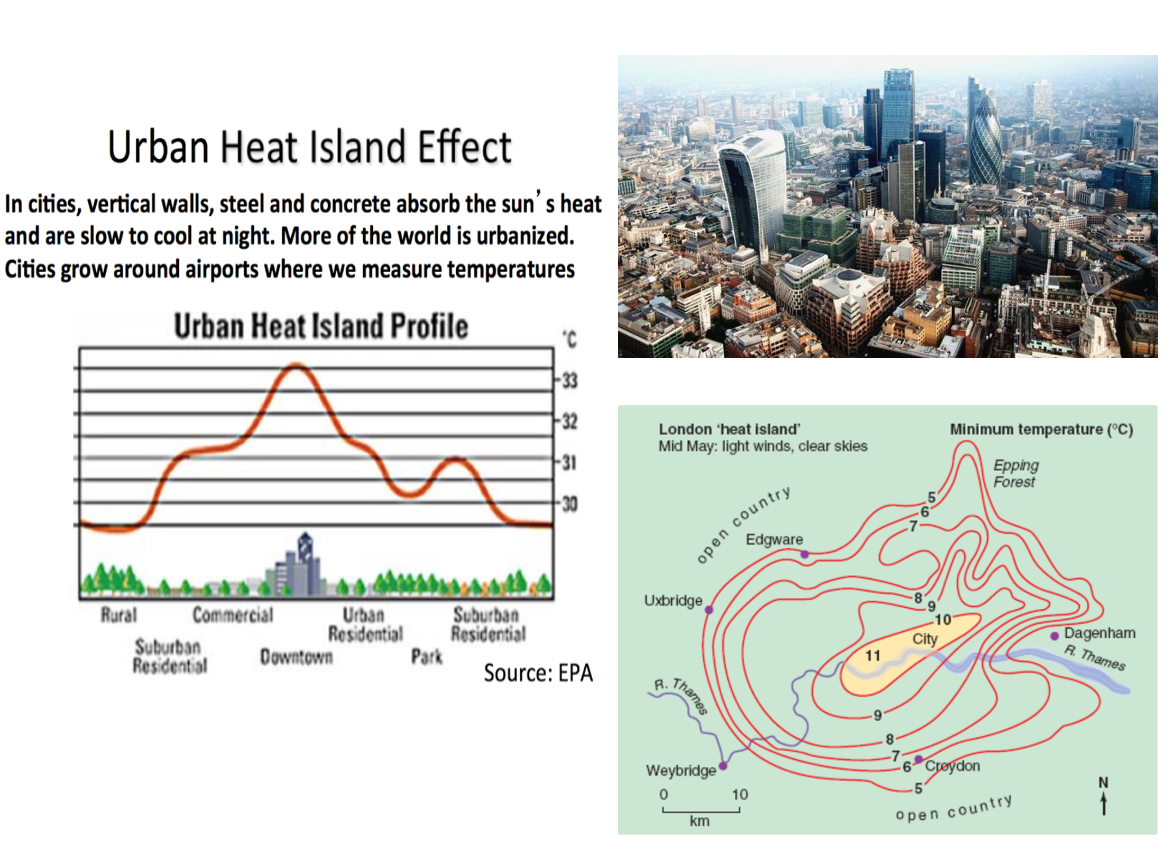
The warming that is claimed is primarily at nights and focused in urban locations. The urban heat island as it is called, actually reduces freeze and frost problems, benefiting crops early and late in the season. Daytime heat was far worse a century ago. The urban heat island drives an exaggerated view of climate change. This was recognized by NOAA when the temperature data was first introduced.
National Climate Data Center Director Tom Karl’s paper defined the Urban Heat Island (UHI) adjustments for the first version of its first Climate network USHCN in 1988:
He wrote “… trends of surface air temperature computed predominantly from urban station data are likely to have a serious warming bias of 0.34C/decade (about 6F/century)… The rate may have increased after the 1950s, commensurate with the large growth in and around airports (up from 20% to over 70%).
“Our results and those of others show that this ‘urban growth’… is serious and must be taken into account ... assessing temperatures.”
The Urban Heat Island in the 1970s and 1980s was increasingly recognized as a data contaminant that reflected a diminished cooling at night due to heat that was trapped in the urban areas.
Enlarged
Enlarged
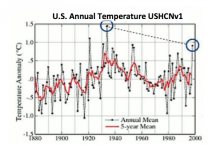
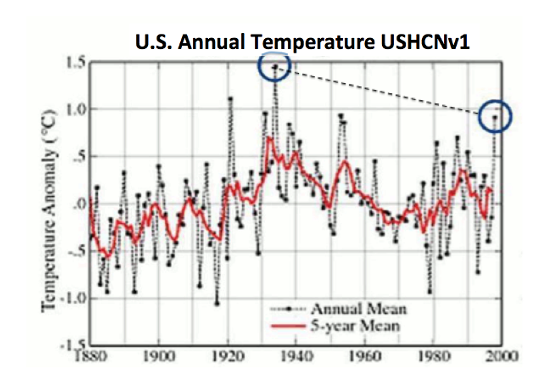
Crops are not grown in urban areas where growing urban heat island are resulting in slower cooling and higher temperatures at night. The original temperature data starting in the late 1980s had to be adjusted for the local nighttime trapping of heat. In 2000, the corrected data was showing the Dust Bowl heat of the 1930s were still warmest.
Enlarged
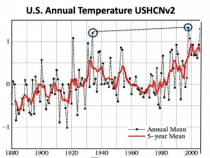
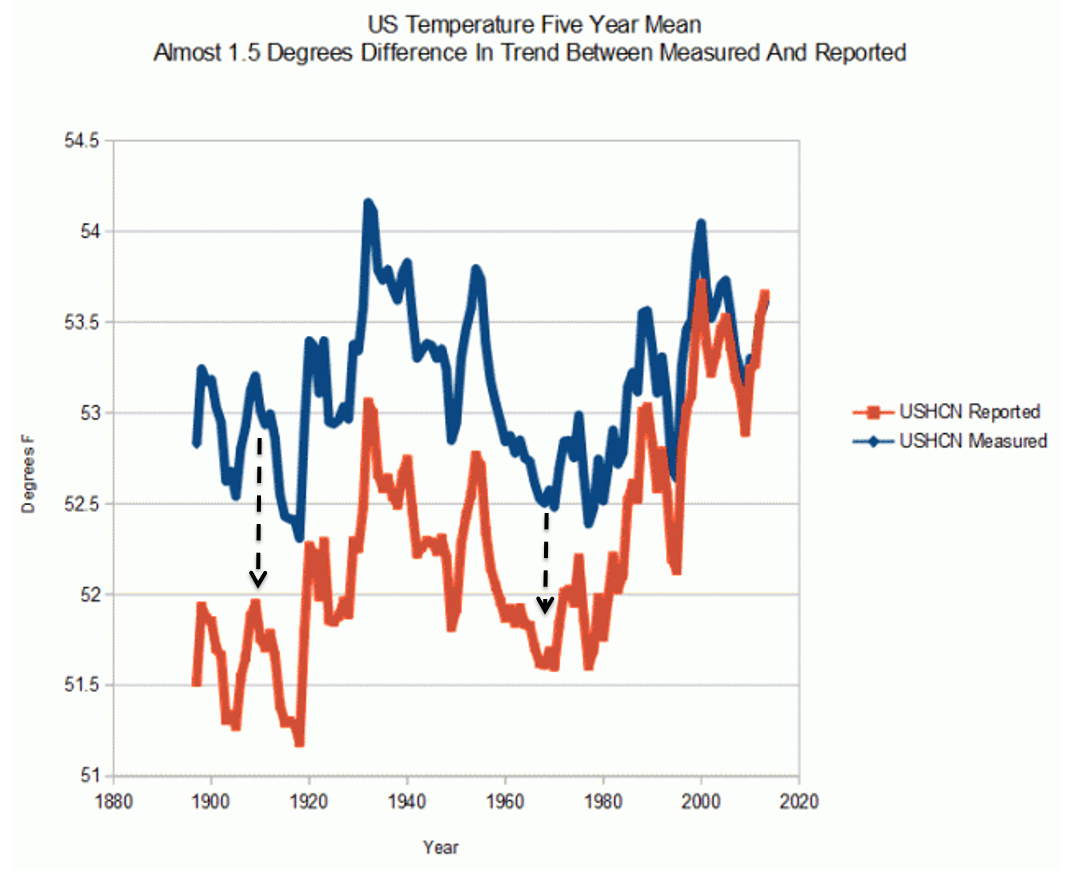
Inexplicably, the UHI adjustment Karl argued for was removed in USHCNv2 in the early 2000s.
Enlarged
NASA’s Dr. Edward Long in 2010 showed how the urban areas are warming with rural areas showed little change (mostly explained by ocean and solar cycles).

Enlarged
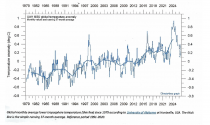
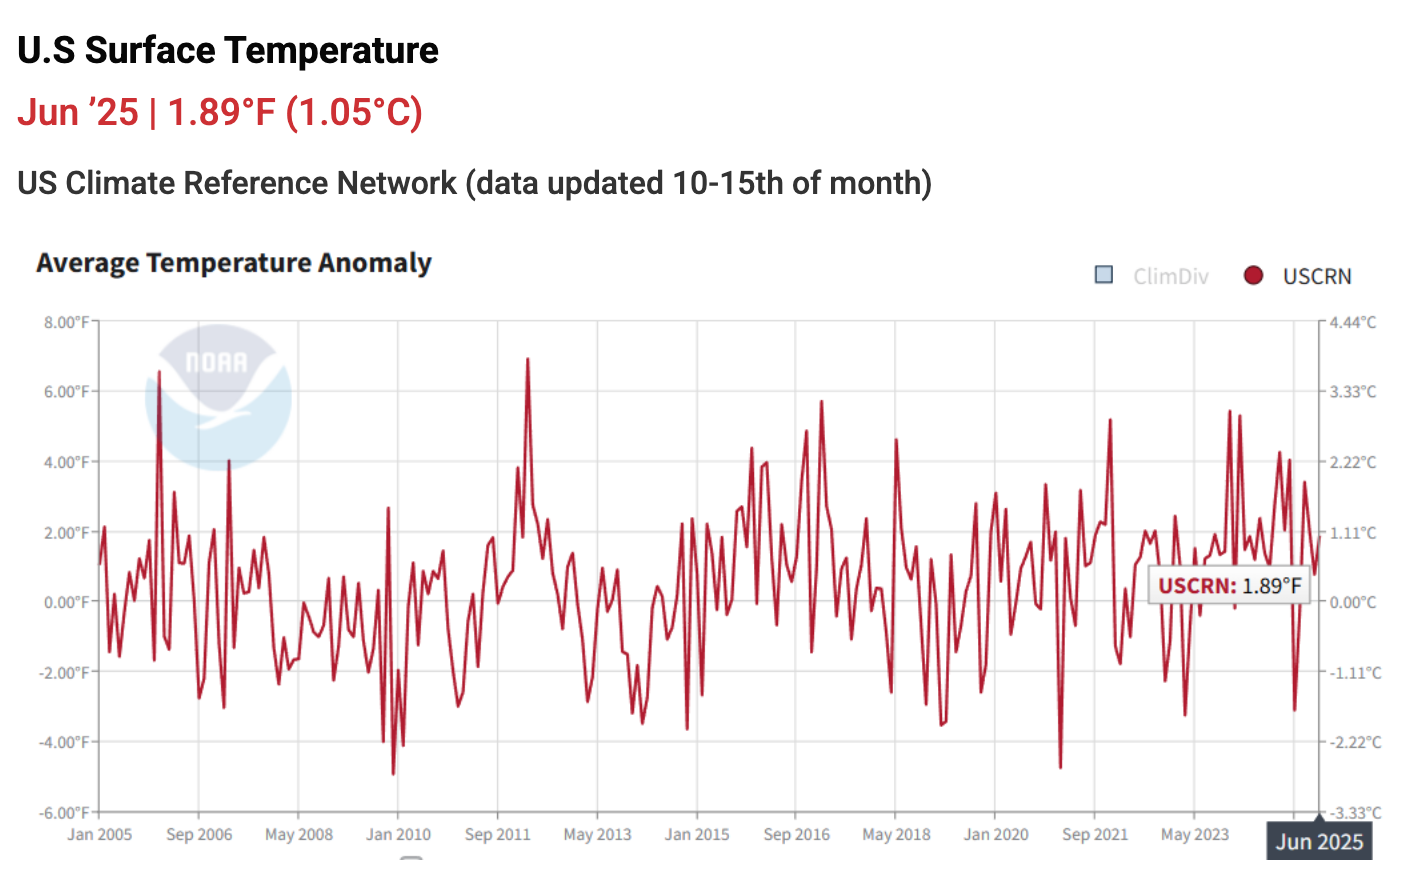
For more truthful tracking of the cycles, University of Alabama Huntsville, Climatologists Dr. John Christy and Roy Spencer, defined a subset of stations that are properly sited and not contaminated by urbanization in the country at nights. The US Climate Reference Network record from 2005 shows no obvious warming during this period. Each month, this data is updated by NOAA and Watts Up with That.
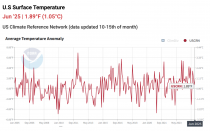
Enlarged
The graph shows the Average Surface Temperature Anomaly for the contiguous United States since 2005. The data comes from the U.S. Climate Reference Network (USCRN) which is a properly sited (away from human influences and infrastructure) and state-of-the-art weather network consisting of 114 stations in the USA.
These station locations were chosen to avoid warm biases from Urban Heat Islands (UHI) effects as well as microsite effects as documented in the 2022 report Corrupted Climate Stations: The Official U.S. Surface Temperature Record Remains Fatally Flawed. Unfortunately, NOAA never reports this data in their monthly or yearly “state of the climate report.” And, mainstream media either is entirely unaware of the existence of this data set or has chosen not to report on this U.S. temperature record.
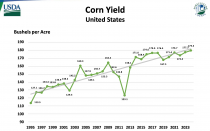
CROP YIELDS
The nighttime warmth in the cities has no effect on crops, largely because crops are grown in rural areas.
Yields for crops continue to rise. Our yields for corn, beans and wheat are routinely setting new records. The occasional drought year is the exception not the rule and when they come the yields are higher than previous droughts.
Enlarged
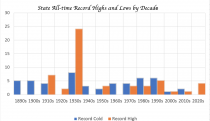
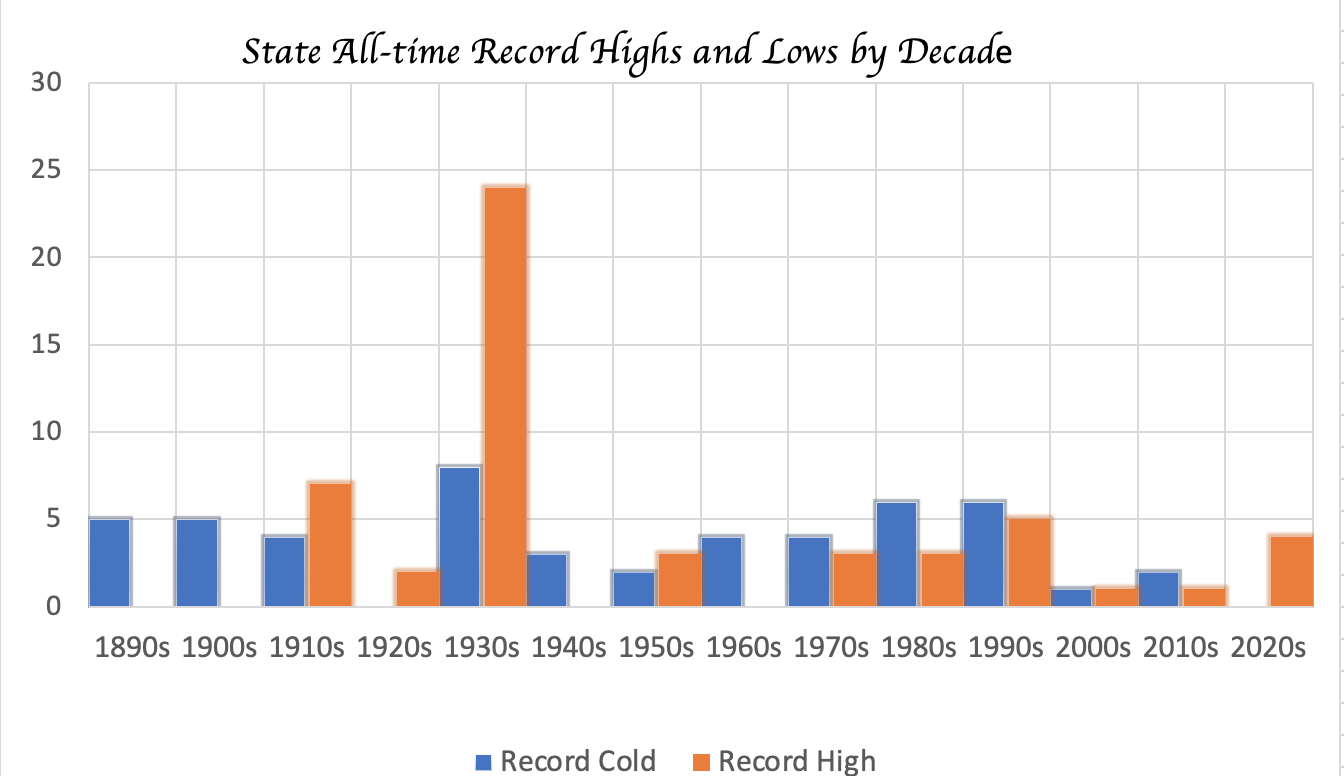
DAYTIME TEMPERATURES ARE NOT AFFECTED
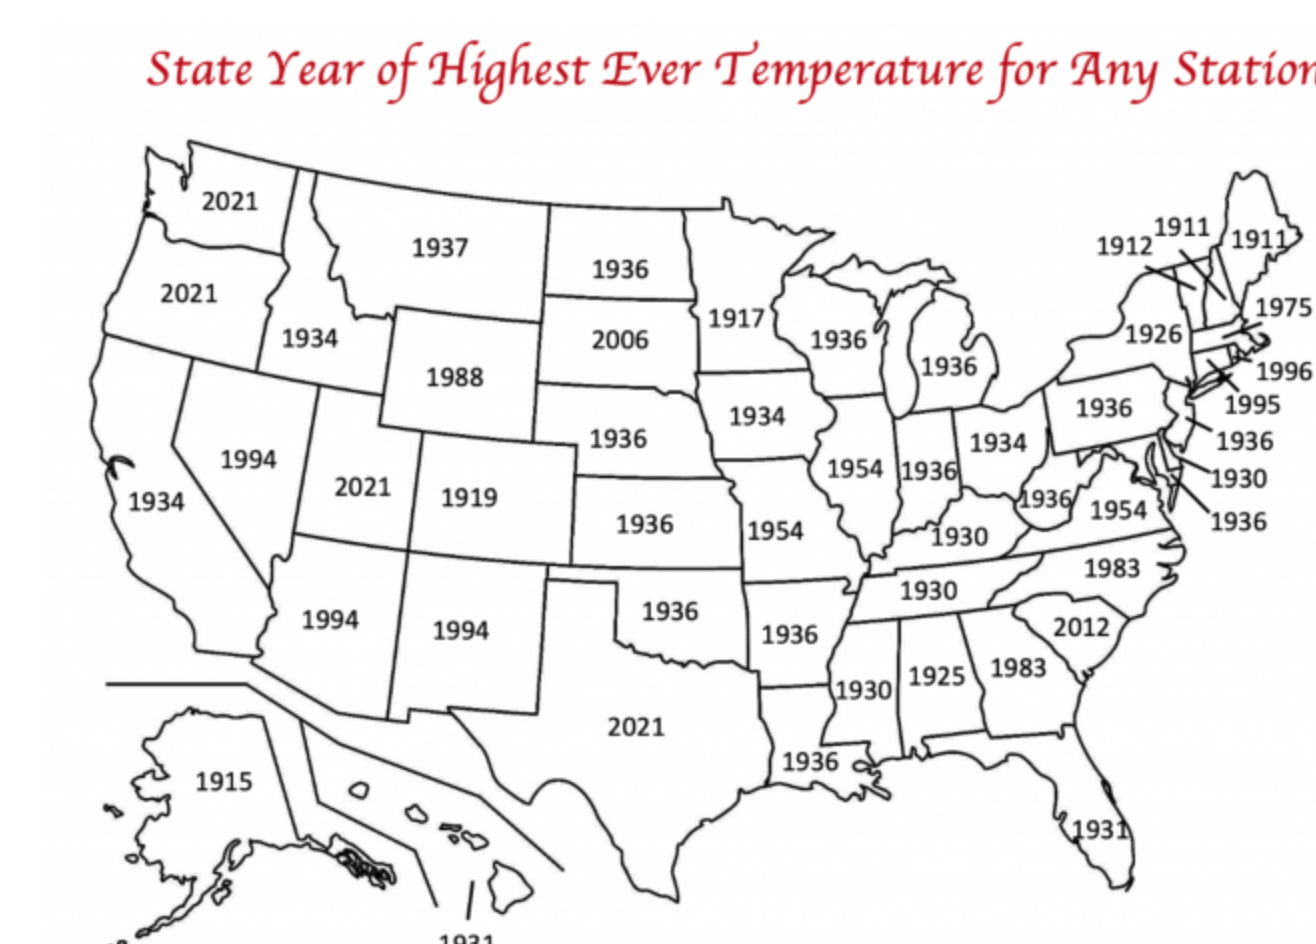
Almost all (24 of 50 states) set their all-time record highs in the 1930s.
Enlarged
Enlarged
Jul 12, 2025
Wisconsin’s climate isn’t in crisis
By H. Sterling Burnett
While climate scientists continue to debate the causes and possible consequences of climate change in general, what Americans really want to know is if climate change will impact their daily lives.
For this reason, The Heartland Institute has started a project that analyzes the impact of climate change at the state level. Mind you, climate models, contrary to their promoters’ claims, fail to model global climate fundamentals accurately. They don’t even get measured temperatures and trend lines right. They do even worse in tracking and forecasting changes at a regional scale than they do in their global assessments. Thus, climate models are virtually worthless in assessing what types of climate-related challenges individual states currently and may soon face. For that, one needs to turn to the data, which is the foundation for all good science.
Looking at Wisconsin, one finds that climate change not only poses no existential threat to the well-being of Wisconsinites but that it has actually benefited them in various ways.
Like much of the United States, Wisconsin’s average temperature has increased modestly since the late 1800s. In the Badger State, the increase has been 2 degrees F. However, some of the rise in average temperature is due to factors unconnected to long-term climate change.
Many surface station sites, primarily those in or near urban and suburban areas that have experienced growth over the past century, are reporting biased temperature readings. They are reporting higher average temperatures and a faster rate of change than temperature readings from nearby rural stations that have not been impacted by the development of artificial heat sources.
More pavement, buildings, concrete, and heat-generating and shedding machinery have compromised the accuracy of temperature measurements. Evidence of the urban heat island effect on Wisconsin’s reported temperature rise is confirmed not just by a comparison of rural and urban stations but also because of when the reported rise is being recorded—at night.
The artificial surfaces accompanying development absorb heat during the day only to release it slowly overnight, as evidenced by infrared cameras. So, Wisconsin’s temperature increase is largely a by-product of a slight increase in nighttime low temperatures.
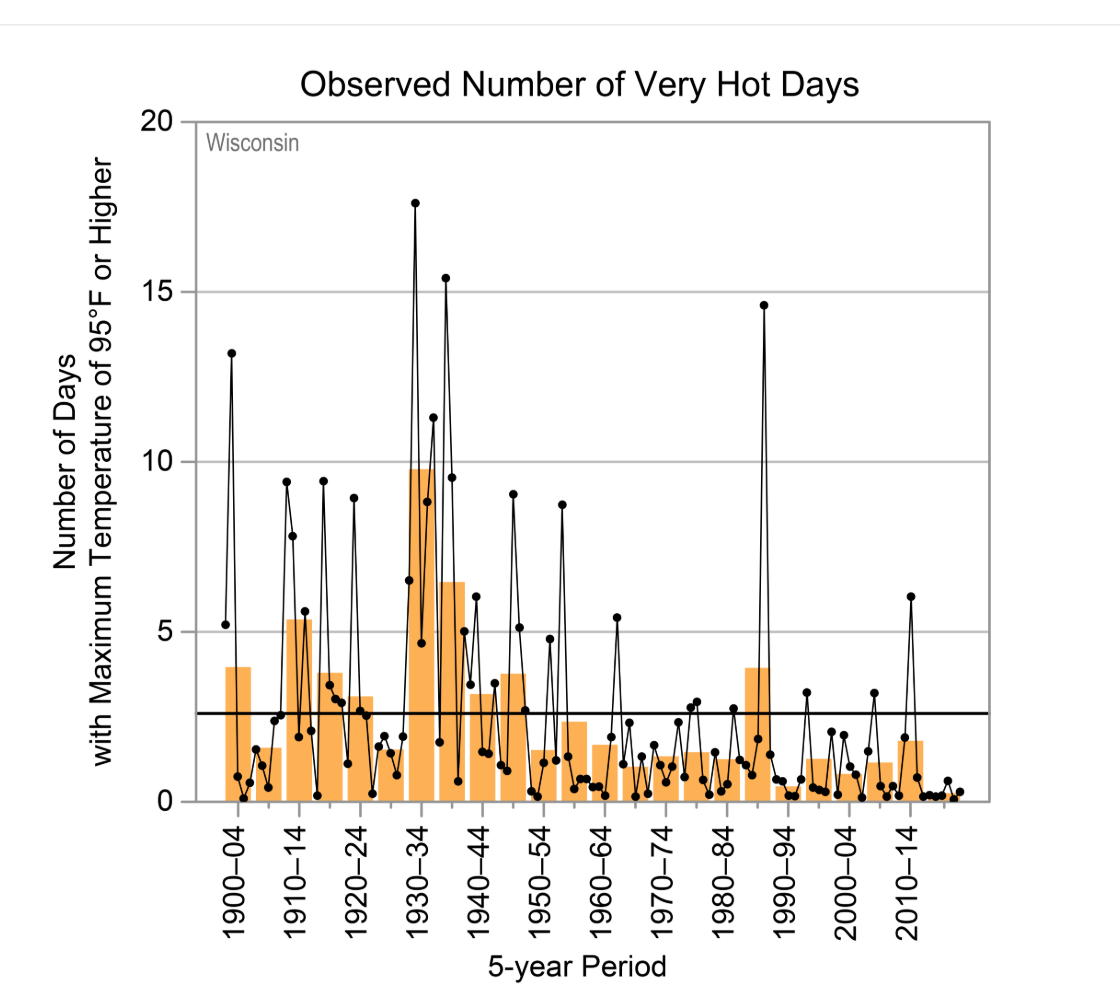
The good news is that the modest warming has not been accompanied by an increase in extremely hot days, which, in fact, have declined in recent decades, according to the Wisconsin State Climate Summary assembled by the National Oceanic and Atmospheric Administration.

Enlarged
Rather, the increase in state temperatures, not accounted for by urban heat bias, is due to a decline in extremely cold temperatures during the winter. That’s right, Wisconsin’s historically bitterly cold, life-claiming winters have become moderately less severe with a slight rise in nighttime winter low temperatures. This is a welcome development because research consistently shows cold temperatures take far more lives than hot temperatures. Over the decades, deaths caused by very cold temperatures have declined in Wisconsin. Who could complain about that?
Temperatures and the timing of temperature changes have effects beyond the thermometers. The moderate warming in Wisconsin has been accompanied by a slight increase in summer and winter precipitation. The number and frequency of droughts have declined over the past century as precipitation frequency and amounts have increased.
This rise in precipitation has also not been associated with an increase in the frequency or severity of flooding in the state or increased tornado strikes.
Additionally, the lengthened spring growing season, with fewer late-season crop-killing frosts, coupled with higher carbon dioxide concentrations, has been a boon for Wisconsin’s important agriculture industry. Wisconsin’s cheese production has increased by 87 percent since 1990. Corn and soybean production increased by 45% and 477%, respectively, over the same period. Cranberry production, which has been regularly monitored since 2007, has increased by 43 percent.
Of course, botany and agronomy explain the increase in production. Carbon dioxide (CO2) is plant food, helping plants grow faster and larger.
In the end, Wisconsin, like the entire world, is going through a period of climate change. But regardless of the role humans may or may not be playing in the present modest shift, contrary to the impression often given to Wisconsin’s residents by the mainstream media, there is no crisis.
Contrary to the endless predictions of an approaching climate Apocalypse, living conditions in Wisconsin have improved amidst modest warming.
H. Sterling Burnett, Ph.D., (hsburnett@heartland.org) is the Director of the Arthur B. Robinson Center on Climate and Environmental Policy at The Heartland Institute, a non-partisan, non-profit research organization.
Jun 26, 2025
It’s Hot Weather but not Manmade
By Steve Goreham
This week the United States experienced the first major heat wave of 2025. Over 160 million people in the Midwest, the South, and the East Coast experienced temperatures approaching 100F. Many in the media claim that the soaring temperatures are due to human-caused global warming. But a look at history shows that such high temperatures have been experienced many times in the past.
Extreme heat warnings were issued in Baltimore, Boston, New York City, Philadelphia, and Washington D.C. The Washington Monument was closed due to the heat. Dozens of daily high temperature records were broken. Heat indexes, which combine temperatures and the effects of humidity, exceeded 100 in Chicago, Pittsburgh, Philadelphia, and other locations.
Many media outlets reported that humans are responsible for the current hot weather. CNN reported that “heat waves are getting more dangerous with climate change” and that the current heat wave “bears the hallmarks of human-caused global warming.” NPR concluded that “human-caused climate change has made this heat wave three times more likely” due to emissions from “burning of coal, oil and gas.” Time stated that heat waves now occur “three times as often"in the United States as they did in the 1960s. But historical records do not support the media alarm about heat waves.
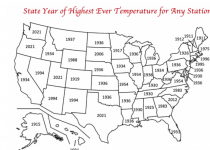
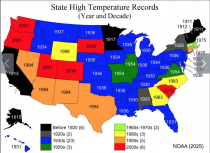
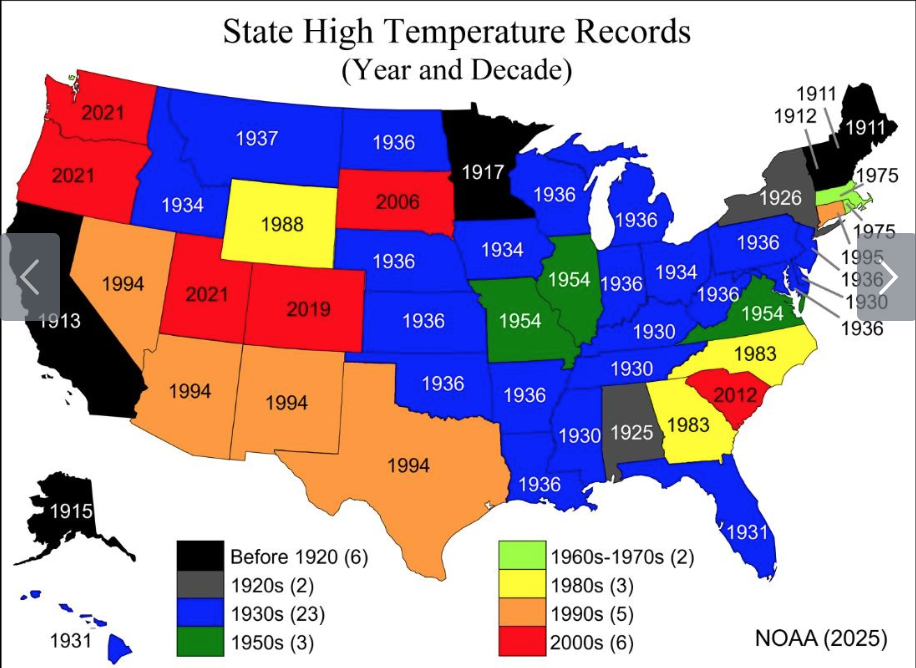
The National Oceanic and Atmospheric Administration (NOAA) tracks state record high temperatures and the date when they occur. The data shows that 36 of the 50 state record highs were set more than five decades ago. Twenty-three state record high temperatures occurred in the decade of the 1930s, when annual human CO2 emissions were less than one-eighth of today’s emissions. Despite endless headlines about heat waves, only 6 state high temperature records have occurred since the year 2000.
Enlarged
New York City temperatures rose to 102F at the peak of the heat wave. But the record high temperature for New York State is 108F, set in 1926, 99 years ago, in Troy, New York. Memphis temperatures reached 95F. But the record high temperature for Tennessee is 113F, set in Perryville in 1930. Richmond, Virginia temperatures reached 99F, but lower than the state record high temperature of 110F, set in Balcony Falls in 1954.
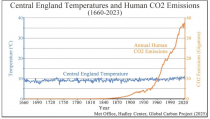
Temperature metrics from the National Aeronautics and Space Administration (NASA), NOAA, and the Climate Research Unit at the University of East Anglia in the United Kingdom (Met Office) show that average global surface temperatures have risen about 1.2C (2F) in the last 140 years. But is this rise caused by industrial emissions of greenhouse gases?
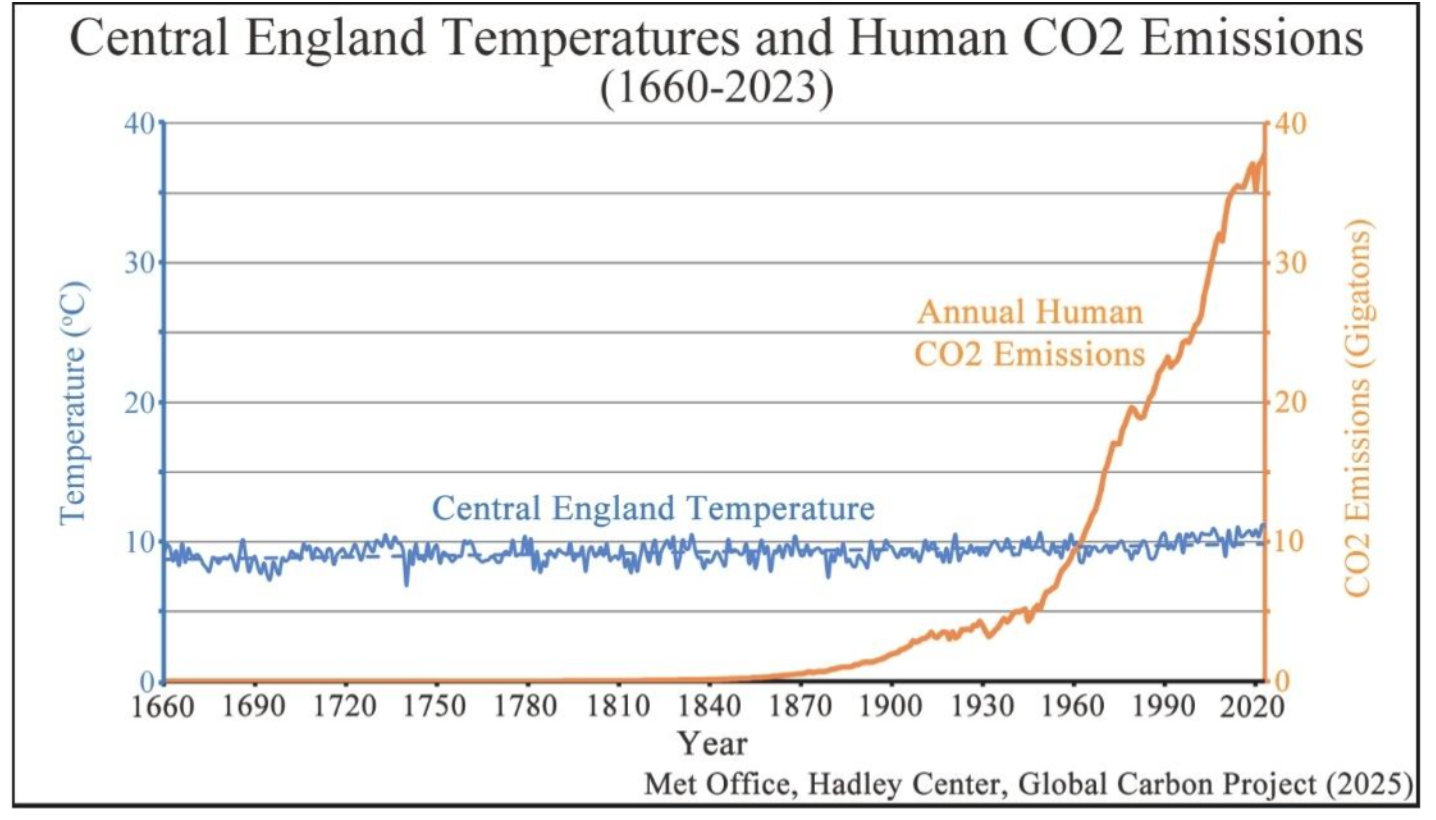
The Central England Temperature Data Set, provided by the Met Office Hadley Centre of the UK, is the world’s longest-running temperature metric. It shows that Central England temperatures have risen about 2C (3.6F) over the last 360 years, since 1660. Human carbon dioxide annual emissions were negligible until after World War II, but emissions have since increased by a factor of almost eight times. Yet the rate of change in the rise of Central England temperatures appears to be unchanged during the age of spiking global CO2 emissions. The evidence shows that temperatures are dominated by natural factors and that human emissions play only a small role in global warming.
Enlarged
Beware the high temperatures of heat waves this summer, drink plenty of fluids, and stay cool. Understand that temperatures in most locations have been warmer during past decades. Since nature drives Earth’s climate, our only sensible course of action is to adapt to climate change and rising temperatures.
Steve Goreham is a speaker on energy, the environment, and public policy and author of the bestselling book Green Breakdown: The Coming Renewable Energy Failure.
|

 See samples on WeatherBELL Facebook
Support Icecap efforts to combat scientific fraud and environmental fanaticism with generous donation via a secure access to Paypal
See samples on WeatherBELL Facebook
Support Icecap efforts to combat scientific fraud and environmental fanaticism with generous donation via a secure access to Paypal