Jun 06, 2025
Climate-Obsesseds’ Infantile Reading of Polar Ice
By Vijay Jayaraj
Whenever “experts are shocked” they usually have marginalized or ignored altogether factors wrongly assumed to have no influence over their hypotheses, theories or beliefs.
Nowhere is this more evident than in climate science where changes in geophysical phenomena continue to defy assumptions and forecasts presented by some of the most highly paid and influential scientists on the planet.
Among the most infamous examples is the failure of computer climate models to accurately predict real-world temperatures. This is predominantly due to the unscientific exaggeration of carbon dioxide’s (CO2’s) potency in warming the atmosphere.
Now scientists have encountered more “shocks” as polar sea ice is refusing to behave as expected. Since September 1, 2024, an astonishing 579 billion tons of fresh snow and ice have blanketed the Greenland ice sheet, marking the most significant accumulation for that date in at least eight years - far surpassing the 1981-2010 average.
Meanwhile, both the North and South Poles are defying expectations, piling on more ice despite, as reported in hyperbolic headlines, “record-breaking” global heat. It’s a breathtaking, almost surreal twist in the story of our planet’s climate!
According to NASA, “Arctic sea ice reaches its minimum extent (the area in which satellite sensors show individual pixels to be at least 15% covered in ice) each September.”
In the post-2010 era, the September minimum extent of Arctic sea ice occurred in 2012, which was also the lowest since satellite measurements began in 1980. But ever since 2012, ice has been increasing or oscillating well above that year’s mark.
Likewise, the volume of sea ice has not significantly dropped since 2012 and there has been a nominal increase in volume since a low point of 2020.
So, why is the minimum coverage of Arctic sea ice holding above the level of 2012?
One of the most obvious reasons could be that CO2 is not as powerful a temperature control knob, which is a possibility that many well-funded scientists refuse to even take into consideration.
Also, remember that we are in the Holocene epoch, a warm geological phase between two glacial advances - one that ended about 10,000 years ago and the next expected to occur some number of thousand years hence. An upward tick in Arctic temperatures shouldn’t surprise us regardless of whether we emit CO2 or not.
In fact, Arctic ice levels witnessed in the 17th century during the Little Ice Age was one of the highest since continental glaciers blanketed Canada and extended into the lower 48 states to create the Great Lakes.
At one point, news media were abuzz with the unexpected gain in Antarctica’s ice mass. Antarctica gained ice from 2021 to 2023, with studies showing nearly 108 gigatons per year added, mainly due to increased snowfall in East Antarctica.
Data from Vostok and Concordia stations in East Antarctica indicate extremely cold temperatures in early May, with minimums of minus 106.6 degrees Fahrenheit at Concordia on May 12. With winter just beginning the temperatures are likely to dive further.
As recently as 2023, Concordia station recorded one of its lowest temperatures for the current decade, a brutal minus 117.76 degrees. Similarly, at Western Antarctica’s Byrd Station, a likely all-time low of almost minus 50 degrees was recorded as recently as 2023. These numbers may be surprising, but they are in tune with the unpredictability of climate - and of nature in general.
Let’s just admit it. Things are not as “straightforward” as crisis-obsessed scientists are making it out to be. The climate system is complex, and the science is not settled. Our understanding of climatic dynamics is in its infancy. And to suggest that changes - whatever the direction - in polar ice presages a catastrophe is infantile.
Vijay Jayaraj is a Science and Research Associate at the CO₂ Coalition, Arlington, Virginia. He holds an M.S. in environmental sciences from the University of East Anglia and a postgraduate degree in energy management from Robert Gordon University, both in the U.K., and a bachelor’s in engineering from Anna University, India.
May 31, 2025
United States and Global Data Integrity Issues - oldie from 2009
Joseph D’Aleo ICECAP, Academia USA
ABSTRACT
Issues with the United States and especially the global data bases make them inadequate to use for trend analysis and thus any important policy decisions based on climate change. These issues include inadequate adjustments for urban data, bad instrument
siting, use of instruments with proven biases that are not adjusted for, major global station dropout, an increase in missing monthly data and questionable adjustment practices.
We hear official press releases announcing 2008 was the 8th, 9th or tenth warmest in 127 to 147 years in the various global data bases. Yet the NASA satellite record shows the year for the globe was the coldest this decade and 14th coldest in the 30 years of satellite monitoring. Here we will show how these global estimates are contaminated and can’t be trusted and certainly should not be used for important policy decisions.
US CLIMATE DATA
NOAA NCDC USHCN
When first implemented in 1990 as USHCN version1, it employed 1221 stations across the United States. In 1999, NASA’s James Hansen published this graph of USHCN version 1 annual mean temperatures:

About which Hansen correctly noted: “The U.S. has warmed during the past century, but the warming hardly exceeds year-to-year variability. Indeed, in the U.S. the warmest decade was the 1930s and the warmest year was 1934.”
USHCN was generally accepted as the world’s best data base of temperatures with the stations most continuous and stable, and adjustments made for time of observation, urbanization, known land use changes around sites, and instrumentation changes, each of
which can produce major contamination issues for temperature data.
URBAN HEAT ISLAND
There is no real dispute that weather data from cities, as collected by meteorological stations, is contaminated by urban heat island (UHI) bias, and that this has to be removed to identify climatic changes or trends. In cities, vertical walls, steel and concrete absorb the sun’s heat and are slow to cool at night. More and more of the world is urbanized (population increased from 1.5 B to 6 B in 1900s).
The UHI effect occurs not only for big cities but also for towns. Oke (who won the 2008 American Meteorological Society’s Helmut Landsberg award for his pioneer work on urbanization) had a formula for the warming that is tied to population. Oke (1973) found
that the UHI (in C) increases according to the formula
UHI= 0.73 log10 POP
where pop denotes population. This means that a village with a population of 10 has a warm bias of 0.73C, a village with 100 has a warm bias of 1.46C, a town with a population of 1000 people has a warm bias of 2.2C, and a large city with a million people has a warm bias of 4.4C.
Urban heat islands as seen from infrared sensors onboard satellites. Goodrich (1996) showed the importance of urbanization to temperatures in his study of California counties in 1996. He found for counties with a million or more population th warming from 1910 to 1995 was 4F, for counties with 100,000 to 1 million, 1F and for counties with less than 100,000, no change (0.1F).

NCDC’s Tom Karl (1988) employed a similar scheme for the first USHCN data base (released in 1990) that was the best data set available at that time. He noted that the national climate network formerly consisted of predominantly rural or small towns with populations below 25,000 (as of 1980 census) and yet that a UHI effect was clearly evident.

Tom Karl etal’s adjustments were smaller than Oke had found (0.22C annually on a town of 10,000 and 1.81C on a city of 1 million and 3.73C for a city of 5 million). Karl observed that in smaller towns and rural areas the net UHI contamination was relatively small but that significant anomalies showed up in rapidly growing population centers.
USHCN also maintained a METADATA base (not perfect) that identified changes in observing site locations and instrumentation and supposedly made adjustments accordingly, along with adjustment for change in the time of observation over the years.
See full story here.
May 17, 2025
Trump Administration Targets State Climate Laws
https://www.wsj.com/opinion/the-white-house-targets-state-climate-laws-fossil-fuel-energy-order-trump-ae9e7c50#comments_sector
A version of this article was originally published in The Wall Street Journal.
Hydrocarbon fuel producers gain a powerful ally with Trump’s order challenging rules to promote renewable energy.
In the Trump administration’s first 100 days, advocates for climate policy have been hit by actions to close climate departments, halt offshore wind leases, cut green energy funding, and impose tariffs on renewable equipment imports from China. Just when it seemed things couldn’t get worse, President Trump has ordered the federal government to challenge state climate laws.
Last month the President issued an executive order titled, “Protecting American Energy from State Overreach.” The order said that state laws “seek to regulate energy beyond their constitutional or statutory authorities.” It mentioned laws in California, New York, and Vermont and used the term “extortion law.” The order directed U.S. Attorney General Pam Bondi to “identify all state and local laws… burdening the identification, development, siting, production, or use of domestic energy resources that are or may be unconstitutional, preempted by federal law, or otherwise unenforceable” within 60 days. It also directed her to recommend “Presidential or legislative action” necessary to stop the enforcement of these laws. The federal government is now entering the climate battle on the side of producers of hydrocarbon energy, meaning coal, gas, and oil.
For the last 10 years, left-leaning states have enacted regulations to block the use of coal, gas, and oil and to force the adoption of renewable energy. These laws exceed states’ legal authority, aiming to dictate national and international energy policy. States and cities have imposed regulations and monetary penalties on producers of hydrocarbon energy that emit carbon dioxide when used. Businesses that consume hydrocarbons are forced to pay large sums to “trade” carbon credits. Coal, gas, and oil companies spend millions on legal fees to defend their right to produce energy.
In May 2024, Vermont passed its Climate Superfund Act holding “fossil fuel extractors” or “crude oil refiners” responsible for “costs due to climate change.” Vermont seeks millions of dollars in damages from companies that produced fuel connected to more than a billion metric tons of global greenhouse-gas emissions from 1995 through 2024. The law’s supporters blame Vermont]s July 2023 floods on climate change caused by emissions from oil companies. They apparently do not remember the Great Vermont Flood of 1927, the worst flood in the state’s history, which happened when global CO2 emissions were only ten percent of today’s. Vermont Lieutenant Governor S. Hollister was killed in the 1927 flood after getting out of his car into flood waters.

A car stuck in a river
New York enacted its own version, the Climate Change Superfund Act, in December. That law imposes a huge tax on hydrocarbon fuel companies, an estimated collective total of $3 billion a year, beginning in 2028.
Like Vermont, New York seeks payments from firms that produced fuel connected with global emissions of more than a billion tons of CO2 from a past period, in this case 2000 through 2018. In February, a coalition of 22 states along with several industry associations filed a lawsuit against New York officials responsible for implementing and enforcing the law.
Among other climate impacts, the New York act blames “rising sea levels” on the “historical polluters.” It is true that sea levels at The Battery Gauge in New York rose 0.96 feet from 1856 to 2024, a rate of almost seven inches per century. But the National Aeronautics and Space Administration has pointed out that ocean levels rose about 390 feet in the last 20,000 years. No scientist knows when natural sea-level rise ended, and human-caused sea-level rise began.
Maryland passed its Responding to Emergency Needs from Extreme Weather (RENEW) Act this month, seeking to “make polluters pay”. Legislators appear to believe that greenhouse gas emissions are causing extreme weather and storms to get stronger.
But evidence from satellites does not show that storms are becoming more frequent or stronger. Dr. Ryan Maue, formerly chief scientist at the National Oceanic and Atmospheric Administration, shows that the number of global tropical cyclones (hurricanes and tropical storms) has not been increasing over the last 50 years. Since 2006, the accumulated cyclone energy of tropical cyclones has declined to the lowest level since the 1970s.
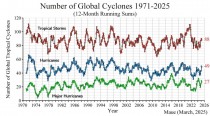
A graph of global cyclone
AI-generated content may be incorrect.
Efforts to enact “superfund” laws to seek monetary damages from fuel companies are also underway in California and Massachusetts. Voters rejected a similar proposed statute this month in Oregon. But Maryland, New York, and Vermont laws have serious legal weaknesses. The Constitution explicitly states that neither the Congress nor any state may pass an “ex post facto Law,” which imposes criminal liability for past actions that weren’t restricted at the time. The Maryland, New York, and Vermont acts all propose to tax companies retroactively for legally producing fossil fuels.
The 1970 Clean Air Act gives the Environmental Protection Agency the responsibility for establishing air pollution standards. States have responsibility for local and indoor air pollution, but not nationwide or global air pollution, as the superfund laws appear to cover.
In addition to superfund laws, more than 24 states and many cities and counties have sued companies for damages related to climate change during the last five years. Some of these suits have been defeated, but most are still in process or in appeal. To date, none of these suits have been awarded monetary damages against the fuel companies.
California, Oregon, Washington, and 10 Northeast states have cap-and-trade laws. These laws require companies that emit CO2 to buy allowances in trading markets and then deliver them to state governments based on their emission levels. Such systems raise costs for businesses and consumers. President Trump’s executive order mentions these cap-and-trade laws, so expect challenges from the federal government.
Earlier this week, the US Department of Justice filed suits against four states, Hawaii, Michigan, New York, and Vermont, opposing their climate laws against hydrocarbon fuel companies. Expect these state “extortion laws” to be struck down. The Trump administration has added the power of the federal government to energy companies’ challenges of state climate statutes.
Steve Goreham is a speaker on energy, the environment, and public policy and author of the bestselling book Green Breakdown: The Coming Renewable Energy Failure.
May 04, 2025
Invitation
Michigan Event
Steve Goreham and Dr. Calvin Beisner will be speaking in Grand Rapids the evening of Friday, May 23, from 7-10 PM Eastern time. The topic will be:
Climate Change: Fact or Fantasy?
Location: GR.Church, 4525 Stauffer Avenue, Grand Rapids, MI 49508
Tickets and Information

Please buy tickets and plan to attend if you are in the area.
----------
Below are two recent articles.
Time to Defund the Climate Models?
Published in MasterResource, April 29, 2025.
Climate models have been the basis for concern about climate change for more than 35 years. The US government, the United Nations, and organizations across the world have used model projections to warn about global warming and to demand a shift to renewable energy. But Trump administration budget cuts at NASA, NOAA, and other federal agencies threaten to shut down the models, the heart of climate change alarmism.
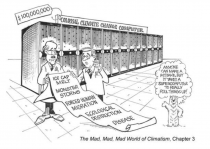
Cartoon of men holding a sign in front of lockers
US Military Exits Climate Change after a Decade of Waste.
Published in MasterResource, April 2, 2025.
The United States military has pursued an increasing number of programs to try to fight climate change for more than a decade. The air force, army, and navy each developed programs to use alternative energy and to reduce hydrocarbon-based fuels, with aggressive carbon dioxide (CO2) emissions reduction plans. But under the Trump Administration, climate change mitigation will no longer be an objective of the US military.
A logo of a navy ship

Globally warm regards,
Steve
Steve Goreham
stevegoreham.com
815-275-9532
Feb 26, 2025
RGGI more than doubles electrical costs for residents and all consumer sectors
Joseph D’Aleo ICECAP
First the softsell
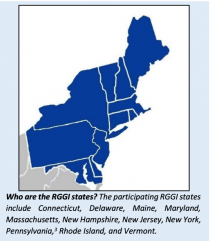
Greenhouse Gas Initiative
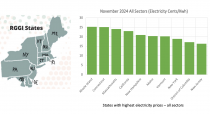
The Regional Greenhouse Gas Initiative (RGGI) is a cooperative effort among eleven Eastern states to reduce carbon dioxide (CO2) emissions from power plants within each participating state.Together, the participating states have established a regional cap on CO2 emissions, which sets a limit on the emissions from regulated power plants within the RGGI states.
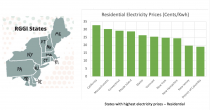
 Enlarged Enlarged
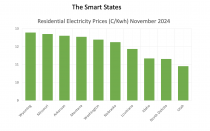
When you list the states with the highest electricity prices for the residential sector, the list has the RGGI states and no surprise California.
 Enlarged Enlarged
The lowest prices were in statesnd that have common sense energy policies.
 Enlarged Enlarged
The same holds for all energy user sectors - first highest prices and then lowest prices.
 Enlarged Enlarged
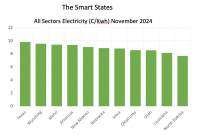 Enlarged Enlarged
The RGGI Fact sheet tries to sell the benefits to the state and users.
Regional Greenhouse Gas Initiative
The Regional Greenhouse Gas Initiative (RGGI) is a cooperative effort among eleven Eastern states to reduce carbon dioxide (CO2) emissions from power plants within each participating state. Together, the participating states have established a regional cap on CO2 emissions, which sets a limit on the emissions from regulated power plants within the RGGI states. Over time, the regional cap declines, so that CO2 emissions decrease in a planned and predictable way.
Since 2005, the RGGI 10 states have reduced annual power sector emissions 50%, which is almost 50% faster than the nation as a whole, and have so far raised over $8.6 billion to invest into local communities. How Does RGGI Work? Within the RGGI states, certain power plants must acquire one RGGI CO2 allowance for every short ton of CO2 they emit. The RGGI states distribute these allowances at quarterly auctions, where they can be purchased by power plants and other entities.
Some states hold a limited number of allowances in set-aside accounts to sell at a fixed price or otherwise distribute outside of the auction process. Once an allowance is distributed, it can be held and traded, which creates a secondary market for allowances.
|

