

By Steve Goddard
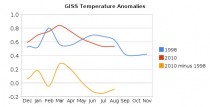
It appears almost certain that GISS will declare 2010 to be the hottest year ever (below, enlarged here).
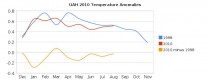
It is also almost certain that UAH, RSS and HadCrut will not agree with GISS. They will most likely place 2010 below 1998 (below, enlarged here).
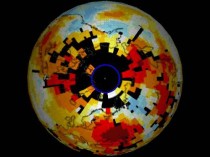
Dr Hansen has recognized the discrepancy, and explains it by his “better Arctic coverage”
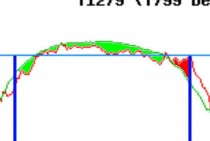
The blink comparator here (still below) shows GISS June-August (baseline 1958-2002) extrapolated (1200 km) vs June-August measured (250 km.) Note the large holes and the fact that there is little or no measured data north of 80N. Also note that GISS shows the region north of 80N as well above normal, despite the paucity of actual temperature data.
By contrast, DMI has a lot more actual temperature data, and shows June-August 2010 (north of 80N) well below the 1958-2002 mean.
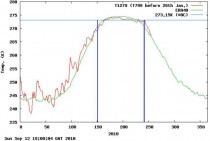
The DMI closeup below (enlarged here) shows 5518 pixels below normal and 1471 pixels above normal from June through August.
So which temperature record do you trust? Is 2010 really the “hottest year ever?”
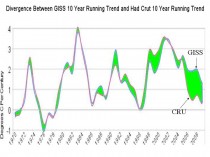
See post and comments here. See an earlier post on GISS divergence here. See the divergence of GISS from Hadley CRU Temperatures below, enlarged here.
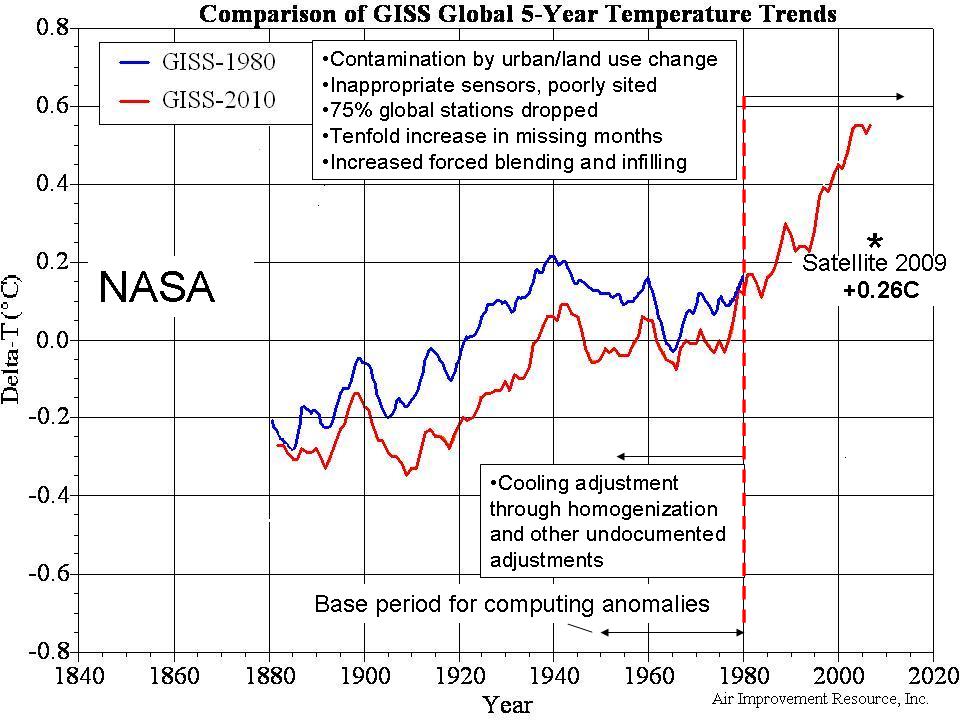
ICECAP NOTE: The many issues with the surface data set like urbanization unaccounted for, bad siting, inappropriate instrumentation, land use changes, station dropout and a tenfold increase in missing months leaving large holes requiring infilling from as much as 1200km away as in this arctic example, changing ocean measurement methods all induce uncertainty and predominantly warm biases. NASA and NOAA allows these to contaminate (warm) recent decades while applying homogenization and other “adjustments” to cool off the prior warm period further ensuring recent high rankings and greater century trends when raw, rural, well sited data shows little trend or even cooling.
Enlarged here.