

Lord Christopher Monckton
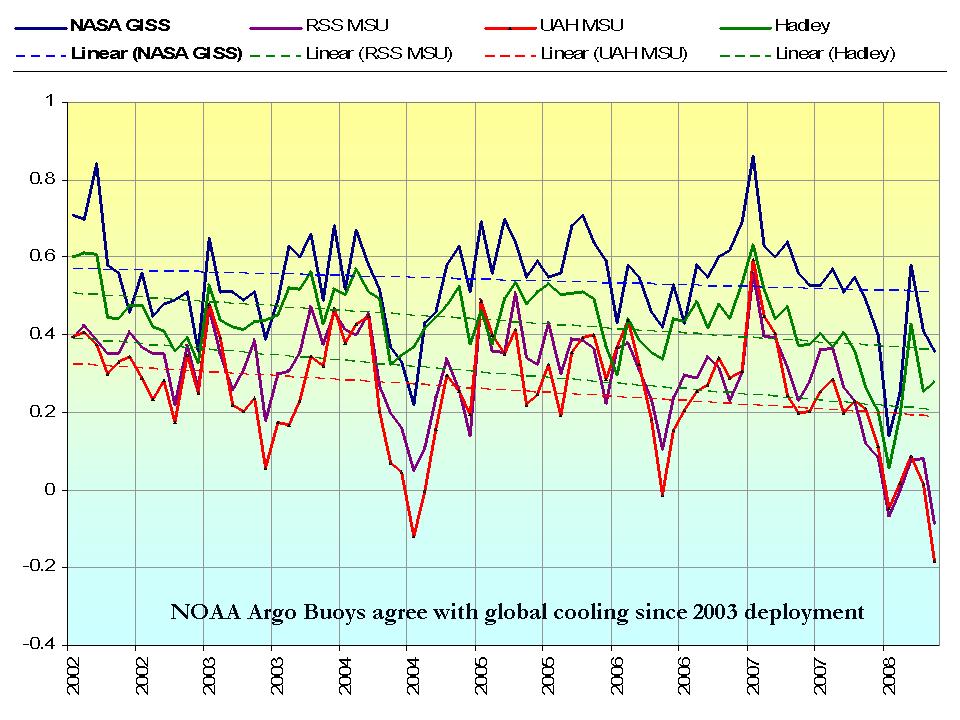
In a blog post, Bill Chameides says “global warming” is still happening. It isn’t. As the global temperature graph below shows, all four of the world’s major global surface temperature datasets (NASA GISS; RSS; UAH; and Hadley/University of East Anglia) show a decline in temperatures that have now persisted for seven years.
‘Global warming’? What ‘global warming’? All four of the world’s major surface temperature datasets show seven years of global cooling. The straight lines are the regression lines showing the trend over past seven years. It is decisively downward. Chameides’ graph overleaf appears to have been tampered with to exclude the very rapid cooling that occurred between 2007 (the curve stops in January 2007, when a strong El Nino artificially but temporarily boosted temperatures) and 2008. The fall in temperatures between January 2007 and January 2008, carefully not shown on Chameides’ graph, was the greatest January-January fall since records began in 1880.
See larger image here
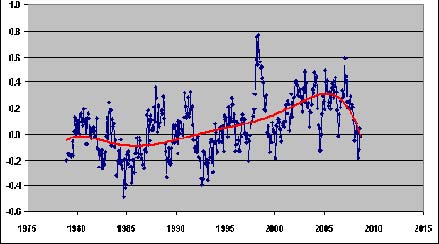
The UAH graph provides a complete answer to the Chameides’ attempt to suggest that skeptics” are confusing short-term and longer-term temperature changes. The year 2008 will turn out to have been no warmer than 1980 28 years ago. This is not a short-run change: the cooling trend set in as far back as late 2001, seven full years ago, and there has been no net warming since 1995 on any measure. Next, Chameides attempts to suggest that the recent cooling is caused by solar activity. He could well be right - however, if so, by the same token the warming that stopped in 1998 could also have been caused by solar activity - there was, after all, a solar Grand Maximum in the last 70 years of the 20th century, during which the sun was more active and for longer than at almost any previous similar period in the whole of the past 11,400 years.
Scafetta and West (2008) attribute more than two-thirds of the warming of the past 50 years to solar activity - the latest in a series of papers in all parts of the scientific literature that explicitly question the exaggerated estimates of climate sensitivity`perpetrated by the IPCC. Chameides’ final, desperate point is that the “green diamonds” he has so carefully selected from the 5-year running-mean graph that he has equally carefully blotted out show continuously-rising temperatures that overlay what he calls the short-term cooling.
Not so. As the first graph above shows, the linear regression not just for the past five years but for the past seven years shows a decisive and continuing cooling. Keenlyside et al. (2008) do not expect a new record year for global temperature to occur until at least 2015. If they are right, then the IPCC’s climate-sensitivity estimates must be - as Monckton (2008) finds them to be - prodigious exaggerations. False data will no longer convince any impartial mind to believe in the fantasy of anthropogenic “global warming”?

See larger image here