It was -2F Sunday in Boston and -3F pre-dawn Monday after the fourth major snowstorm in just over 3 weeks left behind 16.2 inches bringing the 23 day total to 90.2 inches. This may be the worst snow blitz since the Great Snows of 1717.
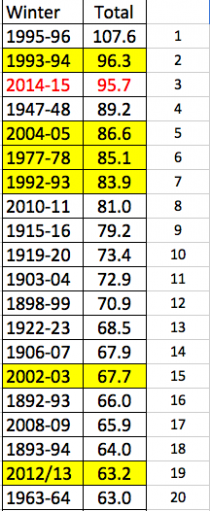
The total for the year is 95.7 inches, 3rd greatest for any season. It is just 0.6 behind 1993.94 (#2) and 11.9” behind the record of 107.6” (1995/96). The top 20 snow years are shown. the yellow years are the ‘analogs’ based on ocean, atmospheric and solar/lunar factors we used to predict a cold eastern winter this year and the historic one near the Great Lakes last year (7 of the top 20 years were analogs). Since we don’t have all the factors before 1950, we use analogs only after 1950. Some of the other years may have been good matches or analogs if we had that data for all the factors before 1950.
The average snow/melted ratio for the 4 big storms and the minor ones was about 18 to 1, which belies the idea the heavy snow was due to warm water hundreds of miles of the coast. Each of the major snows came with temperatures in the teens or lower. We have set records for February and any calendar month and likely snow depth (Blue Hill broke the 1995/96 record for snow depth).
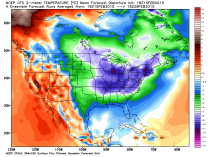
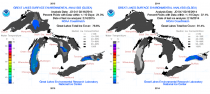
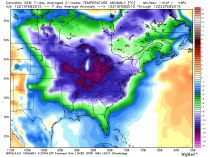
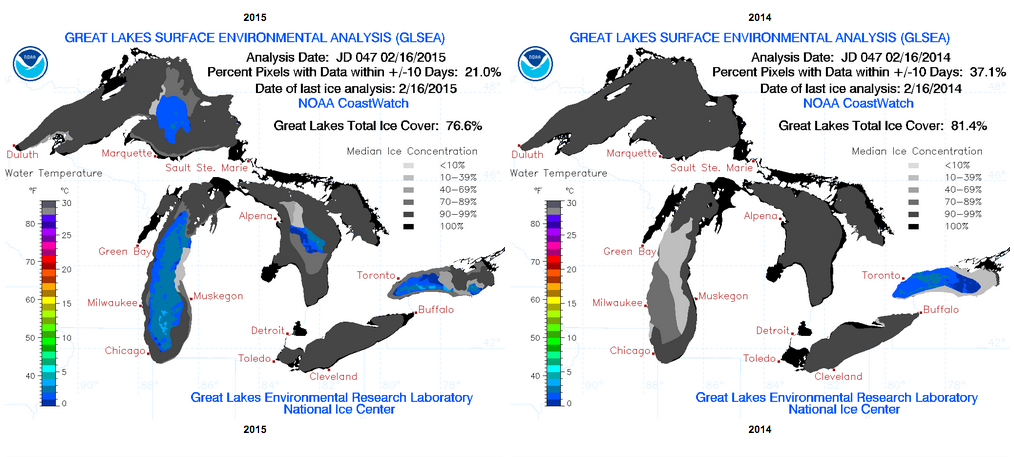
And now areas to the south and west will get heavy snows and ice while the Great Lakes sits in frigid sub zero cold the next 10 days which is causing ice to increase rapidly approaching last year’s record.
_thumb.png)
The warmists have proposed that global warming induced warming of the western Atlantic was responsible for the big Boston snows. Warm water they postulate means more moisture for snow and rain. While moisture feeds storms, you need contrast with very cold air to produce heavy snows and this year it is the cold that is driving the fluffy 90 inches of snow in Boston.
First of all as noted, the 90.2 inches of snow in the last 23 days in four nor’easters came from 5.02 inches of water. This 18 to 1 ratio is well above the normal 10-1 ratio in the ‘average storm. It is because the air is so cold with snow during the events falling with temperatures mostly in the teens.
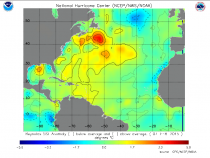
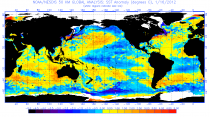
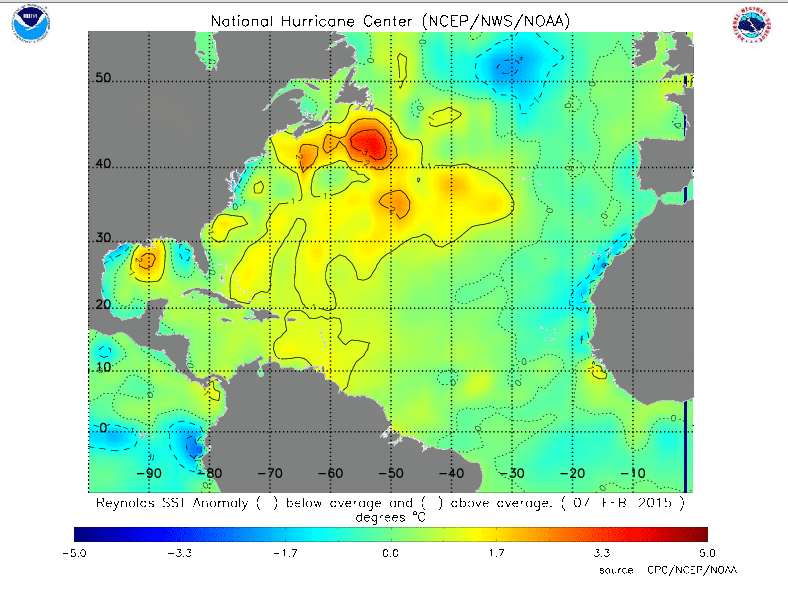
Also there is no evidence that the water just east of Cape Cod is 11.5 (21F) above normal as tweeted. NOAA’s National Hurricane Center Analysis showed water no more than 2 or 3C above normal well to the east of Cape Cod and with the very cold weather this month (over 11F below normal in the northeast), the water near the coast is colder than normal with ice forming. Ice is seen as far south as off the New Jersey Coast and will likely clog Boston and New York Harbor in the brutal cold of the next 10 days. Freezing spray warnings are in effect in the waters around NYC this morning.
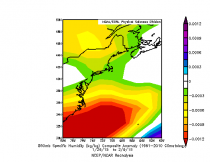
And the atmospheric water content (Specific Humidity) during the stormy period is BELOW NORMAL not above normal because the air is so cold on land and offshore.
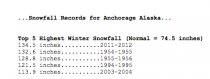
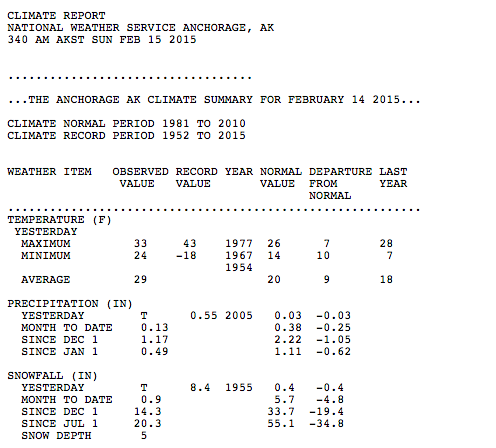
Let me give you another example. The water off of Alaska has been warm the last two years.
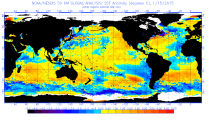
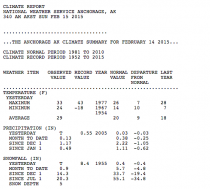
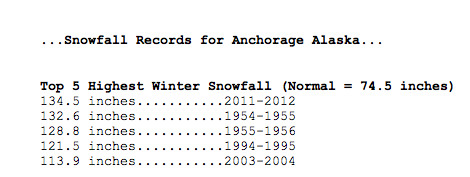
One who believes that drives heavy precipitation would surely believe this would generate well above normal snows in places like Anchorage in winter. Notice the snow this season to date has produced just 20 inches in Anchorage, 35 inches below normal.
The Gulf of Alaska water on the other hand was very cold in 2011/12. Record snows fell in Anchorage with temperature 14.5F below normal. Record Bering Sea sea ice also occurred.
.png)
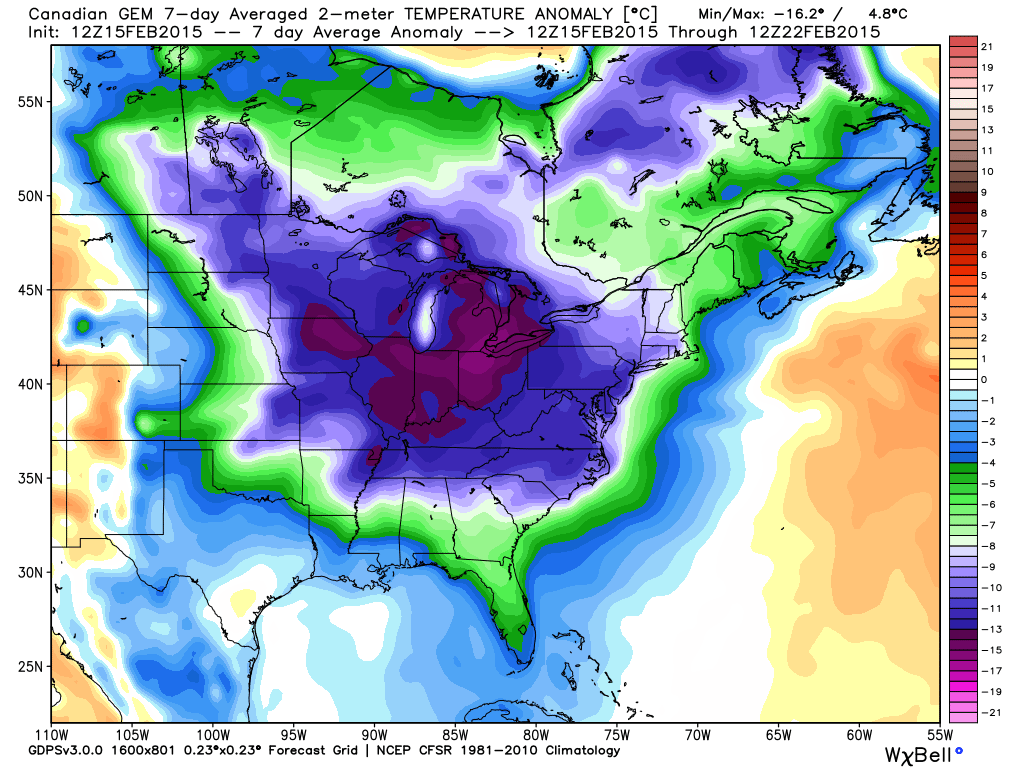
By the way Boston is rivaling February 1934 as the coldest month ever in Boston since 1872. So far, though today, Boston has averaged about 12.3F below normal for February. 1934 averaged -12.7F below normal. Some models are predicting the rest of the month to average 15F below normal, which would make this the coldest month of any month since 1872.