

Joseph D’Aleo, CCM, AMS Fellow
This is a supplement to the On the Validity of NOAA, NASA and Hadley CRU Global Average Surface Temperature Data & The Validity of EPA’s CO2 Endangerment Finding Abridged Research Report of June 2017 New Research Report. This post contains some of the same charts and some new ones.
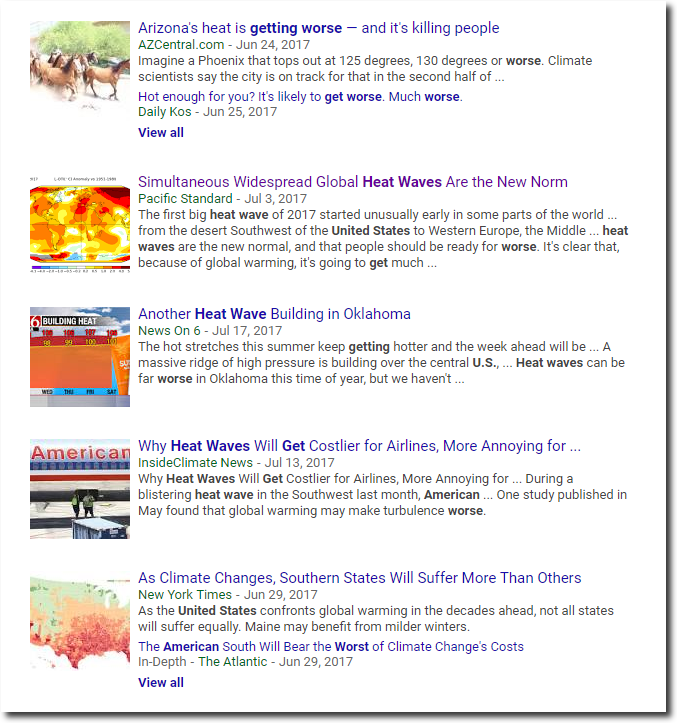
Meanwhile, the NRDC comes out with another report that will fail like all their prior scares. They claim that heat deaths will explode unless we redistribute our wealth as prescribed by the Paris Accord. Heat extremes have been forecast for decades to be increasing and if listen to the media, you would believe it has. CEI takes them to task for their alarmist hype here.
----------
Here is my take on it.
The fact is heat has been declining for decades using real data.
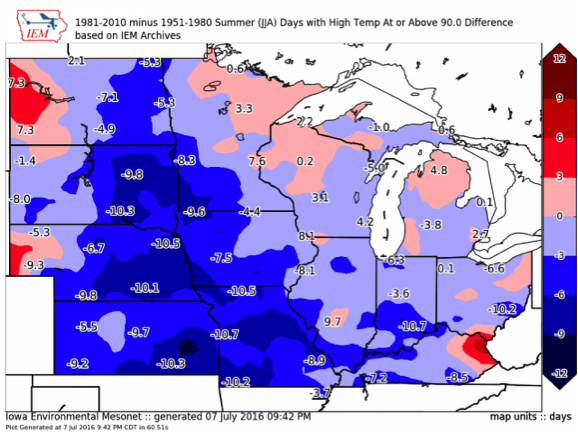
Iowa State University Mesonet posted this chart showing that for many areas through July 4th, the number of 90F+ days relative to the 1981-2016 to date average is below normal (so far) in 2017 in many areas, especially the southeast.
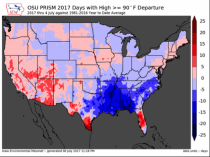
Enlarged
They also last year posted that the number of 90F days has declined for the 1981-2010 period relative to 1951 to 1980.
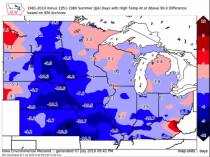
Enlarged
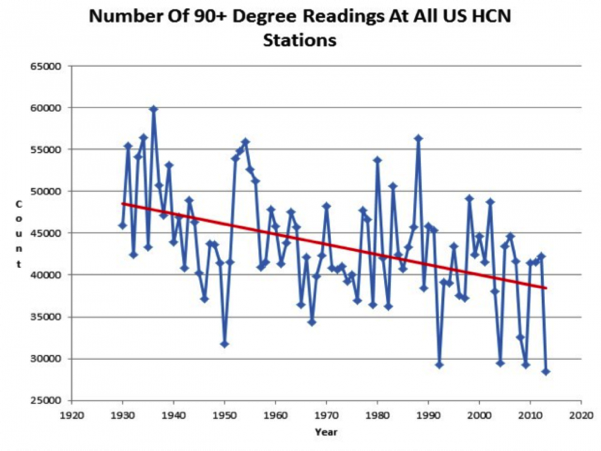
This agrees with the plot of the annual number of 90F days for all USHCN stations (Heller).
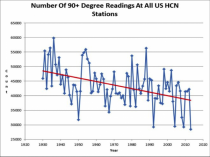
Enlarged
Which reflects the EPA Heat Wave Index annual plots since 1895 (Kunkel) and the number of decadal all time state records (Christy).
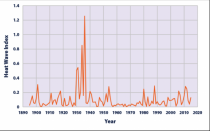
EPA Depiction of Heat Wave Index (Kunkel) Since 1890
Enlarged
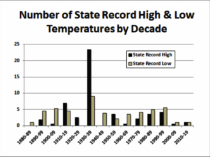
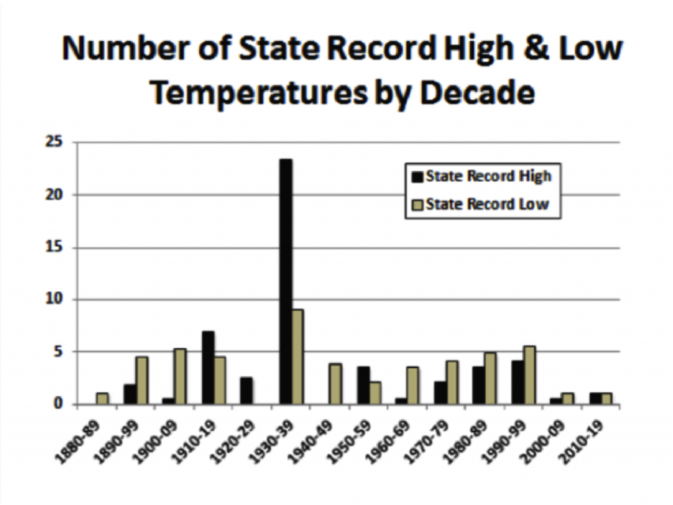
This agrees with the plot of all-time state record high (and low) temperatures (Christy). The 1930s had 23 of the 50 state all time heat records and there were 38 before 1960 with more record lows than highs since the 1940s.
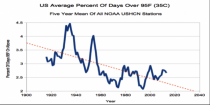
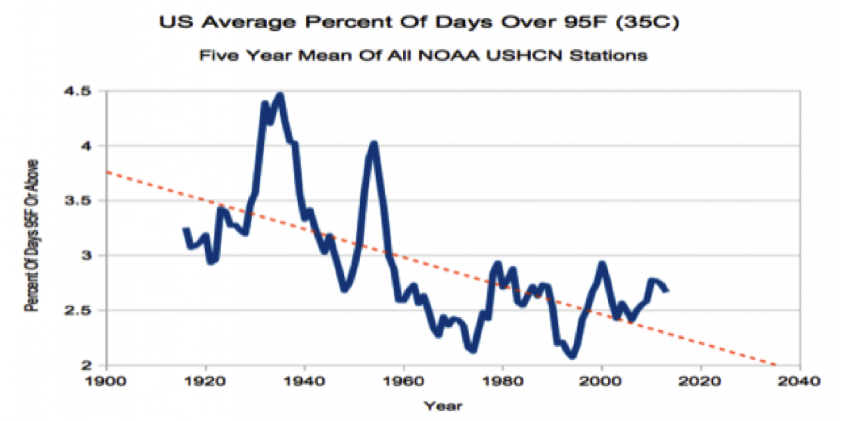
The average percent of 95F days has declined for all USHCN stations (Heller).
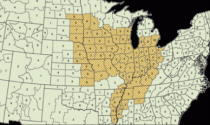
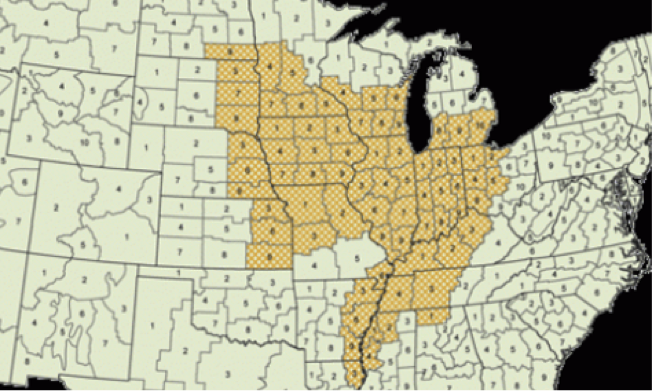
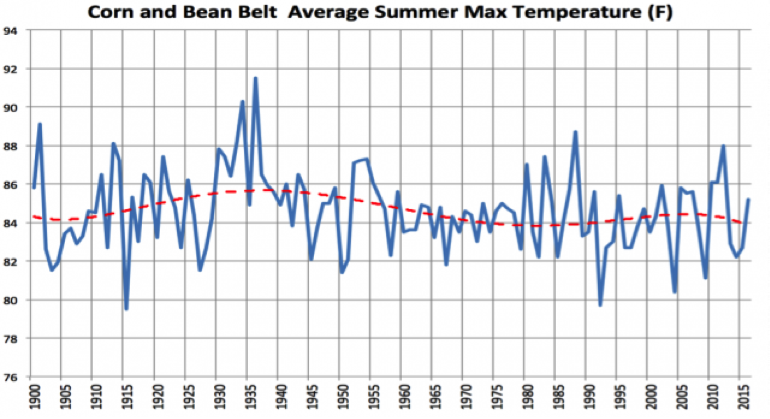
The U.S. growing areas (Primary Corn and Bean Belt) summer average maximum temperatures are cyclical and declining (NCEI CAAG).
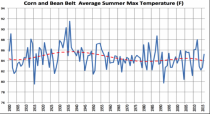
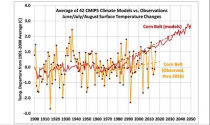
Dr. Roy Spencer showed how the summer Corn Belt temperatures have diverged from climate model forecasts.
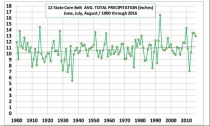
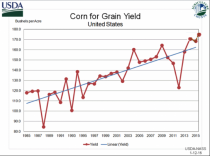
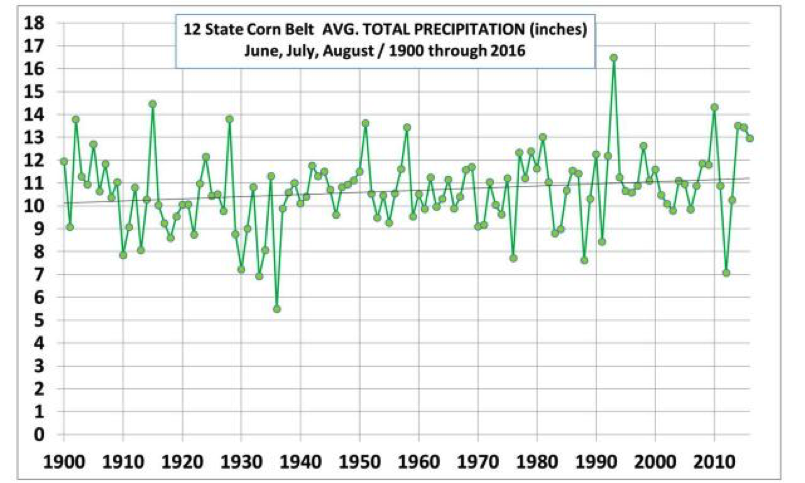
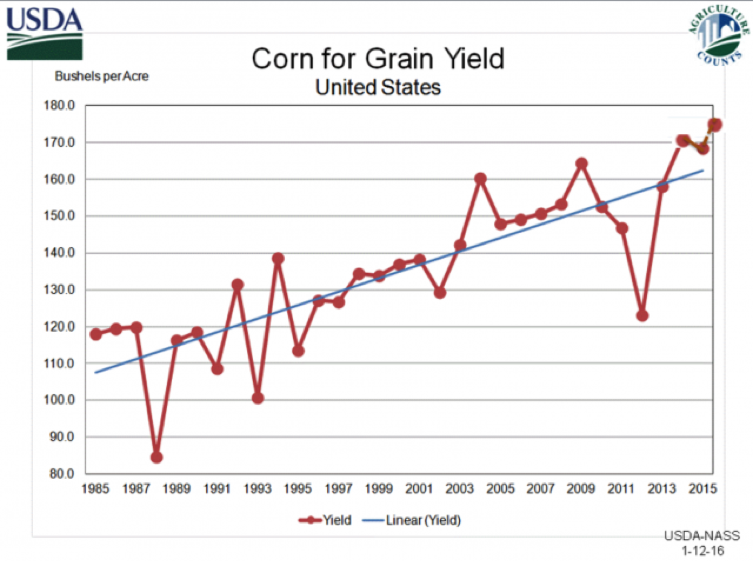
Precipitation has increased slightly and with better farm practices and hybrids and increasing amounts of the plant fertilizer CO2, lead to record crop yields. Even in droughty summers like 2012, yields were 50% higher than a similar drought in 1988.
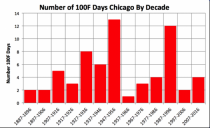
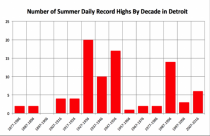
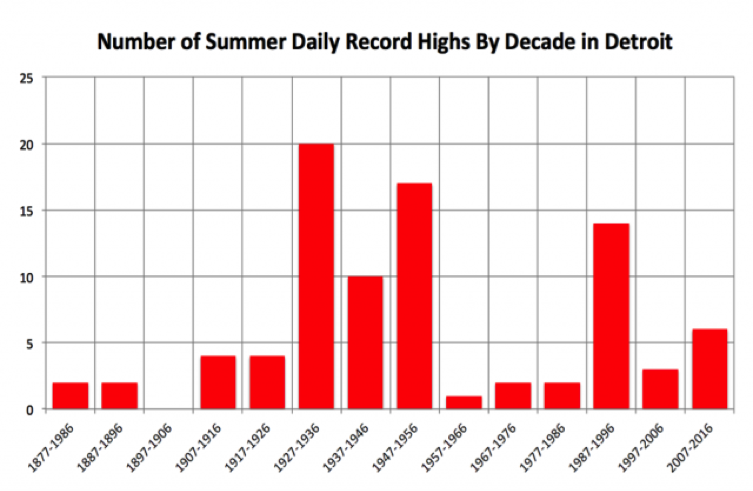
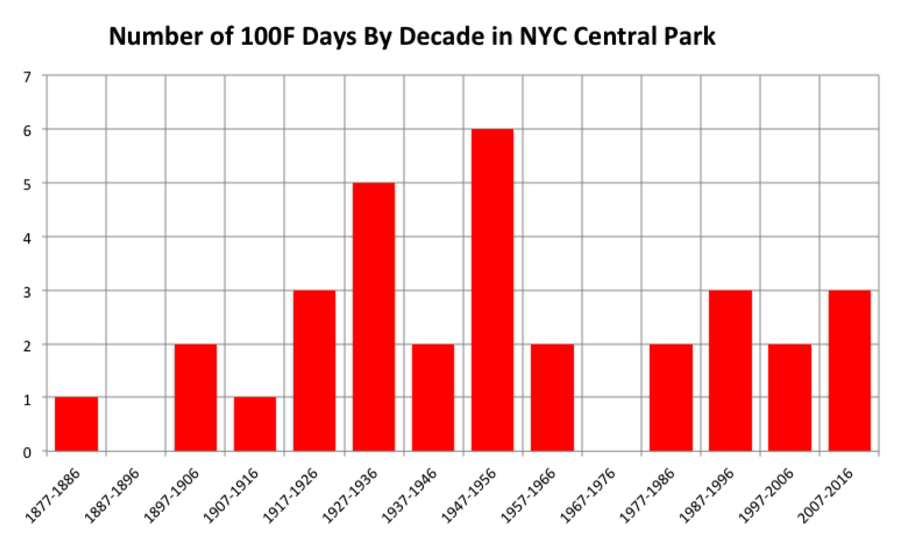
Graphs of the number of 100F days by decade for Chicago, Detroit and New York City also show a multidecadal mostly declining decadal trend.
Enlarged
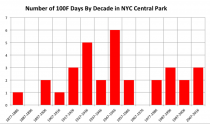
Enlarged
---------
See more from Tony Heller on Cooling Summers on the Deplorable Science Blog here.
As Tony points out, the facts do not matter to the warmists and the media environmental ‘journalists’. It is all in the models or their imagination.
