

Joe Bastardi, Weatherbell.com
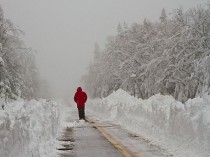
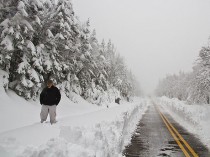
Icecap Update: Please see the winter summary by Icecap Meteorologist Art Horn as published on the Energy Tribune. By the way here are images from Whiteface Mountain on the Memorial Day weekend when a snowstorm hit the mountains of the northeast. An amazing 36 inches was reported at Whiteface and 12-16 inches at Jay Peak and Mt. Mansfield.
Also listen to Joe D’Aleo’s May 23rd radio interview with Mike Janocik on WLCR AM
At Weatherbell.com we try to show people the ‘why’ before the ‘what’. My father taught me that if you are right, then you should have the reason why first, and not excuses for being wrong later. From where I stand, the reasons why we are right are clear. But the barrage of excuses coming from the other side is growing shriller with each passing day. But the idea that people spouting the CO2 idea are being driven from the field in spite of the overwhelming evidence against them is nonsense. When facts don’t matter, it’s not the facts that will force them to quit. This is well beyond science.
Any rational person can see what is going on and can say that in the least there is enough doubt to stop the madness that demonizes those that disagree. In reality, their point has been driven from the field.
What I am doing here is giving you the ‘why’ before the ‘what’. What I’m amazed at is how people can keep seeing things that are opposite of what they claimed would happen 5 years ago, simply change the terminology, and then say the things they say. That kind of mentality is one that does not accept any answer except the one they think it should be. So the fight is not on a level of a normal argument. The arguing is with people who believe they possess the “truth” and that anything short of their “truth” cannot be tolerated.
But we must smile and fight with facts. Debunk, and try not to demean.
In any case the following link will be very helpful in trying to get my point across, and I am going to use mixing ratios to show some of this. See.
Here is why this should be simple. Energy can neither be created nor destroyed. So what is the source of energy to the Earth? Answer: the sun. If outgoing radiation equals incoming, then there is no trapping and all this hullabaloo is a moot point. Since that is the case, the game should be over.
However if you want to start confusing the issue, you assign major importance to very minor items, control the language, and then you can control the perception.
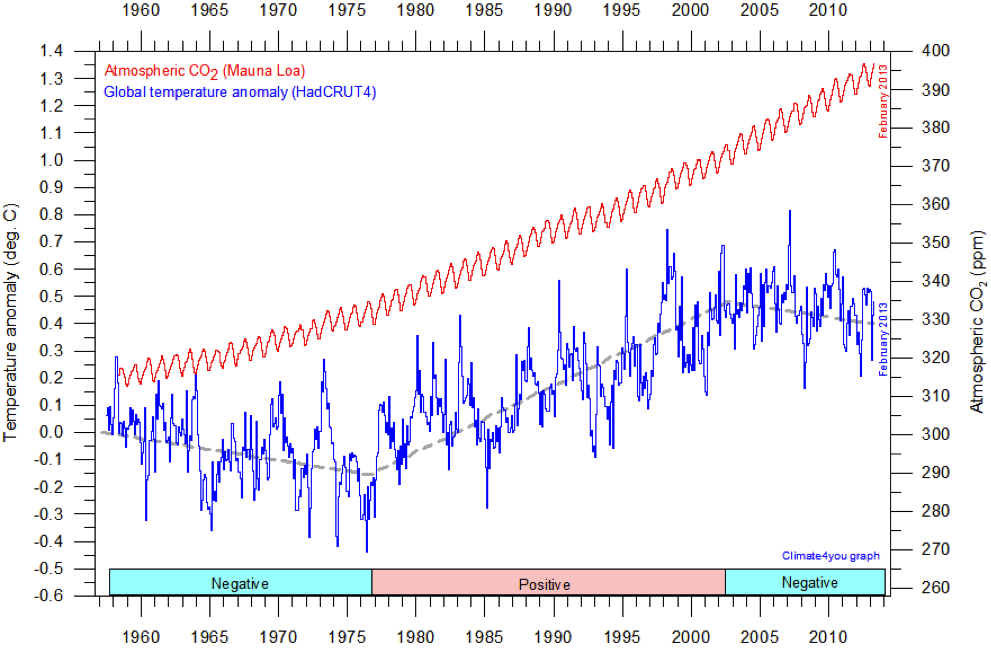
The fact is that the Earth has been warming since the very cold period of the 1700s (Little Ice Age). It just so happened sunspots were in the tank, and it was cold. When sunspot activity increased, the Earth responded by getting warmer. Should be simple, right? The link to the oceans in the overall rise that has occurred is obvious in the graph below (from the outstanding site: Climate4you.
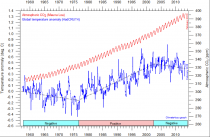
Figure 1: CO2 concentration and global temperature.Enlarged
The cumulative effect of the warm AMO and PDO added heat to the atmosphere, so temps rose from the late 1970s to around 2000. After the air absorbed the heat, it leveled off, the PDO flipped, and we started trending down.
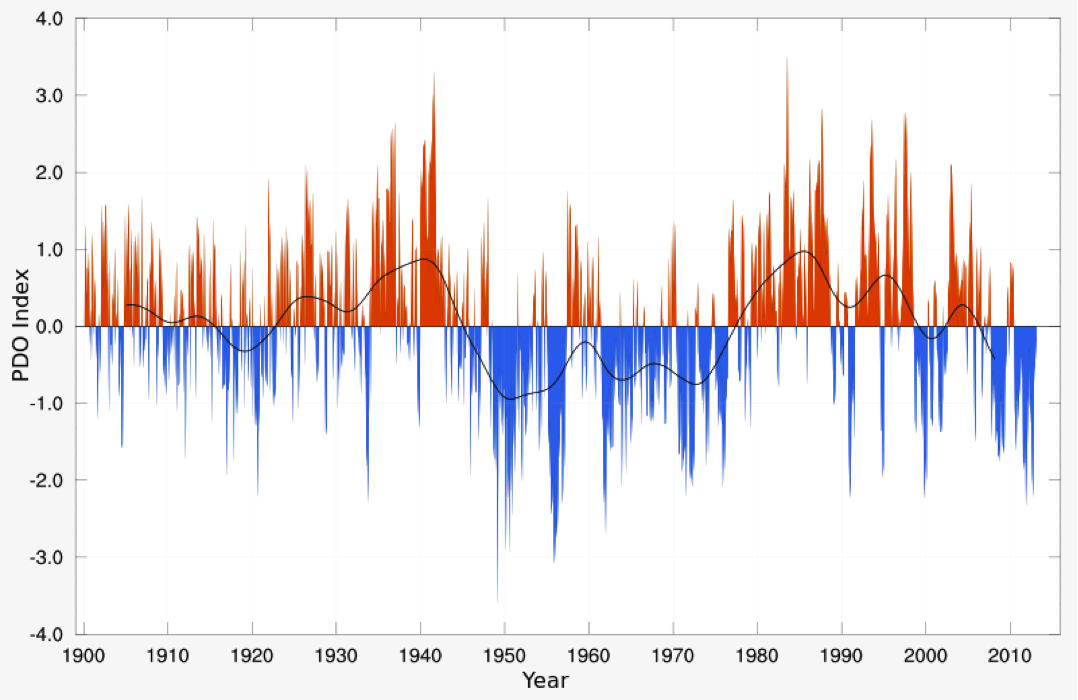
Simply using the PDO, as seen in the chart below from Wikipedia, shows an almost direct correlation:
The warm years from the late 1970s to a bit beyond 2000, the latest downturn can be seen as well. The Pacific is much larger than the Atlantic, but the Atlantic turned warm in the mid-1990s so it is still not fully onboard with the cooling. But when it does turn, chances are global temps will respond as one would expect knowing the heat capacity of the ocean is 1000 times that of the atmosphere. This chart alone should cast doubt, if not slay, the CO2 dragon being a major climate factor, if any at all. It’s simply too small to do what these people spouting this agenda-driven idea say it will.
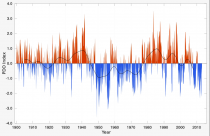
Figure 2: Pacific Decadal Oscillation (PDO). Enlarged
Again the overall rise of the past 200 years is easily explained by sunspots, which is why a lot of people are nervous about cooling. After all, if you are claiming the sun caused the warming, and you take it away, and the oceans flip to their negative phase, and a couple of volcanoes blow to boot, then there is real trouble. Hence the triple crown of cooling, which I showed on national TV 4 years ago when explaining why the cooling would commence, and by 2030 temperatures would return to levels seen in the late 1970s.
As for CO2, the rise may be due in part to a lag that FOLLOWS warming, and doesn’t cause it. Since the 1950s, the only time CO2 was correlated was when the oceans warmed. This is not brain surgery.
There is science and pseudo-science. Science comes up with an idea like the oceans are causing warming, and when they cool, the air cools. Pseudo-science says: well CO2 is adding to this, but how much? IT’S A QUESTION THAT CAN NEVER BE ANSWERED. Does the question then become: Would we already be heading into a mini ice age were it not for CO2 saving us? How do you answer that? Untold amounts of money are being thrown at a question that isn’t even something of consideration.
Now here is the problem. Temps have been dropping as you can see...not a lot, but some. But what should be very disturbing for planners and people looking forward is that the Relative Humidity is dropping. That means the wet bulb has dropped more than the temperatures. So far so good.
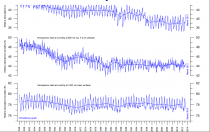
Figure 3: 300 mb (top); 600 mb (middle) 1000 mb (bottom). Enlarged” title="Enlarged">Enlarged
Why is the RH dropping? Think about it. A cooling Pacific, especially in the tropics, means less water vapor available to the system. So we get the initial temperature drop off because of the the cooling Pacific, primarily in the tropics, is no longer adding to the warmth of the air. But the RH is dropping too.
Where it’s dry, it does warm up and the large dry land areas do warm in the summer season, until such the entire earth/ocean system adjusts (the AMO flips to cold too). But the drop of RH, seen above in the chart is a big hint!
Notice how at this time, the 1000 mb is lagging. Eventually, though, the transport of moisture from the lagging low levels will cool the mid levels (increased moisture leading to temperatures falling toward the wet bulb), leading to more instability and more cloudiness. Until a balance is reached, the earths temps will cool. Perhaps faster.
A look at the skew T and the mixing ratio relationship to temperature really makes my point about why this is a distortion of temps and not warming. By distortion I mean its obviously warmer in the northern areas, but THE COOLING IN THE TROPICAL AREAS, EVEN THOUGH MUCH SMALLER, CARRIES FAR GREATER WEIGHT TO THE WEATHER AND CLIMATE .
A way to think about it like 2 people that weigh the same, but one may have more mass in one part of the body than the other.
An example of this can be seen when one looks at what it takes to change the mixing ratio 2g/kg at 30c, vs -20C.
Look at how the mixing ratios increase dramatically with higher temps. In other words, suppose we lower the temps 1C at 30C (from Wikipedia chart).
Doing so, we would change the mixing ratio by about 2g/kg. Now how much of a rise at -20C would we need to offset that? At -20C the mixing ratio is about 0.7 g/kg. To move up 2g to 2.7 g/kg, we would have to raise the temp about 15C.
The changes in temperatures in the tropics have a much greater overall impact on the climate than those in the arctic. It is, if you will, easy to warm cold, dry air, but to cool warm tropical air is harder. So if the earth’s temp is about steady, or falling off a bit as we saw in the graph above, and the arctic is still warm, the compensating drop in the tropics means more to the earths climate than the same movement of temps in the arctic It becomes a predictor of what has to happen as the PDO continues cold and the AMO turns cold.. the warmer northern polar regions will cool. A degree is not a degree when it comes to the climate system. A one degree movement up and down where wet bulb temperatures are 80 have far greater effects on the system than a 1 degree change where its near 0. That is the message behind the mixing ratio example above.
Now let me ask you this question, in terms of the climate system, which is far more important: the tropical oceans and the air masses around them, or what is going on in the Arctic?
Again this is simply saying there is a natural large-scale thermostat called the ocean. The warmer the ocean, the more it drives the whole climate system.
The slight cooling while RH is dropping is a sign of bigger things to come. This means the wet bulbs are falling faster than the actual temps. It is a predictor of future temperature falls (it’s worse than we thought). For usually when the RH falls, the temperatures rise. In this case, temps are already falling with the RH falling too!
At the very least I expect temperatures by 2030 to return to where they were in the late 1970s, which was the end of the last cold PDO phase and, by the way, the start of the satellite era: the most objective form of measurements.
Is the cooling worse than I thought? We are going to find out in the coming decades.