By Joseph D’Aleo, Weatherbell Analytics
We are already hearing that Sandy and any forthcoming wild winter weather relates to the post 1979 record arctic ice melt which alarmists incorrectly attribute to greenhouse gases. However, the fluctuations of arctic ice are the result of the same patterns (multidecadal in nature) that cause storms like Irene and Sandy and wild winters. Sandy broke the storm tide record for the Battery in NYC with a 13.88 foot AMLW level. The previous record was 11.2 feet set in the great hurricane of 1821 in the Dalton solar minimum. That storm was stronger than Sandy (1821 was a CAT3) but the surge came at low tide and with Sandy right at high tide, enhanced by a full moon. Also global see levels were a foot lower then. This was a comparable event. Of course back then there were no tunnels and subways, buses and cars, 100,000’s of people versus the 8 million today. So the event is not unprecedented as brainless bloggers, politicians and environMENTAL opportunists suggest.
Bill Clinton used “It’s the economy stupid” to help get elected in 2000.
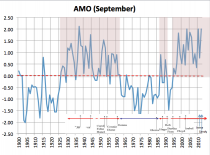
My response to those in the met community and the left leaning trolls in the media that wants to put the blame for Irene and Sandy and any cold winters we have been getting on the melting of the arctic ice in summer due to greenhouse gases is: “It’s the AMO stupid”.
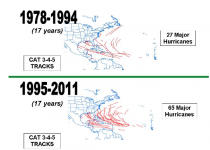
The AMO which goes through a 60-70 cycle favors more frequent hurricanes and more landfalls. We saw that in the period from the 1920s to around 1960 and again after 1995. In the first warm period mid century we had 11 major east coast hurricanes. We have had at least 8 since the AMO has warmed again in 1995. The last two years, the northeast got the brunt with irene and Sandy.
This is especially noticeable with major (CAT3+) hurricanes as JB and Ryan and my friend Dr. Bill Gray has shown.
And for the arctic ice the University of Alaska Fairbanks has shown the Atlantic is the key to the extent of the ice in the arctic.
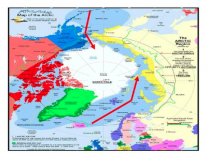
Atlantic water flows under the ice in the current sin the Kara and Barents sea (as does Pacific through the Bering Straits). When the AMO is -, the water is colder than normal and less melting occurs when the AMO is +.
The dips in arctic ice in 2007 and 2012 followed spikes in the AMO. The NSIDC which in 20007 was still a team of mainly objective scientists told it like it really is when they wrote:
“One prominent researcher, Igor Polyakov at the University of Fairbanks, Alaska, points out that pulses of unusually warm water have been entering the Arctic Ocean from the Atlantic, which several years later are seen in the ocean north of Siberia. These pulses of water are helping to heat the upper Arctic Ocean, contributing to summer ice melt and helping to reduce winter ice growth.Another scientist, Koji Shimada of the Japan Agency for Marine-Earth Science and Technology, reports evidence of changes in ocean circulation in the Pacific side of the Arctic Ocean. Through a complex interaction with declining sea ice, warm water entering the Arctic Ocean through Bering Strait in summer is being shunted from the Alaskan coast into the Arctic Ocean, where it fosters further ice loss. Many questions still remain to be answered, but these changes in ocean circulation may be important keys for understanding the observed loss of Arctic sea ice.”
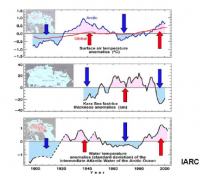
The International Arctic Research Center at the University of Alaska, Fairbanks showed how arctic temperatures have cycled with intrusions of Atlantic water - cold and warm.
Enlarged
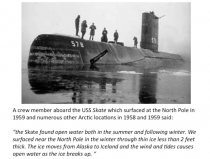
A similar and perhaps even more impressive melt occurred in the last +AMO phase whn the US Submarine Skate surfaced at the North pole in the summer AND winter.
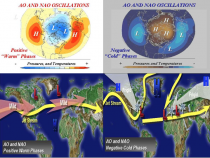
In 2007, NASA scientists reported that after years of research, their team had assembled data showing that normal, decade-long changes in Arctic Ocean currents driven by a circulation known as the Arctic Oscillation was largely responsible for the major Arctic climate shifts. These periodic reversals in the ocean currents move warmer and cooler water around to new places, greatly affecting the climate. The AO was at a record low level 2009-2010 explaining the record cold and snow in middle latitudes. A strongly negative AO pushes the coldest air well south while temperatures in the Polar Regions are warmer than normal under blocking high pressure.
Enlarged
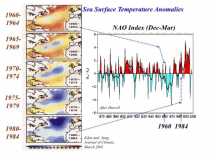
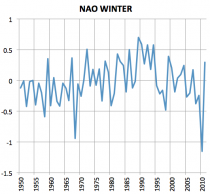
See how the warm tripole led to negative North Atlantic Oscillation (NAO), a component if the AO in the 1960s) and the cold a positive in the 1980s.
The NAO has declined after the AMO went positive in 1995 in winter.
Enlarged
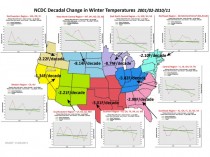
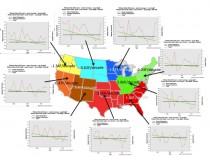
After the 2010/11 winter, the decadal trend numbers were astounding as to the degree of winter cooling in the US - ALL REGIONS. In December 2010, the UK had its second coldest December. in the entire record since 1659 in the LITTLE ICE AGE. The lower 48 was left out last winter though records for cold and snow were set in Alaska and parts of Eurasia.
Enlarged
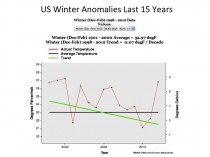
Even with the warming rebound winter in the lower 48, the 15 year trend continues down at 2.07F/decade.
And that is true again for all regions.
Enlarged
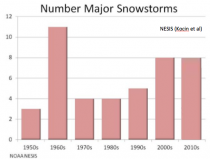
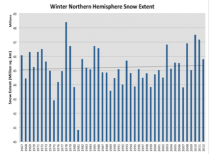
Winters have been snowier too in the US and the hemisphere.
RANKINGS
#1 1977/78
#2 2009/10
#3 2010/11
#4 2007/08
#5 2002/03
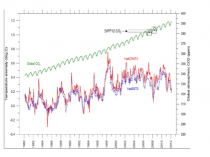
So more landfalling storms in the Atlantic Basin and low arctic ice and cold winters are the result of a warm multidecadal cycle in the Atlantic not CO2. Its natural and cyclical. The world and our climate did not begin in 1979 when we could first watch from the sky in detail the arctic ice.
Enlarged
The stasis in global annual mean temperatures is due to a cold Pacific and a sun entering a slumber. They are fighting the last holdout, the warm AMO.
When the AMO goes cold in 5 years or so and cycle 24 gives way to dud cycle 25, Katy bar the door.
SUMMARY
(1) Irene and Sandy were overdue landfalling storms in the northeast during the warm multidecadal Atlantic mode that started in 1995. This is similar to the active priod from 1938-1960 when 11 landfalling impactful hurricanes occurred in the east (8 so far since 1995).
(2) The arctic ice responds to the same multidecadal Atlantic cycle and the Pacifical Decadal Oscillation. Ice in the 1950s was probably even lower than present as US submarines surface at the pole in winter and summer
(3) The warm AMO favore ths negative state of the NAO and AO which translates into colder and often snowier winters in the US and Eurasia.
(4) Its the AMO stupid.


