

By Matt Vooro
Icecap Note: In numerous stories here on Icecap, we have dicussed the importance of the PDO and AMO in decadal scale climate changes. We have noted how the recent warm PDO and AMO led to the warming attributed by the opportunists at the UN, in the universities and professional societies to anthropogenic greenhouse fording. in this excellent summary submitted to a newspaper by Matt Vooro of Scotland, we see clear evidence for the PDO and AMO’s role in climate in the US, Canada and globally. It was in response to the article by Vicky Pope of the UKMO entitled “SCIENTISTS MUST REIN IN MISLEADING CLIMATE CLAIMS”.
I totally agree that scientists should refrain from making misleading climate change claims. I think the whole issue that climate change is primarily caused by manmade greenhouse gases is misleading . Natural earth/ocean climate cycles like PDO and AMO are not even talked about by these same alarmists. IPCC climate models are strangely silent on them too. Now I wonder why? How can one trust any climate models that omit the key climate drivers.
The Pacific and Atlantic Ocean temperature oscillations as measured by the PDO and AMO indices are prime drivers of our climate. The droughts, hot spells, rainy weather and cold spell all have their origins in the temperature oscillations of these ocean climate makers that have existed for thousand of years and explain the natural variability of the global climate. The paper here well illustrates this point.
With the PDO now negative[since 2007] and AMO still positive, we are today where we were about 1945 -1950[ PDO went negative then in 1944] and heading for possible 30 years of cooler weather. Yes, there will be some warm years too, but the overall trend of the period will be cool. Yet why are the climatologists all over the world predicting unprecedented global warming, while the weather is actually cooling and has done so for many years now. Here are just a few examples of how PDO and AMO affect our climate. At least 52% of all the droughts in the US are attributable to PDO and AMO effects and not to global warming at all.
UNITED STATES
PDO and AMO both positive [like 1925-1945] and [1995 -2007]
Record warm and rising temperatures and droughts in the northern and central high plains US, California, and Southeast. The very hot spell and dust bowl of the 1930s. Also explains the so called rapid global warming period of 1976-2007 [not caused by CO2 at all].
PDO negative, AMO positive [like 1945-1965] and [near term future for us now]
Cold temperatures in the northwest, Canada. Droughts in southwest. Pattern is like the 1950 drought with major issues in the Midwest, southwest, California, Rocky Mountain area. A repeat of this period may have already started in 2007
PDO and AMO both negative [like 1965 -1975] and again [1915-1925]
Record Cold temperatures. Lot of snow and precipitation.Very few droughts, restricted to central plains. This could be the pattern in a few years and the latter part of the next 30 years.
PDO positive, AMO negative [like 1895-1925 and again [1975-1995]
Warming. Restricted drought to Pacific NW and Northeast
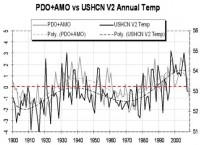
Icecap Note: this is the PDO+AMO versus US annual temperature graph. See a larger image here.
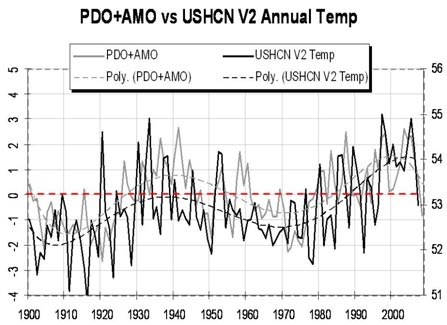
Here is how AMO and PDO seem to affect the rest of the world:
CANADA
AMO seems to affect the east coast more. Ten of the coldest temperatures for the Atlantic Canada between 1948 -2008 happened when the AMO was negative. PDO affects the rest of CANADA more but especially the west coast. Nine of the 10 coldest years between 1948-2008 happened when PDO was negative [like now]. The average for all of Canada is 8 of the coldest 10 years between 1948 and 2008 were when the PDO was negative and 8 of the warmest were when the PDO was positive. So the PDO is one of the main weather makers for Canada as a whole except for perhaps Quebec and the Maritimes.
GLOBAL
Global record temperatures were set during 2005 and the 1997/1998 periods when both the AMO and PDO were positive and at record levels: In 2005, PDO peaked at 1.86 AMO peaked at 0.503 [13th highest] and in 1997/1998, the PDO peaked at 2.82 and AMO was 0.562 [6th highest ever]. The 2003 hot spell in Europe which was perhaps wrongly blamed on CO2 global warming can now be explained by one of the top dozen positive AMOs at 0.504. See this paper. Here is what the authors of the paper concluded:
Overall, our results provide strong evidence that during the 20th century the AMO had an important role in modulating boreal summer climate on multidecadal time scales. We have focused here on time mean anomalies, but some of the most important impacts are likely to be associated with changes in the frequency of extreme events. There is evidence that the frequency of U.S. droughts and the frequency of European heat waves are both sensitive to Atlantic SSTs.
The so called unprecedented global warming from 1976 -2007 can be explained by the extra warming resulting from the simultaneous occurrence of positive PDO and positive AMO during the last 30 year period especially 1995 -2007. A similar period occurred during about 1915-1945 and especially 1925 -1944 when almost an identical warming took place. CO2 seems to have very little to do with these naturally occurring climate cycles as they were happening well before manmade CO2 began to rise.
Yet strangely PDO and AMO are not even covered in the IPCC climate models. Now I wonder why? Could it explain why their predictions to date are so far off and so soon after only 1-2 years after the release of their last report? See Matt’s PDF here.