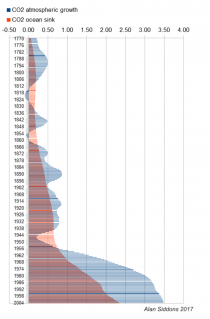
The chart below is taken directly from figures provided by the U.S. government’s Carbon Dioxide Information Analysis Center (CDIAC) website, specifically its 2016 Global Carbon Project spreadsheet on the Historical Budget tab. In terms of gigatons of carbon, and from 1770 to 2004, it itemizes the growth rate of radiative forcing by atmospheric CO2 and the growth rate of oceanic absorption, what is known as a “carbon sink.”
As anyone can see, and as was pointed out by Joe D’Aleo and myself ten years ago in Carbon Dioxide: The Houdini of Gases, as CO2 emissions increase, so too does the absorption of these emissions by carbon sinks. An odd state of affairs.
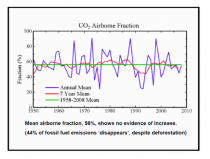
“Contrary to what you read in the newspaper, the sinks of CO2 are not decreasing. On the contrary they are increasing as fast as the CO2 emissions have increased. The fraction of CO2 emissions that disappears annually continues to average 44%.” - James Hansen et al
This may have been true as an average over a span of time, but it is not true in detail. CDIAC’s 2004 figures indicate 2.334 for oceanic absorption, 3.476 for atmosphere. That’s 67% of “disappearing CO2.”
Is something very wrong with the currently accepted paradigm of atmospheric CO2?
This is a supplement to the On the Validity of NOAA, NASA and Hadley CRU Global Average Surface Temperature Data & The Validity of EPA’s CO2 Endangerment Finding Abridged Research Report of June 2017 New Research Report. This post contains some of the same charts and some new ones.
Meanwhile, the NRDC comes out with another report that will fail like all their prior scares. They claim that heat deaths will explode unless we redistribute our wealth as prescribed by the Paris Accord. Heat extremes have been forecast for decades to be increasing and if listen to the media, you would believe it has. CEI takes them to task for their alarmist hype here.
----------
Here is my take on it.
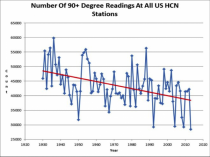
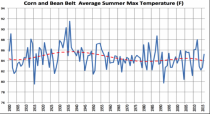
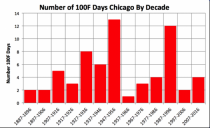
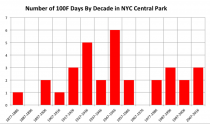
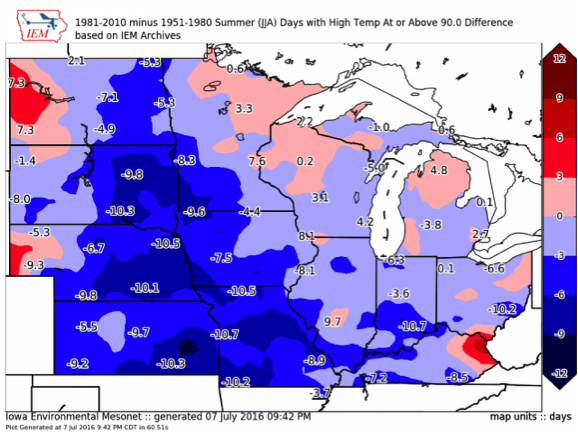
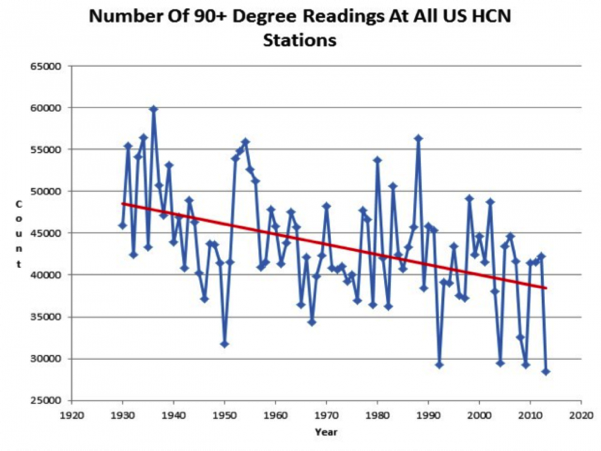
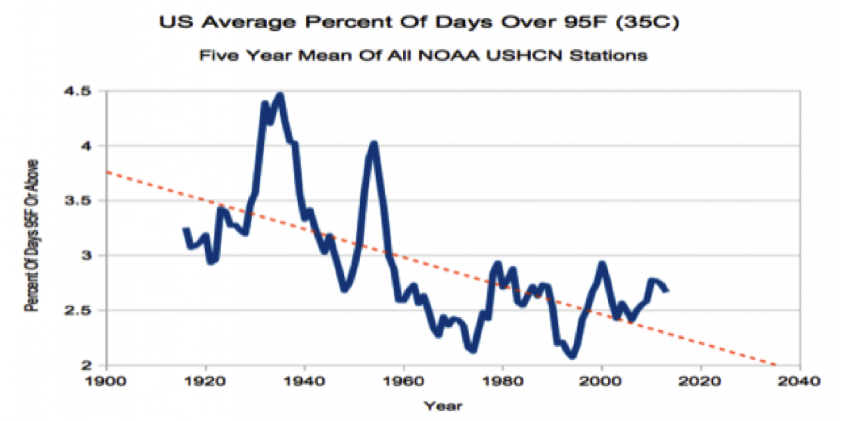
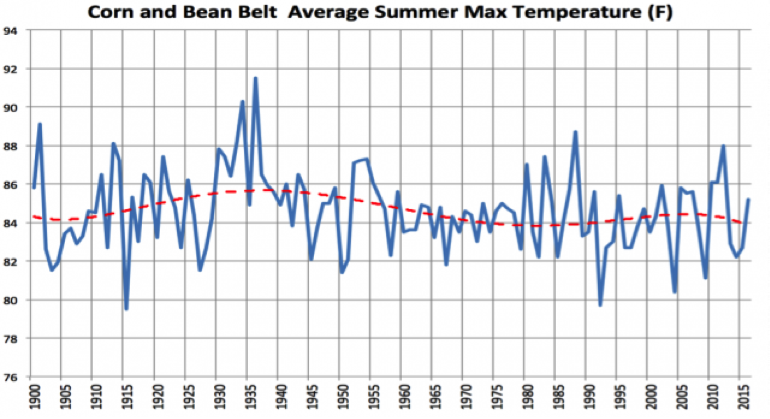
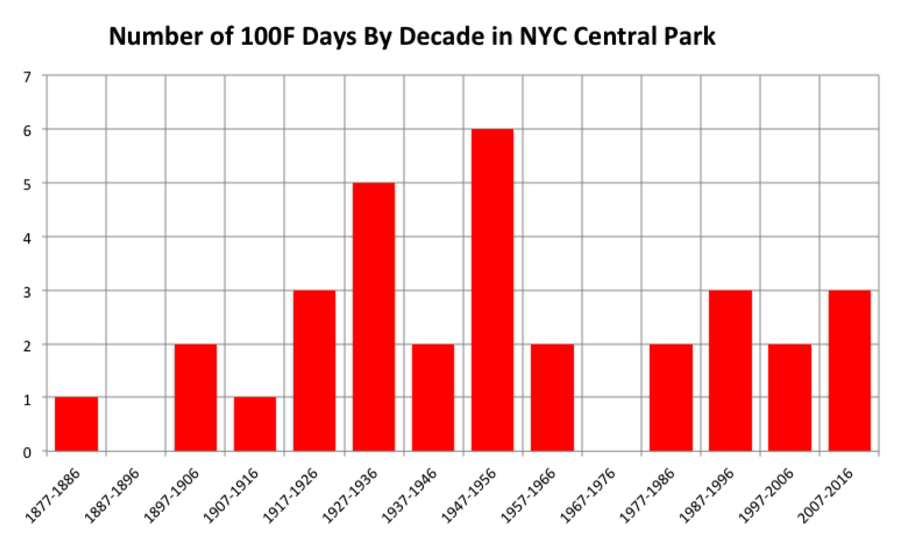
The fact is heat has been declining for decades using real data.
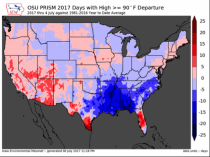
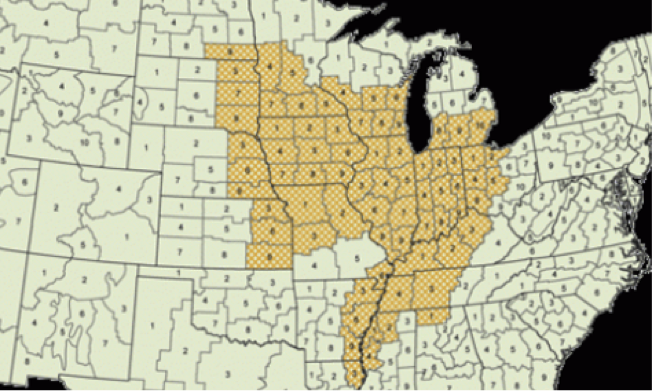
Iowa State University Mesonet posted this chart showing that for many areas through July 4th, the number of 90F+ days relative to the 1981-2016 to date average is below normal (so far) in 2017 in many areas, especially the southeast.
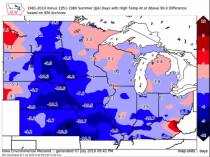
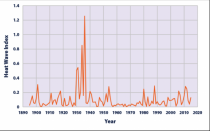
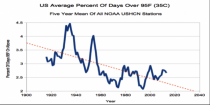
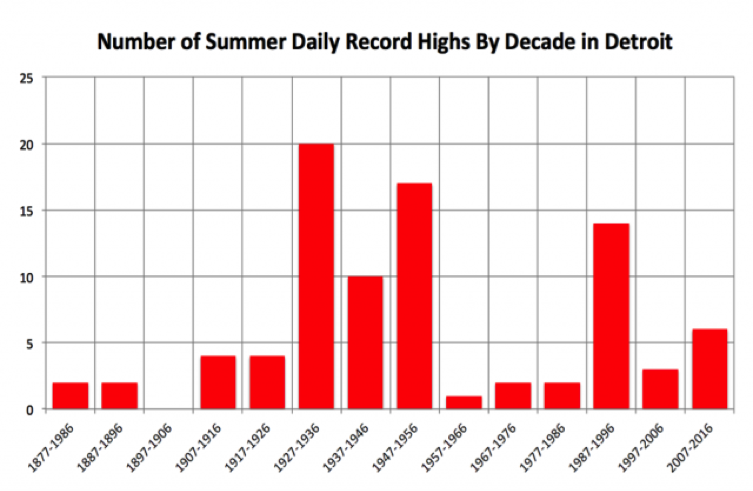
Which reflects the EPA Heat Wave Index annual plots since 1895 (Kunkel) and the number of decadal all time state records (Christy).
EPA Depiction of Heat Wave Index (Kunkel) Since 1890
Enlarged
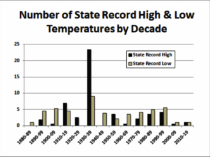
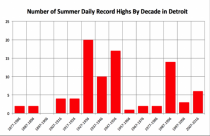
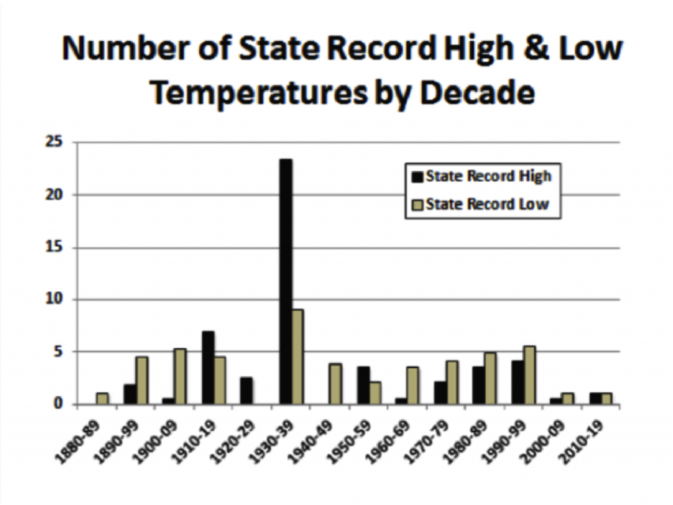
This agrees with the plot of all-time state record high (and low) temperatures (Christy). The 1930s had 23 of the 50 state all time heat records and there were 38 before 1960 with more record lows than highs since the 1940s.
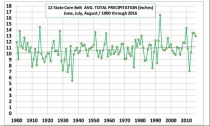
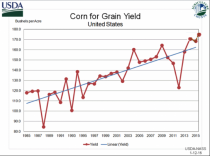
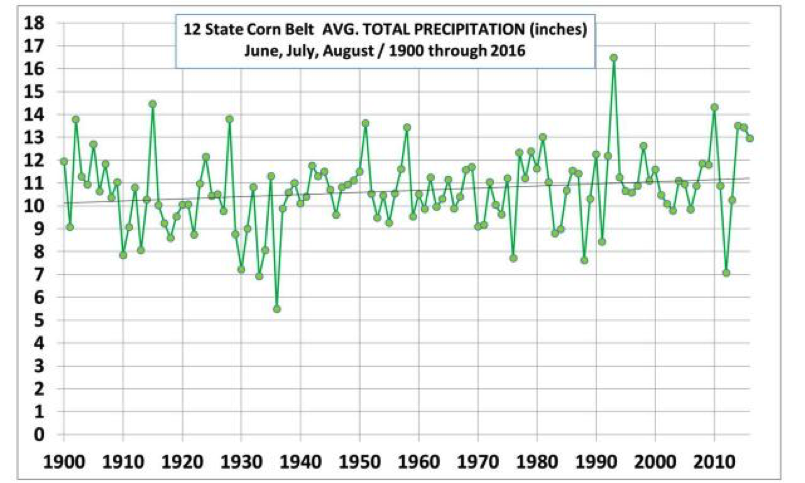
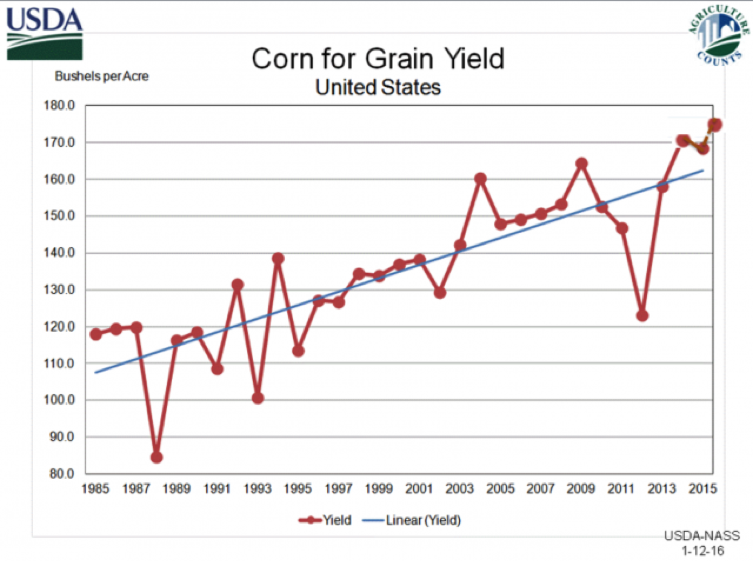
Precipitation has increased slightly and with better farm practices and hybrids and increasing amounts of the plant fertilizer CO2, lead to record crop yields. Even in droughty summers like 2012, yields were 50% higher than a similar drought in 1988.
I have been a part of a team of scientists, econometricians and lawyers who have been working pro-bono in the last decade to fight against harmful, unnecessary regulations based on bad science. A second in the latest research report (first full abridged version (here) was described here) is coming out next week.
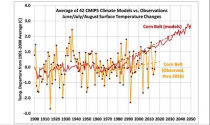
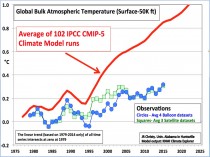
The pause in global warming has reached 20 years. The responses the last decade have been to try and adjust the data the better fit the models. This goes against the scientific method.
But with persistence from the skeptics and a whistleblower at NCDC calling Tom Karl on the data manipulation, alarmists appear now to be taking a different tack. In the last few weeks, papers from some of the warmists are agreeing their models are failing due to natural variability - many of the same findings we have reported on Icecap in recent years and in the chapters I did for Elsevier’s Evidence Based Climate Change and lately in the research report. One by some of the top alarmists (here) says:
Here we show that state-of-the-art global models used to predict climate fail to adequately reproduce such multidecadal climate variations. In particular, the models underestimate the magnitude of variability in the twentieth century.
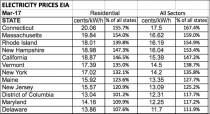
I have also worked with Peter Lanzillo and the team at Hudson Cable to with other participants do a series on the climate issues. Part 1 was on CO2, the Demon Gas (showing CO2 is a trace, highly beneficial gas). Part 2 was on Taking the Earth’s Temperature (looking at all the serious issues attempting to estimate global temperatures and showing how the data has been adjusted always in a way to cause more apparent warming and better agreement with the climate models). In part 3, we were joined by another analyst to look at Extreme Weather (showing how all the predicted increases in the severity and frequency of severe weather has failed to materialize). In part 4, we looked at the natural and other man-made factors that do explain what the greenhouse gas theory can’t. Part 5, I was again joined by another analyst and we looked at the folly of a race to renewables (with a lot of attention to wind), strong regulations and taxes that have hurt our economy, small business and caused electricity prices to skyrocket.
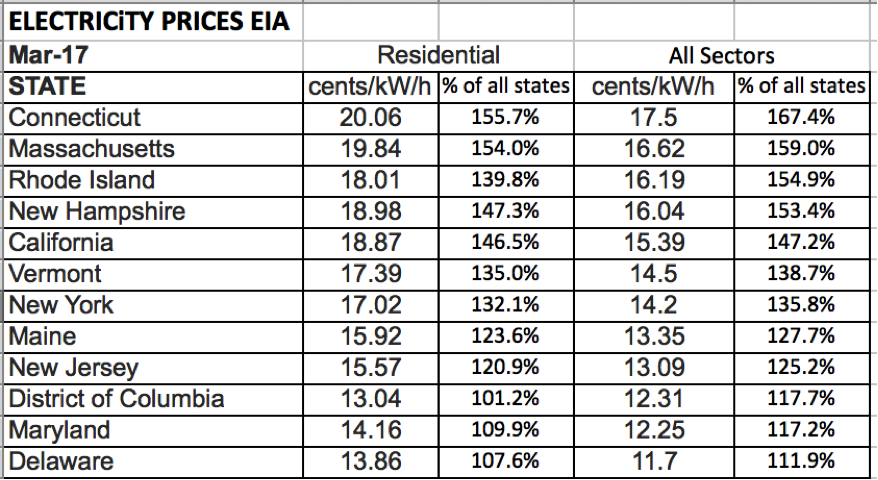
Enlarged. Highest electricity cost states (March 2017 shown). The Regional Greenhouse Gas Initiative (RGGI) states and California top the list of the lower 48 states.
RGGI states in Green.
We just finished part 6 on CO2 and sea level with Tom Wysmuller and part 7 on the Scientific Method abuses and the role of the media and our education system in indoctrinating young people and helping influence public opinion with Dr. Larry Gould.
Here was Show 4:
All of the research reports and the 7 hours of video have been done pro bono. If you DONATE to ICECAP we will send you links to all our shows. If you would like to discuss getting the series on you local cable access channels contact Peter Lanzillo here.
Why do we go to all this trouble. The answer is that the regulations, green agenda and the Paris Accord will cause great pain with no benefit - especially for those that can afford it the least.
The United Nation’s former global warming czar has published a paper claiming humanity only has three years left to avert dangerous global warming and meet the goals of the Paris climate accord.
To do that, Christiana Figueres says governments and businesses need to pony up $1.3 trillion a year by 2020 earmarked for “climate action” to decarbonize the global economy. That’s on top of boosting green energy and phasing out fossil fuels, mostly coal.
“[S]hould emissions continue to rise beyond 2020, or even remain level, the temperature goals set in Paris become almost unattainable, Figueres, the former head of the United Nations Framework Convention on Climate Change, wrote in an article published in Nature. “The UN Sustainable Development Goals that were agreed in 2015 would also be at grave risk.”
“These goals may be idealistic at best, unrealistic at worst. However, we are in the age of exponential transformation and think that such a focus will unleash ingenuity,” Figueres wrote in her article, which was co-authored by a few environmentalists and scientists.
The Paris accord aims to “significantly reduce the risks and impacts of climate change” by keeping global warming “well below” two degrees Celsius by 2100. Beyond that, many activist scientists say global warming poses a danger to humanity.
World leaders are set to meet at the G20 summit in July, and Figueres wants them to “highlight the importance of the 2020 climate turning point for greenhouse-gas emissions’’ by imposing more policies to reduce greenhouse gas emissions and putting up more money for climate programs.
Figueres isn’t the first to propose a costly plan to limit future global warming. A group associated with former Vice President Al Gore issued a report in April calling for $15 trillion to be spent on green energy and other programs to limit global warming.
The Gore-affiliated Energy Transitions Commission’s (ETC) called for “investment in renewables and other low-carbon technologies some $6 trillion higher ($300 billion per year); while the largest required increases - of almost $9 trillion ($450 billion per year) - will be in more efficient energy saving equipment and buildings.”
A recent Bloomberg New Energy Finance report estimated $12.7 trillion was needed to keep projected global warming below 2 degrees Celsius by the end of the century.
The report estimated $7.4 trillion will be invested in new green energy capacity by 2040, adding a “further $5.3 trillion investment in 3.9 [terawatts] of zero-carbon capacity would be consistent with keeping the planet on a 2-degrees-C trajectory.”
Figueres calls for about $1.3 trillion a year to fight global warming by 2020. So the actual cost of her plan is likely on par or higher than those suggested outlined by the Gore group and Bloomberg.
“[P]lans to fully decarbonize buildings and infrastructures by 2050, with funding of $300 billion annually,” she wrote, adding the “financial sector has rethought how it deploys capital and is mobilizing at least $1 trillion a year for climate action.”
That includes issuing “green bonds” to finance climate programs.
The world would need to get 30 percent of its electricity from green sources, electric vehicles would need to be 15 percent of the global vehicle fleet and reduce deforestation, wrote Figueres and company.
Even when environmentalists admit wind power is more expensive than conventional fuel sources - and they often lie and claim it isn’t - wind advocates argue its environmental benefits are worth the added costs.
A recent column by noted British science writer Matt Ridley in The Spectator puts lie to this myth. To the extent one supplants electricity generated by fossil fuels with wind-generated electricity, it does relatively little to protect the environment.
For all the bragging the wind industry does about the growth of wind power worldwide - and to be fair, due to huge subsidies, it has been growing at an impressive pace for a decade now - it still doesn’t amount to much as a share of power overall.
According to the International Energy Agency’s (IEA) 2016 Key Renewables Trends, wind provided 0.46 percent of global energy consumption in 2014. This is total energy, not just electricity, which is less than one-fifth of all energy used. Even limiting the question to electricity, all renewable-energy sources combined provided approximately 22 percent of electric power worldwide in 2012, a share the Energy Information Agency expects to grow to about 30 percent by 2040.
The problem for wind proponents is despite all the subsidies and mandates and the use of its punier but even more expensive cousin, solar power, wind and solar together only make up less than 5 percent of all global electric-power use, an amount EIA estimates will grow to 14 percent by 2040. Since electric power is just 20 percent of total energy use, even in 2040, electric and solar power will provide a mere fraction of the world’s total energy supply. Hydropower and old fashioned biomass - which, for most of us, means burning wood for heat and cooking - dominate the renewable energy supply.
The land, wildlife, and climate impacts of this push for wind are horrendous. Ridley points out IEA estimates world energy demand has been growing at about 2 percent each year for nearly 40 years, an amount of annual growth that is expected to continue for decades to come.
If wind turbines were to supply just the expected growth in energy demand for the next 50 years, wind turbines would need to cover an amount of land equal to Russia, the largest country on Earth, in terms of land mass - and that’s just to meet new demand not displace the huge amounts of fossil fuels we currently use.
But even that doesn’t tell the whole story. Because wind turbines must be placed where the wind blows fairly constantly and without obstruction, wind farms often gobble up particularly scenic land areas, such as the tops of mountains and other remote areas. These places are typically hundreds of miles from the growing urban areas that need the power, necessitating the construction of tens of thousands of miles of new power lines to transport the electricity from where the turbines are spinning to where the power is needed. Power lines, of course, also take up land.
Other power plants, by comparison, can be constructed next to existing power-line corridors or near the areas where the power is needed. In addition, because electric power is lost during transmission over great distances, not all the power generated by turbines reaches its intended destination, which means more turbines and land is needed to meet electric power growth.
To put this in perspective, two of the biggest wind farms in Europe have 159 turbines and cover thousands of acres, but together, they take a year to produce less than four days’ worth of output from a single 2,000 MW conventional power station that takes up 100 times fewer acres. A wind farm occupying 192,000 acres, approximately 300 square miles, would produce the same amount of energy as a single 1,000 MW nuclear plant that requires less than 1,700 acres, or 2.65 square miles.
Wind turbines have been rightly called the Cuisinarts of the air for their propensity to chew up thousands of migratory birds and bats every year. In the 1960s, Rachel Carson warned of a ‘silent spring,’ when children would no longer hear whistles of song birds because they had been killed by modern pesticides. Carson was wrong about the cause of death, but if wind farms are built around the world in the numbers demanded by climate alarmists, she could well be right about the results. Millions more birds and bats will be killed in the future by spinning turbines built in the corridors through which birds and bats migrate.
And what do we get for all this death and destruction? Certainly not cleaner air or lower carbon-dioxide emissions.
Wind farms generate power only when the wind is blowing within a certain range of speed. When there is too little wind, wind towers don’t generate power, but when the wind is too strong, they must be shut down for fear of being blown down. Even when they function properly, wind farms’ average output is less than 30 percent of their theoretical capacity, compared to 85 - 95 percent for combined-cycle gas-fired plants. Additionally, the power wind farms produce is highly variable, ramping up and down quickly alongside gusts and lulls. This is problematic because the power grid needs a regulated flow of power to function properly.
Because of these two endemic facts about wind power, wind farms require conventional power plants to supplement the power they do supply. By building a 1,000 MW wind farm, you are essentially also requiring the presence of a 700 MW natural-gas power plant.
It should also be noted the production of steel and concrete needed to build massive wind farms require energy-intensive processes, emitting greater amounts of carbon dioxide than most other industries. In fact, wind turbines require more steel and concrete per unit of energy produced than any other source of electricity.
As Ridley recounts for The Spectator, wind turbines need about 200 times more material per unit of power generated than a modern combined-cycle gas turbine. That means a single two-megawatt wind turbine uses 150 tons of coal. Building and installing the 350,000 wind turbines every year needed to keep up with increasing energy demand would require using 50 million additional tons of coal per year.
By any measure, governments’ big push for wind power delivers very little in terms of energy or environmental protection. Wind power advocates are blowhards, and it’s time for governments to stop listening to them.
H. Sterling Burnett, Ph.D. (hburnett@heartland.org) is a research fellow on energy and the environment at The Heartland Institute, a nonpartisan, nonprofit research center headquartered in Arlington Heights, Illinois.
----------
See this video, one segment of a multi-part series on climate theory, reality and the environmental and economic factors.


