Saul Alinsky died almost 50 years ago, but his writings influenced people on “The Left” with vast political control of our nation today. It has been advanced for decades in a subliminal way - COVID and the election of Biden and a radicalized democratic party has exposed the underground movement.
Hillary did her college thesis on Saul Alinsky’s writings and Obama has written about him in his books.
Alinsky’s rules for radicals:
How to create a social state by Saul Alinsky:
There are eight levels of control that must be obtained before you are able to create a social state. The first is the most important.
1. Healthcare - Control healthcare and you control the people.
2. Poverty - Increase the Poverty level as high as possible; poor people are easier to control and will not fight back if you are providing everything for them to live.
3. Debt - Increase the debt to an unsustainable level. That way you are able to increase taxes, and this will produce more poverty.
4. Gun Control - Remove the ability to defend themselves from the government. That way you are able to create a police state.
5. Welfare - Take control of every aspect of their lives (Food, Housing, and Income).
6. Education - Take control of what people read and listen to - take control of what children learn in school.
7. Religion - Remove the belief in God from the government and schools.
8. Class Warfare - Divide the people into the wealthy and the poor. This will cause more discontent, and it will be easier to tax the wealthy with the support of the poor.
You should see that all eight of his ‘rules for radicals’ are currently in play in the media and social media. The greenhouse climate change hoax is being used to control the energy sources, which is with transport issuea is causing 40 year level inflation, shutting down many small businesses who had been successful because of a great work ethic and sacrifices of their founders over their entire lives. The leftist plan would eventually impoverish a large segment of the population, allowing the government to take control of every aspect of our lives.
Alinsky merely simplified Vladimir Lenin’s original scheme for world conquest by communism, under Russian rule. Stalin described his converts as “Useful Idiots.”
Useful Idiots have destroyed every nation in which they have seized power and control. It is presently happening at an alarming rate in the U.S. “It is difficult to free fools from the chains they revere.”
The book Rules for Radicals is a very informative read. You can find it in many places online for free, or CLICK HERE for a copy. It’s a short read but an important one. BTW, Alinsky dedicated the book to Lucifer as the “original radical” in his fight against God, and he is Alinsky’s hero.
We need to share these tactics just as the CRT was exposed by home remote classes for our COVID restricted students. You need to challenge politicians and media that are pushing this radical agenda. If we don’t, we won’t very soon have the country which not many months ago we felt so fortunate to be a part of, the land of the free and the brave.
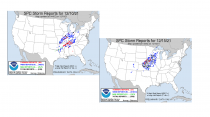
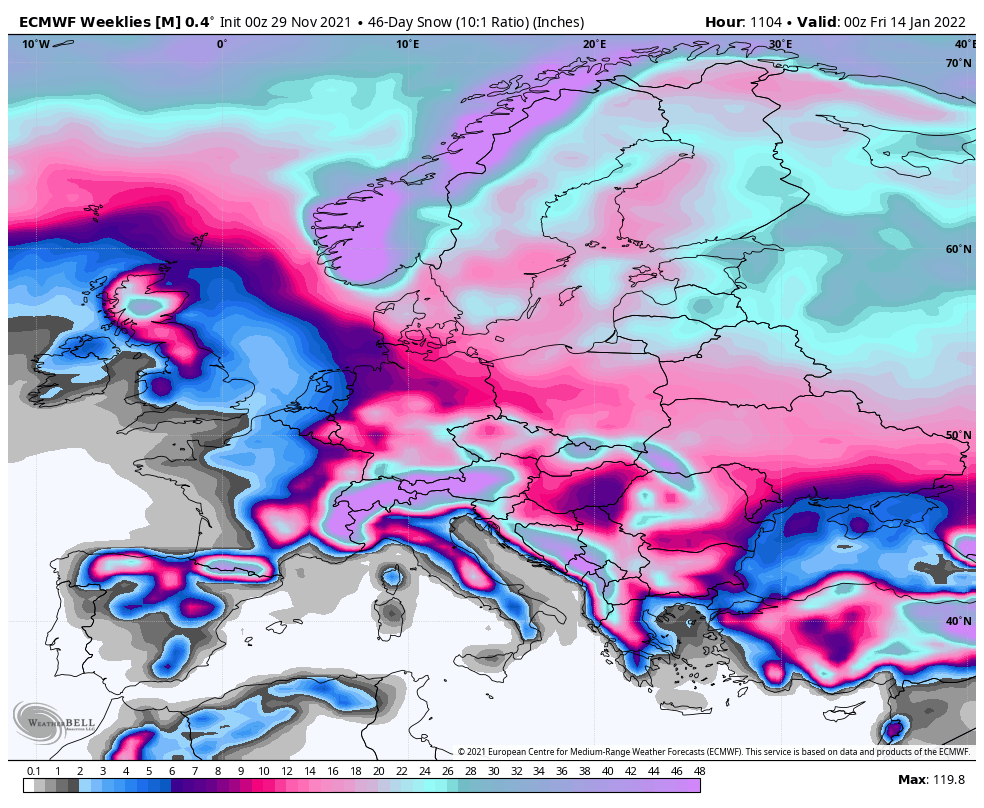
Two major events have occurred as unusual south central early December warmth began to clash with advancing cold. Tornadoes were the big story on the 10th and winds and severe weather yesterday.
Tornadoes are a global phenomenon but about 75% of them occur in the United States. The U.S. severe weather season typically starts in the late winter and spring when the combination of warmth and moisture from the Gulf of Mexico can be drawn north ahead of strong cold fronts coming out of the snow-covered mountainous west. A strong thermal contrast enhances the winds and wind shear that spin up rising air in thunderstorms ahead of cold fronts into funnel clouds and tornadoes. The action then shifts west and north during the spring into the summer. Outbreaks late in the year are rarer but can happen when the Gulf is open for business as the pattern begins turning colder as we have seen the last week.
Tornado detection improved with the addition of Doppler radar (NEXRAD) that detects rotation in thunderstorms, trained spotter networks, storm chasers armed with cellular data and imagery as well as the proliferation of cell phone cameras and social media.
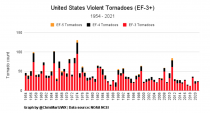
Tornado based on estimated winds and damage assessments are rated on a scale from EF0 (weak) to EF3 (Strong to EF5 (violent).
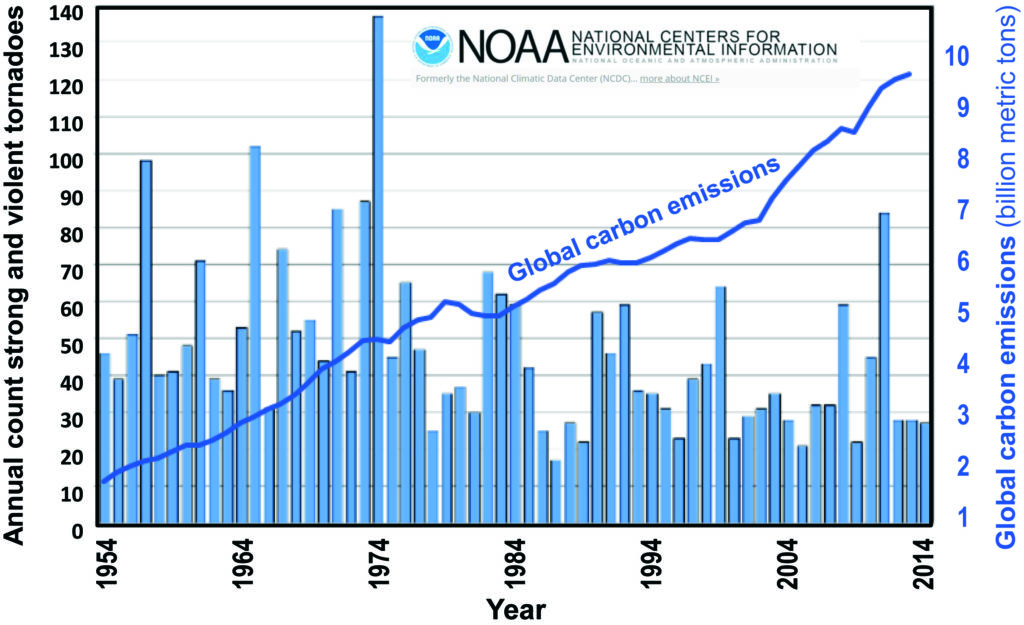
The media, many politicians, government agencies and institutions that have benefited from climate change policies and financial support that results, are quick to jump on the inevitable occasional extreme events as the “"new normal”.
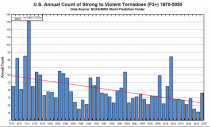
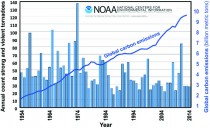
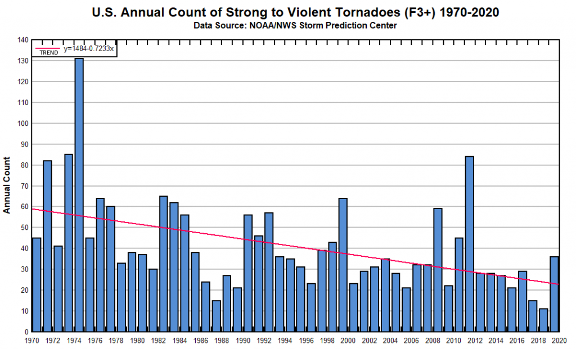
The reality is that tornadoes have seen a drop in frequency since the 1950s. The better detection shows up most in the weak EF0 tornado counts but for storms that strong to violent (EF 3+ intensity), the trend has been down (more than 50%) in the 50-year record despite improved detection.
Population growth and expansion outside urban areas have exposed more people to the tornadoes that once roared through open fields. But awareness and early warnings have saved lives.
The years 2012, 2013, 2014, 2015, and 2016 all saw below average to near record low tornado counts in the U.S. since records began in 1954. 2017 rebounded only to the long-term mean while 2018 activity returned to well below the 25th percentile. From 2017 through 2018, the U.S. set a record for the longest period in history without a tornado death. Also in 2017 and 2018, the U.S. set a record for the longest period in history without an EF3 or stronger tornado.
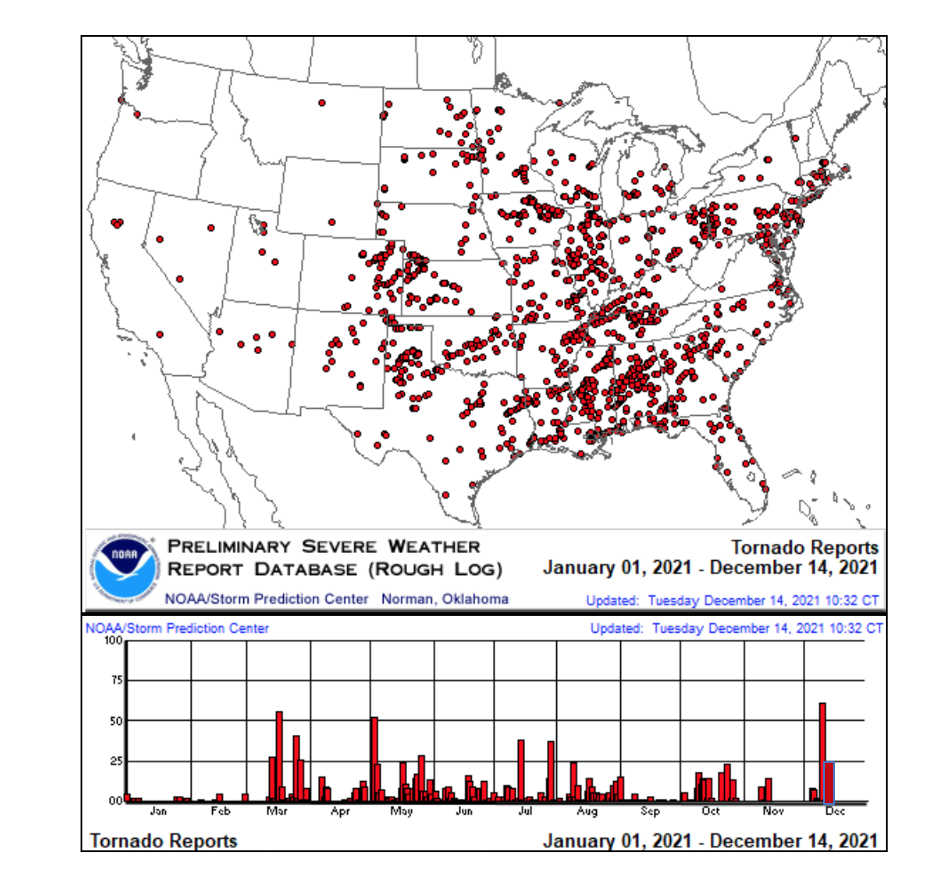
The two record-low years for number of tornadoes both occurred this past decade, in 2014 and 2018. 2019 bounced to the 75th percentile but the last two years saw it drop below average, and even after two major outbreaks with around 110 reported tornados in December 2021 the year will end below the 25th percentile.
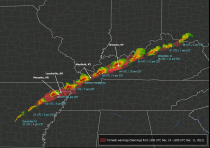
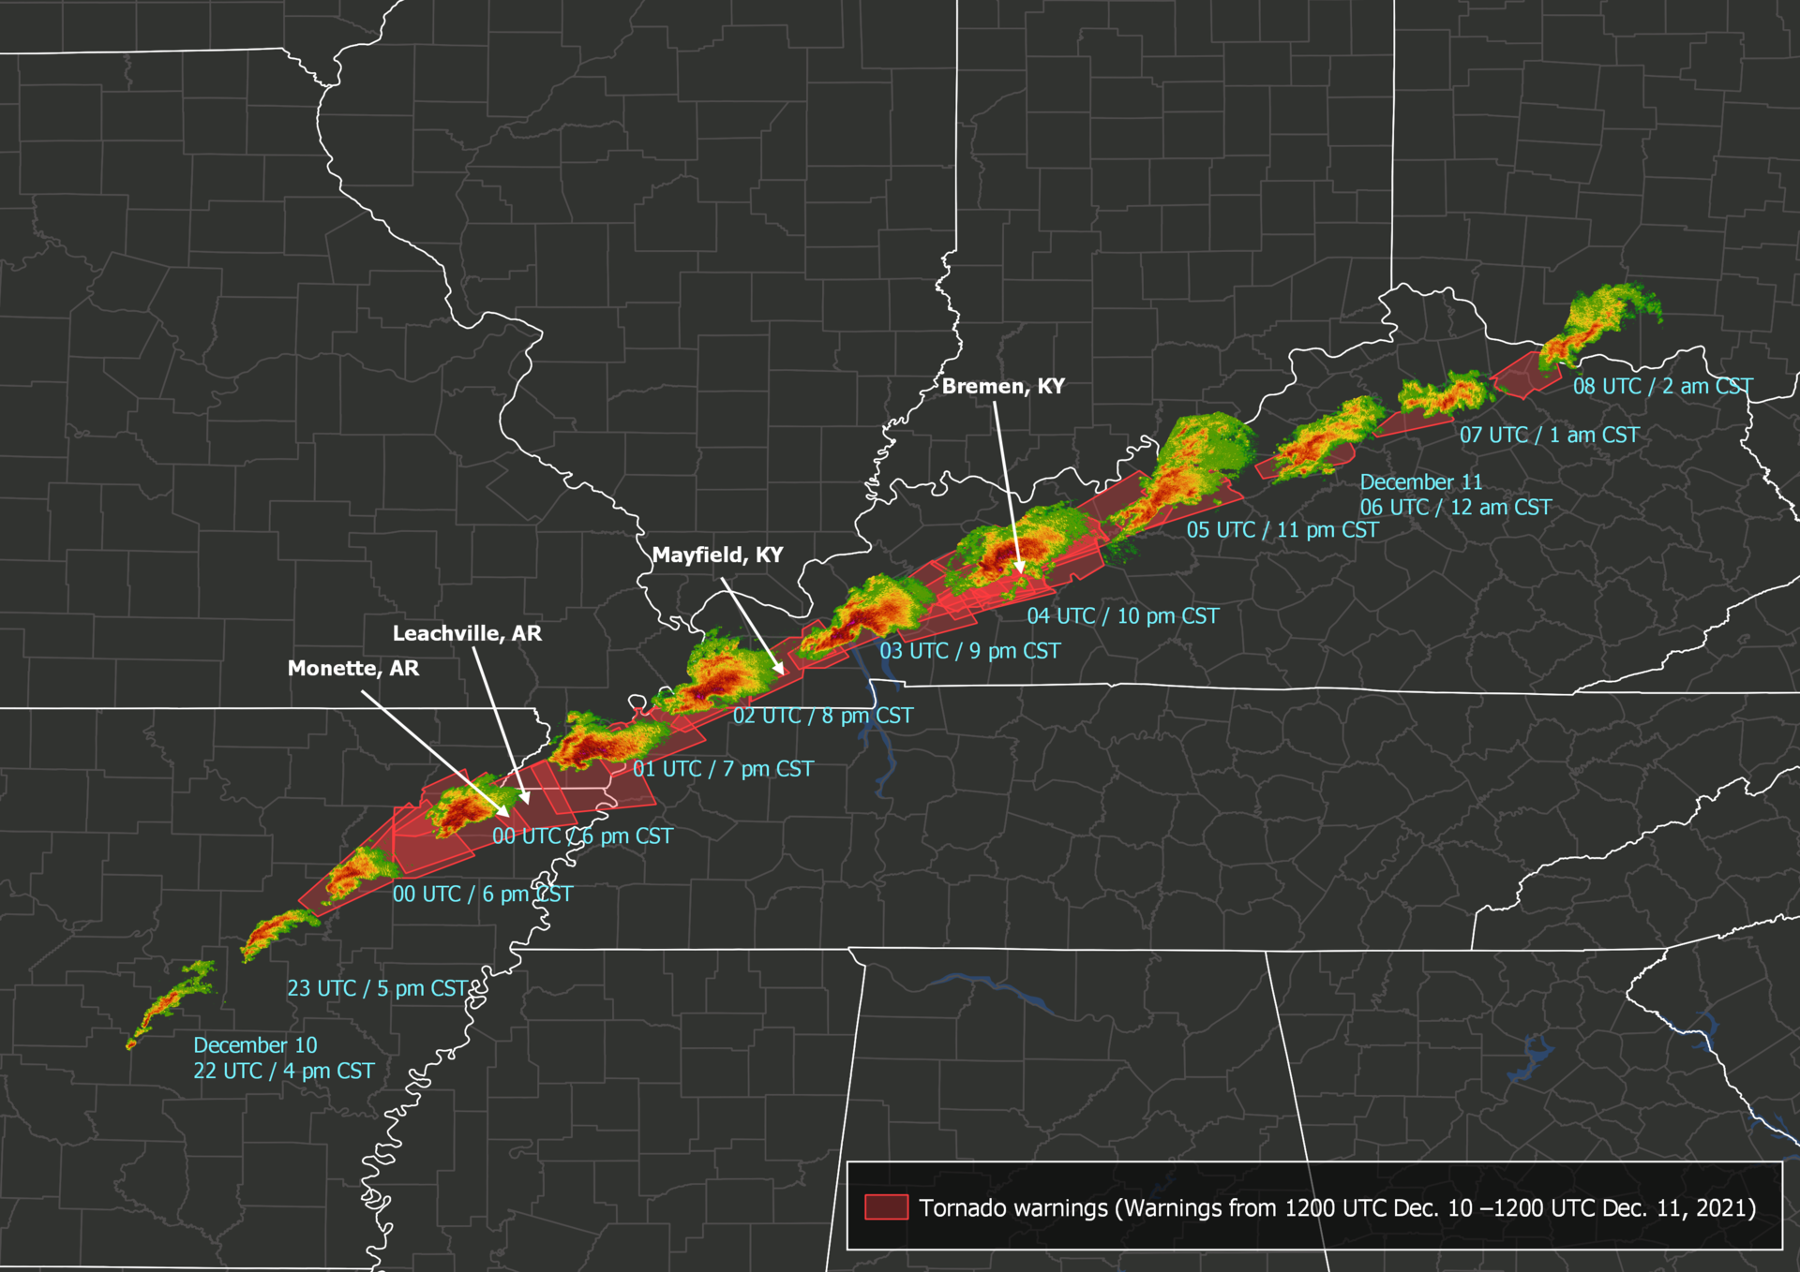
The two newsworthy major outbreaks in December 2021 with an initial estimate of around 110 tornadoes, 4 of the storms were preliminarily rated as a strong EF3 included one long track one on the ground 240 miles from Arkansas to Ohio.
Most tornadoes stay on the ground for a short amount of time and travel short distances - 3 to 4 miles on average. Long-track and very long-track tornadoes - those that travel at least 25 and 100 miles respectively - are relatively uncommon. They account for less than 1% of all tornadoes in the United States. Long-track tornadoes require a very specific set of ingredients that must exist across a wide area. These uncommon tornadoes form from a single supercell storm - a storm with a rotating updraft called a mesocyclone - that can persist for hours.
The December 10th long track storm track extended from Arkansas to Ohio.
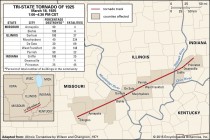
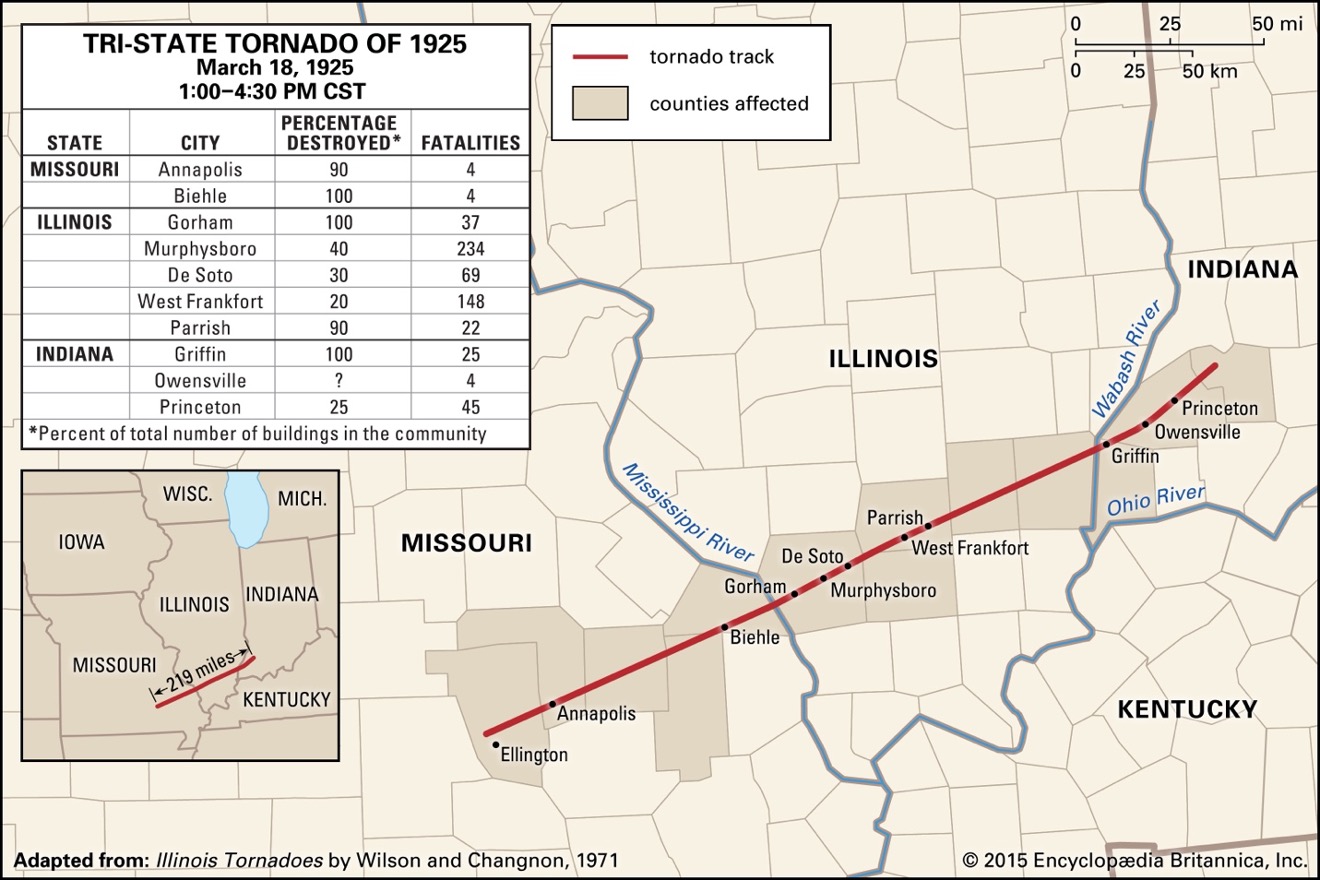
On 18 March 1925, a tornado travelled at least 219 miles through the US states of Missouri, Illinois and Indiana. It killed 747 people, more than any other tornado in US history. The tornado lasted 3.5 hours, longer than any other in recorded history.
Despite the heart-breaking coverage of the damage and deaths, better awareness and forecasts saved lives.
This recent decade long lull period followed a very active and deadly strong La Nina of 2010/11, which like the strong La Nina of 1973/74 produced record setting and very deadly outbreaks of tornadoes.
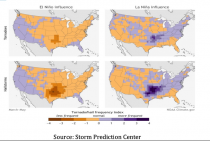
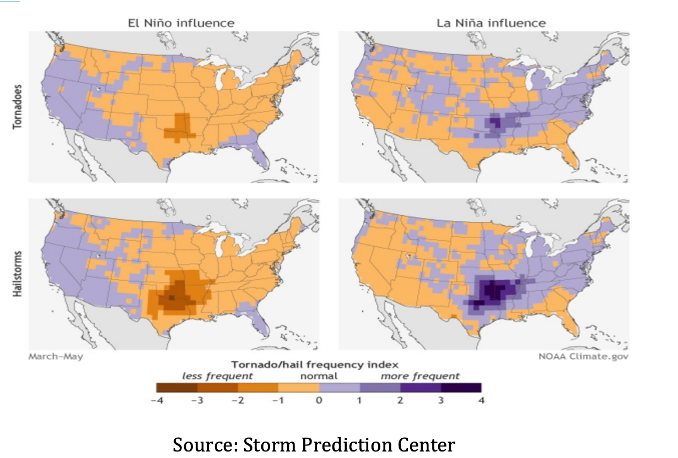
Tornadoes like most all weather extremes are driven by natural factors. Active tornado seasons or years with major outbreaks are strongly correlated with stronger La Nina events and the cold phase of the Pacific Decadal Oscillation, which favors more frequent and stronger La Ninas.
With a moderate La Nina currently in place and the Pacific in a La Nina favoring (cold) mode we may be entering an era like the 1950s to 1970s when La Ninas dominated, and tornado seasons were active. The two worst December killing tornado outbreaks were in the 1950s. Given the La Nina and two rare December outbreaks, we should prepare for active seasons ahead.
-------
Update: See what is coming next to millions/billions of people in the hemisphere here.
Anti-fossil-fuel climate policies increase energy prices, blackouts and death tolls
Climate policies promoted and imposed by Team Biden and Democrats are based on junk science, headline-grabbing scare stories, and computer models that create far-fetched “scenarios” asserting that fossil fuel use and emissions will cause Earth to warm by 4 degrees C (7 F) over the next 80 years, and cause Arctic warming that will bring colder winters.
Those dire predictions are used to justify more taxpayer-funded “research,” like a recent Columbia University “mortality cost of carbon” study that claims 83 million people (the population of Germany) “could be killed” this century by those rising planetary temperatures. Therefore we must take “immediate action” to “transform” our energy and economic systems, and replace oil, gas and coal with (millions of) wind turbines and (billions of) solar panels and backup batteries.
These policies are lethal for people and planet They would require mining on scales unprecedented in human history, much of it by slave and child laborers, and nearly all using fossil fuels - bringing massive habitat and wildlife losses, air and water pollution, and horrific human health and safety problems.
But since most of the mining, ore processing and manufacturing will occur in other countries, far from the USA, politicians and climateers can say this “alternative energy” is “clean and green.”
Worse, climate policies cause widespread “energy poverty” - energy prices rising above families’ ability to stay adequately warm (or cool) at reasonable cost, given their incomes. That means people die.
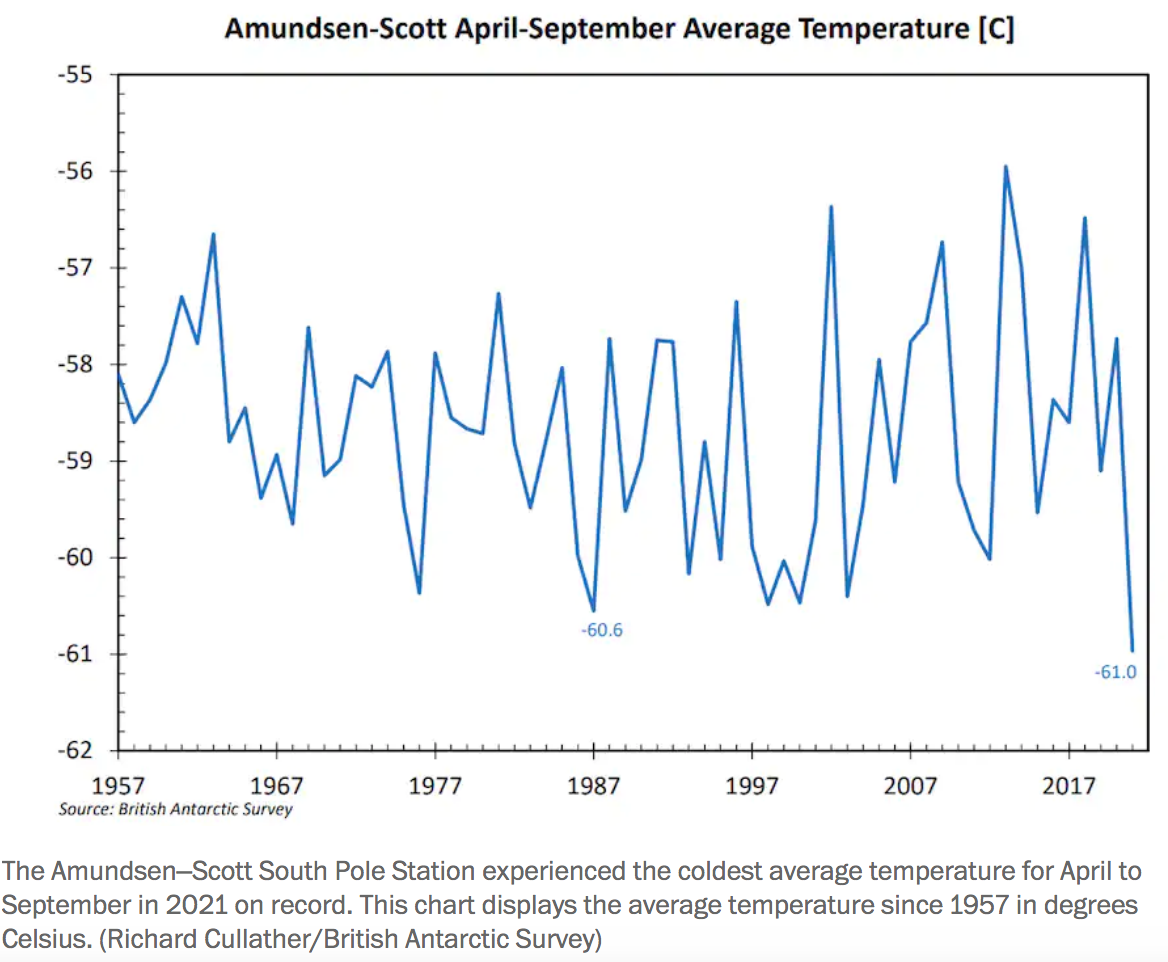
Modern housing and energy systems enable people to adapt to and survive even extreme heat and cold - even in Antarctica, which recently had the coldest winter temperatures ever recorded: -61C (-78 F). However, adaptation and survival become nigh impossible when government policies make it hard to heat or cool homes properly amid joblessness, inflation and soaring oil, natural gas, coal and electricity prices.
Indeed, it is often on the coldest and hottest days and nights, when heating or cooling are most essential, that winds blow at inadequate speeds to turn turbine blades and/or the sun shines with inadequate intensity on solar panels, to generate electricity. This (and wind and solar variability in general) results in recurrent blackouts and necessitates “backup” energy: coal, natural gas, diesel, hydroelectric or expensive battery systems, which significantly increase energy costs and worsen energy poverty, illness and death.
Proposed Biden/Democrat Green New Deal policies would require that still perfectly good natural gas furnaces, water heaters, ovens and stoves be replaced with costly heat pumps and electric appliances, powered by expensive, unreliable, weather-dependent wind and solar systems. They would necessitate installing charging stations for electric cars, upgrading home and neighborhood electrical systems to 220 volts, and having pricey battery “power walls” for backup power during increasingly frequent blackouts.
All this would cost trillions of dollars, with families and small businesses bearing the brunt.
Contrary to faulty global warming “research,” far more people die in cold weather than in hot summers. In the United States and Canada, cold causes 45 times more deaths per year than heat: 113,000 from cold versus 2,500 from heat. Worldwide, with air conditioning far less available in already hot countries than in the United States, some 1,700,000 people die annually from cold versus 300,000 from heat.
A 2014 Public Health England University College of London Institute of Health Equity report underscores how energy poverty severely, disproportionately and inequitably affects poor, elderly, fixed-income and minority families - resulting in numerous, needless illnesses, health problems and deaths.
Cold homes cause or exacerbate risks of asthma, bronchitis, flu, cardiovascular disease and other adverse health conditions. Cold temperatures also increase depression, anxiety and other mental health problems, intensifying medical and physical issues. Young children, older people, those with preexisting health conditions and other vulnerable groups are especially susceptible to hypothermia, illness and death.
The Health Equity Institute calculated that one-tenth of all “excess winter deaths” in England and Wales are directly attributable to fuel poverty, and 21% of excess winter deaths are attributable to the coldest 25% of homes. Between 1990 and 2014, researchers estimated, 30,000 to 40,000 people died each year who would not have perished if their homes hadn’t been so cold. US studies reach similar conclusions.
Adjusting for population, but not for colder winter temperatures in much of the USA (versus England and Wales), this is equivalent to some 170,000 to 230,000 excess winter deaths per year in the United States.
In 2019, 344,000 German families had their electricity cut off because they couldn’t pay their power bills.
Still worse, coal, oil, natural gas, electricity and home heating costs have skyrocketed since those English, US and German reports were prepared - because of shortsighted, climate-obsessed, callous policies.
Global demand for gas and coal surged as the world recovered from Covid - but Britain and Europe banned fracking for gas in their enormous shale deposits, Germany is shutting down its nuclear plants, Russia is playing politics with gas deliveries, and UK and EU wind turbines generated far less electricity in 2021 (way below their supposed, “nameplate capacity") due to unfavorable winds.
No wonder 65% of United Kingdom renters are struggling this year to pay their energy bills, 25% of Scots live in energy poverty, and 400,000 more UK households are on the brink of losing their gas and electricity provider before Christmas. Europe’s energy costs hit new records, and millions of UK households face 70% rise in energy bills. Excess winter death tolls will also likely set new records.
That’s happening in America too, as the Biden Administration stymies leasing, drilling, fracking and pipelines, and sends gasoline and food prices rocketing upward, amid the highest inflation rate in 39 years.
Climate policies will also exacerbate health risks in hospitals. At 13 cents per kilowatt-hour (average US business rate today) a 650,000-square-foot hospital building would pay about $2.5 million annually for electricity. At 27 cents per kWh (Britain’s pre-October average), the annual cost jumps to $5.2 million; at 39 cents per kWh (Germany’s earlier average), to $7.5 million! Those soaring costs would bring chillier conditions, employee layoffs, higher medical bills, reduced patient care, and more deaths.
Consider too that one-third of American families already had difficulty six years ago adequately heating and cooling their homes, and one-fifth of U.S. households had to reduce or forego food, medicine and other necessities to pay their energy bills. Even before COVID, low-income, Black, Hispanic and Native American families were spending a greater portion of their incomes on energy than average households.
Impacts on hard-pressed working families and people on fixed incomes would be just as harmful and disproportionate, as they too spend a greater portion of their limited incomes on energy.
Job destruction, energy poverty, illness and deaths would increase dramatically under anti-fossil-fuel policies mandated and imposed by the Biden Administration and fellow Democrats - in the name of fairness, equity and “climate justice.”
Those policies would also make America’s energy, economy, national security and foreign policy increasingly dependent on China - already the world’s biggest coal user and greenhouse gas emitter - in an increasingly dangerous world. That’s because China controls most of the metals and minerals required by “green” energy and modern transportation, communication and defense technologies.
This is The Real Climate Crisis. The ecological destruction and human death tolls should shock all of us.
They aren’t due to climate changes that are mostly natural, weather events that are no more frequent or extreme than over the previous century, or manmade global warming that exists almost solely in computer models that rely on junk-science greenhouse-gas hypotheses. The real climate crisis is due to policies that are being rammed through on the basis of false premises, fear-mongering and intolerance for fossil fuels.
Congress, courts, states and voters must act now, to reverse the damage that climate and “green” energy policies are having on our economy, jobs, health, well-being, wildlife and environment.
Paul Driessen is senior policy analyst for the Committee For A Constructive Tomorrow (www.CFACT.org) and author of books and articles on energy, environment, climate and human rights issues. Contact: pkdriessen@gmail.com
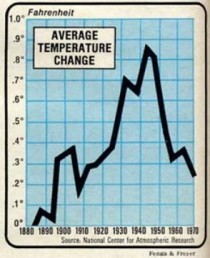
I have spend decades working on weather and climate attribution. We have with the data available been able to see cycles in the weather and global climate related to the sun and cycles in the ocean (likely related to the sun, our biggest source of energy for the atmospheric and oceanic systems). But since the 1960’s, most of the thinking increasingly was related to man’s activity, blaming cooling on the ‘human volcano’ (aerosols from burning of fuels) and warming on greenhouse gases.
Back in the early 1970s, CBS anchor Walter Cronkite, the dean of American journalism, was warning about an “ice age.” Cronkite cited scientific claims that the Earth was cooling and “the full extent of the new ice age won’t be reached for 10,000 years.” (Climate Depot)
On September 11, 1972, Cronkite cited scientists’ predictions that there was a “new ice age” coming. He called that prediction from British scientist Hubert Lamb “a bit of bad news.”
“But then there is some good news,” Cronkite continued. “That while the weather may be just a little colder in the immediate years to come, the full extent of the new ice age won’t be reached for 10,000 years. And if you can stand any more good news, even then it won’t be as bad as the last ice age 60,000 years ago. Then New York, Cincinnati, St. Louis, were under 5,000 feet of ice. Presumably no traffic moved and school was let out for the day. And that’s the way it is, Monday, September 11, 1972.”
Lamb, the scientist Cronkite cited, was no fringe scientist. He founded the Climatic Research Unit at the University of East Anglia in Great Britain. When he died, the CRU director called him “the greatest climatologist of his time,” according to the Global Warming Policy Foundation. He was also credited with establishing “climate change as a serious research subject.”
The late Cronkite is considered a “legendary journalist” and a pioneer in the field, which is why Marc Morano, publisher of Climate Depot, said this footage was so important. Morano is a former staff member of U.S. Senate Environment & Public Works Committee and producer of the upcoming global warming documentary Climate Hustle, released in 2015.
“Global warming activists have claimed for years that the 1970s global cooling scare never existed. They have tried to erase the inconvenient history which ironically blamed extreme weather like tornadoes, droughts, record cold and blizzards on global cooling,” said Morano.
Leonard Nimoy famous as Mr. Spock on Star Trek provided more detail on the thinking of the world’s best scientists at the time in a teaser overview and then a longer detailed story.
Unlike scientists often quoted by the media today, GWPF said that Lamb viewed the Earth’s climate as changing constantly and naturally. Unlike its founder, CRU now has a major role in spreading global warming alarmism. CBS said in 2009, CRU “wields outsize influence” in warming circles. The Climategate scandal centered around leaked documents and emails from that organization.
“Climate fear promoters switched effortlessly from global cooling fears in the 1970s to global warming fears in the 1980s. In the present day, the phrase ‘global warming’ has lost favor in favor of ‘climate change’ or ‘global climate disruption’ or even ‘global weirding,’ Morano added. “‘Settled science’ has never seemed so unsettled.”
-------------
Watch: Flashback 1980 CBS News w/ Walter Cronkite warns of ‘greenhouse effect’ causing ‘disruptive changes’ in ‘50-70 years’ - Cites ‘16 degrees F’ warming & ‘goodbye Miami’ & ‘boating at foot of Capitol’.
.
CBS News: “Researchers say increasingly large amounts of CO2 are accumulating in the atmosphere. They fear the earth will gradually become warmer causing as yet uncertain but possibly disruptive changes in the Earth’s climate 50 to 70 years from now.” ...
Sen. Paul Tsongas (D-Mass) Senate Energy Committee: “It’s possible probable we really don’t know. But if it happens it means goodbye Miami, goodbye Corpus Christi, goodbye Sacramento, goodbye Boston—which obviously is much more of a concern. Goodbye New Orleans. Goodbye Charleston, Savannah, and Norfolk. On the positive side, it means that we could enjoy boating at the foot of the Capitol and fishing on the South Lawn.”
Gordon MacDonald, Mitre Corp Chief Scientist: “One model of climate the Jason climate model predicts that doubling carbon dioxide will result in August and Washington DC that are 9 degrees centigrade warmer or 16 degrees Fahrenheit than current summers but that the winters will only be 2 degrees centigrade warmer changes of this. Changes of this magnitude are very probably going to have a profound effect on agriculture, on all of the aspects of energy use and generation, and on water and land use.”
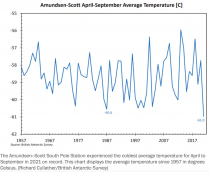
The average temperature at the Amundsen-Scott South Pole Station between April and September, a frigid minus 78 degrees (minus 61 Celsius), was the coldest on record, dating back to 1957. This was 4.5 degrees lower than the most recent 30-year average at this remote station, which is operated by United States Antarctic Program and administered by the National Science Foundation. The chill was exceptional, even for the coldest location on the planet.
Several ships trapped in ice after Arctic sea freezes early near Russia
An early and unexpected freeze has trapped at least 18 cargo ships in the Arctic Sea off the coast of Russia. Ice up to 30cm thick has formed across most of the Laptev Sea and East Siberian seas, according to the Barents Sea Observer, a Norwegian news site.
That comes after Dr Paul Tepes, of the University of Edinburgh’s School of GeoSciences, said: “… As has been observed elsewhere in the world, ice loss in the region is accelerating. As the climate continues to warm, significant ice loss in the Russian Arctic will have clear impacts for sea level rise.”
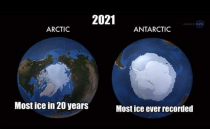
The Antarctic Just had its coldest 6 months ever recorded.
In 2014 Nasa said Ice was the largest ever recorded. Ice at the Antarctic has only grown since then. Meanwhile Arctic Ice Is reaching its highest point in 20 years. According to the latest data from the Danish Meteorological Institute (DMI), Arctic sea ice ‘volume’ has been on something of a tear in recent weeks - it is now tracking above all recent years and shows no signs of abating. It may hit a 30 year record before warmer weather hits…
This is just as it did last winter and spring. Here is how they spun it by attacking ‘deniers’ here. It is concerning because it is happening again as they are removing nuclear plants.
We often hear about the dangers of heat. But research shows cold is far more deadly than heat (10x more in Brazil, 20X more in South Africa. The authors estimate in 2019, “the average cold-attributable mortality exceeded heat-attributable mortality in all countries for which data were available.” Cold effects were most pronounced in China and in New Zealand.
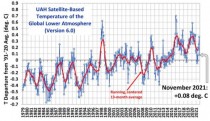
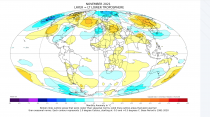
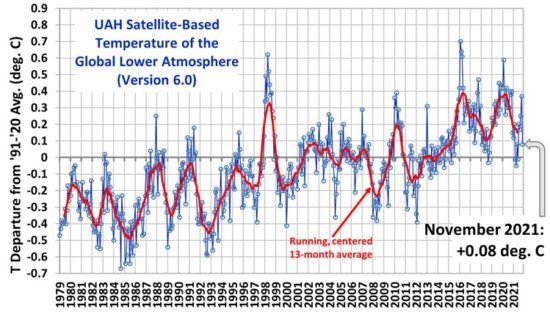
Meanwhile, the UAH Version 6.0 global average lower tropospheric temperature (LT) anomaly for November, 2021 was +0.08 deg. C, down substantially from the October, 2021 value of +0.37 deg. C. This is consistent with the La Nina rebound.


