Jul 16, 2012
Case studies from around the world: no evidence of accelerating sea level rise over the last 30 year
by Sebastian Luning, Fritz Vahrenholt
1. GPS-monitored global tide gauges
In 2009 Guy Woppelmann et al examined what effects vertical land movement had on the sea level data from tide gauges and published their results in the Geophysical Research Letters. The scientists evaluated globally 227 stations whose elevation was monitored by GPS. 160 of these stations were located at a distance maximum 15 km from the coast. By measuring the vertical movement of the tide gauges, they were able to apply a correction. From this they calculated a mean global sea level rise of 1.61 mm/year over the last century. Figure 1 shows that sea level rise has remained constant since 1940, no acceleration over the last 70 years!
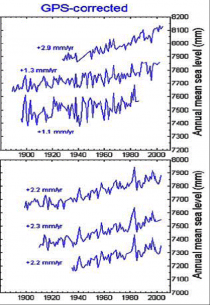
Figure 1: Sea level development for that last 100 years for northern Europe (top) and northwest America (bottom) based on tide gauges. No acceleration since 1940. Source: Woppelmann et al. (2009). Enlarged
2. Arctic Ocean shows no acceleration
2. Another important paper appeared in June, 2012 in the Geophysical Research Letters. A team lead by Olivier Henry of the Centre National de la Recherche Scientifique in Toulouse, France, examined 62 tide gauges along the coast of Norway to Russia over the last 62 years. The study yielded some surprising results. Beginning in 1950 Arctic sea level remained relatively stable (Figure 2). Sea level then began to rise in 1980 and reached a high point in 1990, which has yet to be surpassed. From 1995 to 2009 the authors calculated a mean sea level rise rate of 4 mm/year.
What is especially fascinating is that sea level at this region was in sync with the Arctic Oscillation (AO), see Figures 2 and 3. There’s been a decoupling only for the last 10 years, which is too short a time period to draw any sound conclusions. One thing is certain: The AO will also impact sea level behaviour there in the future.
Not only does temperature impact sea levels globally, but so do natural oceanic cycles. Ocean cycles can lower or raise sea levels, and accelerate or slow them down. An overall acceleration in sea level rise in the Arctic Ocean due to melting ice over the last 30 years cannot be detected.
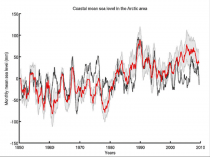
Figure 2: From 1950 to 2000 sea level changes are predominantly in sync with the Arctic Oscillation (black curve). Figure from Henry et al (2012).Enlarged
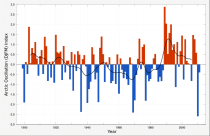
Figure 3: Arctic Oscillation Index (Source: Wikipedia).Enlarged
3. New Zealand
Now let’s go to the other side of the globe - New Zealand, where only a few tide gauges go back to 1900. John Hannah and Robert Bell of the University of Otago and the National Institute of Water and Atmospheric Research respectively published a paper in January 2012 in the Journal of Geophysical Research. The new curves show that sea level rise has been steady since 1940 (Figure 4). The development in New Zealand is similar to the global situation. The long-term New Zealand trend is 1.7 mm sea level rise per year.

Figure 4: Sea level development from four New Zealand coastal tide gauges. Here there’s been no acceleration in sea level rise over the last 70 years. Figure from Hannah & Bell (2012).Enlarged
Particularly interesting in the Hannah and Bell study is that New Zealand sea level rise is characterized by decadal cycles. Sea level rose and dropped in sync with the Pacific ocean cycles (Southern Oscillation Index, SOI and others), see Figure 5. Also see report from the NIPCC.

Figure 5: Shown are four New Zealand sea level tidal gauge series (thin curves), along with the Southern Oscillation Index (bold black curve). Source of figure:Hannah & Bell (2012). Enlarged
4. Tasmania
In January, 2012, an international team led by Roland Gehrels of the University of Plymouth published a new study in the Earth and Planetary Science Letters examining the sea level history of Tasmania. Using cores taken from salt marshes, they reconstructed sea level development for the last 6000 years. Especially interesting are the last 200 years.
Sea level rose between 1900 and 1950 at a rate of 4.2 mm per year (Figure 6), but slowed down considerably in the second half of the 20th century to an average of only 0.7 mm per year - similar to southern New Zealand. No sea level rise acceleration is detectable in the Australian New Zealand region over the last decades. In fact, just the opposite is true. Sea level rise slowed down in the second half of the century.
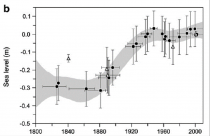
Figure 6: Sea level rise around Tasmania over the last 200 years. Sea level rise slowed down during the second half of the 20th century. Source of diagram:Gehrels et al. (2012). Enlarged
5. Tarawa Atoll
Simon Donner of the University of British Columbia closely examined sea level development for the last 20 years for the Japanese atoll Tarawa and published his findings in the journal Eos in April 2012. Now hold on to your seat: tide gauges show that the sea level around Tarawa did not rise at all during this period (Figure 7)!
Moreover, the sea level fluctuations depicted by the curve are mainly due to the El Nino effect. In 1998 sea level dropped a full 45 cm as the transition was made from a powerful El Nino to a La Nina. Also see articles by Mark Lynas and Roger Pielke Sr.
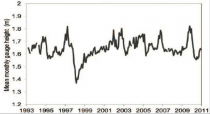
Figure 7: Sea level development around the Tarawa atoll based on tide gauges. There is no detectable rise. Diagram source: Donner (2012). Enlarged
6. Bay of Biscay
In May, 2012, a study by Eduardo Leorri of East Carolina University appeared in the Quaternary Science Reviews. Examining sediment cores, the scientists studied sea level development of the Bay of Biscay for the period going back 10,000 years. As Figure 8 shows, sea level rise slowed down 7000 years ago.
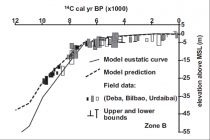
Figure 8: Sea level rise in the Bay of Biscay. Diagram source: Leorri et al. (2012). Enlarged
Leorri and his team compared the results to coastal tide gauge readings from the region for the last 200 years. From 1800 to 1900 (Figure 9), sea level was stagnant. Then it began to rise around 1900. But no unusual acceleration can be detected over the last 30 years.
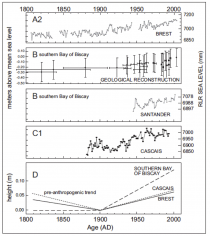 Figure 9: Coastal tide gauge measurements from the Bay of Biscay. Diagram source: Leorri et al. (2012). Enlarged Figure 9: Coastal tide gauge measurements from the Bay of Biscay. Diagram source: Leorri et al. (2012). Enlarged
7. Tony Brown, sea level of the last 2000 years.
A comprehensive presentation of pre-industrial sea level development was made by Tony Brown, who published his results at Judith Curry’s blog (blog article, detailed pdf-version). Readers should refer to pages 23-26, where Brown brings up some interesting points on sea level rise over the last 2000 years. Referring to the work of Aslak Grinsted of the University of Lapland from 2010 in the Journal Climate Dynamics, it is discussed whether the sea level of today has reached the levels of the Medieval Warm Period.
In any case, natural and anthropogenic causes have to be considered and properly attributed. Like the Hockey Stick episode, sea level development can in no way be considered as a monotone and non-eventful phenomenon. It too has varied naturally over the centuries, and the natural factors will continue to play a major role.
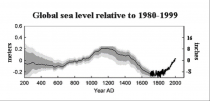
Figure 10: Sea level development model of the last 2000 years. The bold black curve starting in 1700 is a geological reconstruction by Jevrejeva et al. (2006). Modified as to Grinsted et al. (2010). Enlarged
In May, 2012 at WUWT, Paul Homewood led an interesting discussion on whether sea level rise accelerated during the recent decades when compared to the 20th century. He concludes that satellite measurements may be flawed.
In summary, our global sea level journey produced some good results, some very remarkable results, depending on your point of view. Signs of an accelerating sea level over the last 30 years could not be found in any of the studies.
It doesn’t look good for the acceleration fans.
Jul 09, 2012
June 2012 U.S. Temperatures: Not That Remarkable
by Roy W. Spencer, Ph. D.
I know that many journalists who lived through the recent heat wave in the East think the event somehow validates global warming theory, but I’m sorry: It’s summer. Heat waves happen. Sure, many high temperature records were broken, but records are always being broken.
And the strong thunderstorms that caused widespread power outages? Ditto.
Regarding the “thousands”: of broken records, there are not that many high-quality weather observing stations that (1) operated since the record warm years in the 1930s, and (2) have not been influenced by urban heat island effects, so it’s not at all obvious that the heat wave was unprecedented. Even if it was the worst in the last century for the Eastern U.S. (before which we can’t really say anything), there is no way to know if it was mostly human-caused or natural, anyway.
“But, Roy, the heat wave is consistent with climate model predictions!”. Yeah, well, it’s also consistent with natural weather variability. So, take your pick.
For the whole U.S. in June, average temperatures were not that remarkable. Here are the last 40 years from my population-adjusted surface temperature dataset, and NOAA’s USHCN (v2) dataset (both based upon 5 deg lat/lon grid averages; click for large version):
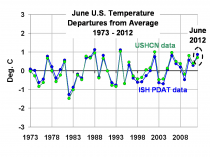
Certainly the U.S drought conditions cannot compare to the 1930s.
I really tire of the media frenzy which occurs when disaster strikes...I’ve stopped answering media inquiries. Mother Nature is dangerous, folks. And with the internet and cell phones, now every time there is a severe weather event, everyone in the world knows about it within the hour. In the 1800s, it might be months before one part of the country found out about disaster in another part of the country. Sheesh.

Enlarged
-----------------
This is What Summer Looks Like
By Dr. Anthony Lupo
It is early July, and we may finally at the end of a record setting heat wave. As usual, several scientists were quoted saying something along the lines of “this is what global warming looks like” [1]. They say that heat waves such as the one occurring this year are becoming more common and will happen more in the future. We also heard that this heat wave is unprecedented and more widespread than ever. While some sources cautioned that this singular event might not be attributed to global warming, it came with the typical caveat that these are the kind of events that are projected to occur in a warmer world.
The definition of an extreme event is one that a) occurs rarely or in the tail(s) of a statistical distribution, or b) an event that causes extreme physical burdens or economic hardship for humans and/or the environment. Since heat waves have an impact in real human terms, using the former definition would not be practical. Also, by the former definition, the frequency of heat waves would not change assuming a normal distribution regardless of how much climate changed.
While it is true that the globe today is warmer than it was in the early 20th century, the same cannot be said of the United States [2]. The 30-year periods encompassing the 1930s are as warm, or warmer than, the 1981-2010 means depending on the region [2].
If it is true that global temperatures today are warmer than those of the early 20th century, then more extremes could be likely using the latter definition above and assuming that, during both periods, the temperature distributions could be described as a normal distribution or “bell curve”.
Changes in variability would make the assessment of climate change more difficult. A temperature distribution shorter and fatter (taller and skinnier) than the normal, means the climate is more (less) variable. Thus, it is possible that under conditions of a modest rise in temperature over a 100 year period, for example, heat waves could become less frequent. This would indicate the modest temperature rise was accompanied by a reduction in temperature variability. This situation likely describes US temperatures over the last century or more, and the analysis below will support the conjecture.
Then, in order to discuss the change in the frequency of extreme events, such as the recent heat wave, a benchmark or threshold could be chosen. In our region, the Missouri region, it makes sense to measure extreme heat waves using the number of consecutive 100 F maximums as one yard stick, since this would be a value most people in our region could agree is extreme. From June 26th to July 7th, or on 11 consecutive days, we experienced 100 F maximums in Columbia and Saint Louis. How does this stack up against the record books?
Table 1 shows that this heat wave ranks as number six and two events of all-time for Columbia and Saint Louis, respectively. But, Table 1 also demonstrates that only two (one) top 10 heat waves have occurred in the last 20 years in Columbia (Saint Louis). In fact, for both cities, most of these occurred in the early part of the 20th century! Was this heat wave the most widespread? Certainly, Washington, DC has been hot as of late, but similarly, the number of extreme hot days there also occurred earlier in the 20th century [3]. Additionally, it can be inferred that the heat waves and droughts of the 1930s were as expansive or more so that today [4]. Finally, Table 1 shows that this year’s event can’t even lay claim to the earliest such event to occur in the summer season
It is still quite early in the summer of 2012, and the current heat wave has exacerbated the ongoing drought occurring over a large fraction of the US agricultural region. It is a serious event that bears watching, and this year has the potential to join the list of some of the most memorable drought years. But, it is not symptomatic of anthropogenic global warming.
Table 1. The top 10 heat waves in Saint Louis and Columbia, MO as measured by the number of consecutive days over 100 F. Source: Saint Louis National Weather Service. (http:www.nws.noaa.gov) The table shows rank, number of days, and the ending date for each event.

Enlarged
[1] Washington Times
[2] Lupo, A.R., 2011: Is Warmer Really the New Normal? A paper written for: http://www.icecap.us
[3] The Climate Depot (2012). See also.
[4] Fye, F.K., D.W. Stahle, and E.R. Cook, 2003: Paleoclimatic analogs to twentieth century moisture regimes across the United States. Bull. Amer. Meteor. Soc., 84, 901 - 910.
-----------------
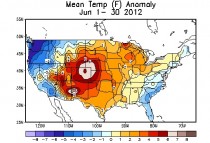
Enlarged
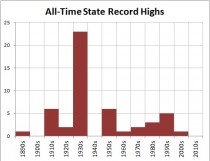
All time state record highs
Enlarged
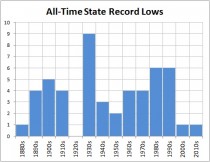
All time state record lows
Enlarged
Jul 09, 2012
Whistler snow maze - July on the Mountain
Whistler Mountain Resort
Summer has arrived at Whistler Blackcomb, but the results of an amazing winter of snow (1382 cm’s of total snowfall) can still be experienced at the Summit of Whistler Mountain. With the Peak Chair now open daily for sightseeing as part of the Peak 2 Peak Alpine Experience, visitors can gain access into the alpine and walk from the Summit of Whistler down to the Roundhouse lodge through snow walled lined trails, with banks as high as ten metres tall, as seen in the photoes below (taken near the peak July 5, 2012).
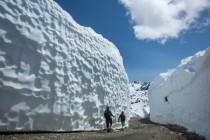
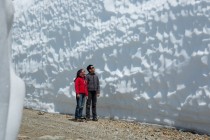
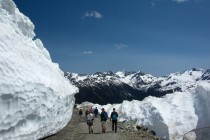
Visitors can also experience the record breaking Peak 2 Peak gondola, and the stunning 360 degree views that it provides.
High resolution copies of this image and additional images can be downloaded at the following link.
All photos courtesy of Mitch Winton/Coast Mountain Photo
Jul 04, 2012
Cold Comfort
By Alan Caruba
Unless you live in Seattle, you likely did not know that the National Weather Service just announced that the city endured its third coolest June on record. As much of America swelters through a heat wave, it’s not surprising that the usual suspects are telling everyone that it’s because of “global warming.”
I have a longtime friend, Ron Marr who has a Jack Russell Terrier and in a recent commentary for Missouri Life magazine, he wrote that, “Jack doesn’t believe in global warming in the least; he does not believe the recent atmospheric hellfire results from ozone holes or aerosol cans or giant leprechauns with a big magnifying glass. We share the same views on the topic and have discussed them often. Our considered opinion is that this streak of blazing nonsense stems from the fact that - to put it in scientific terms - it’s summer and the sun is hot.”
On July 3rd Seth Borenstein, a reporter for the Associated Press, a newswire service that has been reporting global warming lies for decades, wrote that “If you want a glimpse of some of the worst of global warming, scientists suggest taking a look at U.S. weather in recent weeks.”
IT’S SUMMERTIME, SETH! IT GETS HOT IN THE SUMMER!
It did not take long for the high priests of global warming to proclaim the current WEATHER to be CLIMATE. There’s a very big difference. Weather is what is occurring now while climate is measured in terms of centuries. It’s about trends and cycles.
It surely has been a hot summer thus far. Reuters reported that “more than 2,000 temperature records have been matched or broken in the past week as a brutal heat wave baked much of the United States.” The announcement was made by the National Oceanic and Atmospheric Administration (NOAA) on July 2nd.
Meteorologist Joe Bastardi took another reporter to task for coupling the heat wave with global warming, pointing out that “The US is less than 10% of the globe” while ignoring that “Scandinavia had coldest June on record and that Australia is having a bad winter.”
What we should all know by now is that the Warmists all use trickery to advance their hoax.
The simple fact is that heat waves are nothing new. In 1936 a North American heat wave was the most severe in the modern history of the continent. It occurred in the middle of the Great Depression, killing more than 5,000 Americans and desiccating vast amounts of crops. To put it in perspective, there were no home air conditioning appliances at the time. People depended on fans to circulate the air.
The sun surely is hot, but its heat - solar radiation - has not been sufficient to avoid cyclical ice ages and short term periods of intense cold because the sun itself goes through cycles of increasing and diminishing solar radiation.
There was a “Little Ice Age” that lasted between 1550 and 1850. Temperatures dropped to the point that the Thames River in England froze over and “frost fairs” were held on its surface. It was felt through Europe and parts of North America.
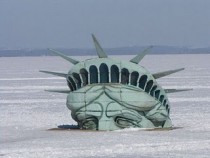
Writing in The Wall Street Journal, Matt Ridley noted that “Over the past million years, it has been as warm as this or warmer for less than 10% of the time, during 11 brief episodes known as interglacial periods,” adding that “this warm spell is already 11,600 years old, and it must surely, in the normal course of things, come to an end.”
The average length of interglacial periods is 11,500 years.
In the 1970s, prior to the global warming hoax, many scientists were convinced that a new ice age had begun. In January 2012, a member of the Russian Academy of Sciences, Habibullo Abdusamatov, predicted that the next ice age will begin in 2014 and will last at least two centuries. Regarding the timing, he could be right. He could be wrong. One thing is sure. The Earth is overdue another ice age.
My friend, Robert W. Felix, the author of “Not by Fire, But by Ice”, is an expert on ice ages and magnetic reversals. It is the latter that accompanied mass extinctions such as the dinosaur’s fate and many other species at the end of the Cretaceous period. In ice ages, the Earth’s water doesn’t disappear, it turns to ice. The current growth of the planet’s glaciers is an indicator of what is actually occurring.
Another indicator, of course, is the sun. On January 29, 2012, writing in the Daily Mail, a British newspaper, David Rose noted that “The supposed ‘consensus’ on man-made global warming is facing an inconvenient challenge after the release of new temperature data showing the plane has not warmed for the past 15 years.”
“After emitting unusually high levels of energy throughout the 20th century, the sun is now heading towards a ‘grand minimum’ in its output, threatening cold summers, bitter winters, and a shortening of the season available for growing food. Solar output goes through 11-year cycles, with high numbers of sunspots seen at their peak.”
“We are now at what should be the peak of what scientists call ‘Cycle 24’...but sunspot numbers are running at less than half those seen during cycle peaks in the 20th century.” Oddly, despite the obvious and documented effect of the sun on the planet’s average temperature, there remain scientists who are unconvinced of its essential role. Only a relative few even understand the role of magnetic reversals on the planet’s history.
Actually, the diminishing number of sunspots has been known for a while. In June 2010, Stuart Clark, writing in The New Scientist, observed that “For the past two years, the sunspots have mostly been missing. Their absence, the most prolonged for nearly a hundred years, has taken even seasoned sun watchers by surprise.”
The obvious often catches people by surprise. The last Ice Age came on very swiftly and the next is likely to do so as well. In the meantime, the current heat wave will capture everyone’s attention.
Jul 04, 2012
35 Years Ago Today: Global Cooling Caused Severe Wind Damage
By Dr. Roy Spencer
The recent thunderstorm wind event which caused widespread wind damage from Ohio to the mid-Atlantic coast has, rather predictably, led to claims that global warming is the root cause.
Known as a “derecho”, these events are indeed uncommon, but have always been around: the term was originally coined in 1888 in a study of thunderstorm wind damage which occurred in 1877.
In fact, one of the most famous events occurred when global temperatures reached a minimum, back in the 1970’s. Known simply as “The Storm”, it occurred 35 years ago today, on July 4, 1977. There were widespread blowdowns of trees (see the photo, above). Even though the event occurred over relatively unpopulated areas in Minnesota, Wisconsin, and Michigan, the highest recorded wind speed was an astonishing 115 mph, officially recorded with an airport anemometer.

Compare that to the derecho event of last week, which occurred over heavily populated areas: the highest measured wind speed in the extensive list of reports at the Storms Prediction Center was only 92 mph, and even that was on a home weather station, and so is unofficial.
So, why all the fuss over last weeks storm? Because it didn’t hit flyover country. Tens of millions of people were affected, and millions went without power.
Of course, those affected included many journalists, so it is only natural that they would speculate (and seek out experts to speculate) about the sinister causes of such an event.
Surely the silliest comment I saw came from Bill Nye, “The Science Guy”, who stated: “...We had a 30-degree temperature drop in Maryland and Virginia this weekend, in just - in a half-hour. These are consistent with climate models.”
First of all, such temperature drops occur routinely with the passage of mid-latitude thunderstorms. Secondly, climate models predict no such thing anyway. If “The Science Guy” gets it this wrong, how can I trust him on anything else?
|


 Figure 9: Coastal tide gauge measurements from the Bay of Biscay. Diagram source: Leorri et al. (2012). Enlarged


