Nov 15, 2010
Climate Corruption
Dr. David Evans
FOREWORD BY JOANNE NOVA
How many excuses does it take? The western climate establishment has allowed egregious mistakes, major errors, and obvious biases to accumulate - each factor on its own might be hard to pin down, but the pattern is undeniable.
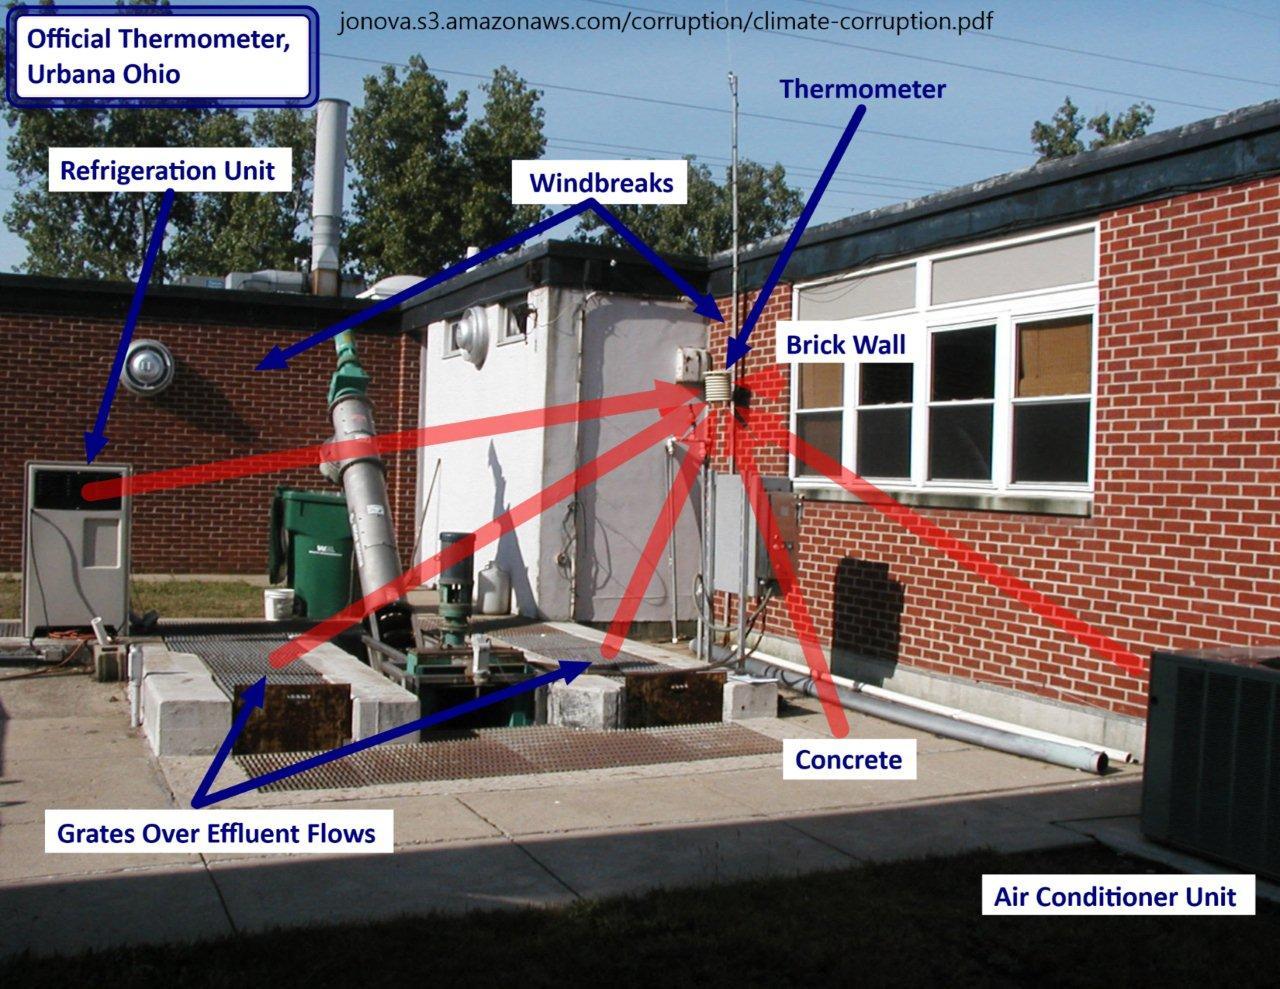
Figure 1:
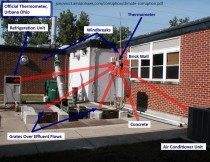
Figure 1: An official thermometer at a waste water treatment plant. It gets extra warming from air conditioning and refrigeration exhaust, concrete, a brick wall, and some equipment. It is protected by windbreaks. In addition, the effluent flowing under the grates is well above freezing in winter when vapor can be seen rising from the grates. (The red lines show possible heat paths; obviously only a small portion of the heat from each source gets to the thermometer.) Photo courtesy of Anthony Watts, www.surfacestations.org and Steve Tiemeier. Enlarged here.
The Western Climate Establishment is Cheating
* Official thermometers are overwhelmingly in warm localities such as near air conditioner exhaust vents, buildings, concrete, tarmac, or asphalt.
* Officials hide the Argo data, which shows the world’s oceans are cooling.
* They ignore hundreds of thousands of weather balloon results that show the climate models overestimate future warming by at least 300%.
* Climate scientists frequently point to the last 130 years of global warming, but don’t mention the full story: the planet started warming before 1700, over a century before humans started pumping out meaningful amounts of CO2.
* Leading authors publish a crucial graph with a deceptive colour scheme that imitates the results they wish they’d got. Why did a leading peer-reviewed climate journal publish such a naked and childish attempt at cheating?
* Their adjustments blatantly transform the original raw data from thermometers into rising trends. And they selectively ignore thousands of other thermometers where there is less warming.
* The Russian, Chinese and Indian climate establishments, which are financially independent of the western climate establishment, are all skeptical. As are many scientists from other branches of science, and many retired climate scientists (who no longer have anything to lose by speaking their minds).
Global warming is measured in tenths of a degree per century, so any slight artificial nudge to the thermometer is important.
Conclusion
The western climate establishment supports the concept that global warming is man-made, and disparages all other theories. They issue reports that overwhelm their readers with detail, written in dense language that is difficult for a layperson to decode. Basically their message is authoritarian: “we are the experts, it is very complicated, you can’t understand it, so just accept what we say.”
But their message is nonsense. Everyone is familiar with temperature, and everyone (except the “politically sophisticated") knows that siting official thermometers near air conditioners is cheating. The reality is that the temperature and other data has become unfavorable to their climate theory, so they hide behind complexity and authority instead of simply telling you what is going on.
While their theory seemed plausible 15 years ago, new evidence has proven the influence of CO2 to be greatly exaggerated. There is a germ of truth to their theory, but our emissions are not nearly as serious as they make out. The western climate establishment does not want you to know this, presumably for fear of losing the considerable income, perks, status, and influence that has come their way since they started promoting their theory. So they have taken to bamboozling us with “science”, and to cheating.
The public, politicians, and media do not generally understand science, but they do understand cheating. This paper focused on a few of the more easily understood or critical examples of establishment cheating.
The western climate establishment receives a great deal of public money as a result of their cheating. Obtaining money under false pretences, by deception, is technically fraud. We can leave it to government auditors and criminal investigators to sort that out as necessary, but in the meantime what matters most is whether the western climate establishment is right or wrong. If they are right, we aren’t doing enough to curb emissions and prevent disaster. If they are wrong, we are wasting time and resources that would be better spent elsewhere, entrenching a vast gravy train of parasites, and extending the influence of government into our economy.
The obvious cheating of the western climate establishment strongly suggests they are hiding something and that they are wrong.
That their cheating is so blatant suggests that the media has not put them under any real scrutiny. It is left to retired scientists and bloggers to point out their cheating and errors, over the Internet. Our media has been incapable or unwilling.
It’s been a lucrative theory for the western climate establishment, but reality will force them to abandon it eventually. And the political class will realize they were taken in. Read the full, very detailed post here.
Nov 14, 2010
Snowstorm Causes 400 Minnesota Crashes; 2 Die in Wisconsin
By Dinesh Ramde
(Nov. 13)—Parts of the Upper Midwest dug out from a heavy snowfall Saturday that caused more than 400 traffic accidents in Minnesota, and wintry conditions also were being blamed for a collision in northern Wisconsin that killed two people.
Nearly a foot of snow had fallen in parts of the Twin Cities area by Saturday evening, downing trees and causing sporadic power outages.
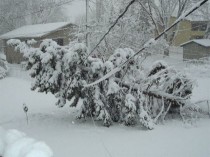
This tree went down on the lines going into this house. (credit: Sandy Larson on WCCO-TV)
The storm that began late Friday night was blamed for a collision Saturday morning that killed both drivers and left a passenger hospitalized. The sheriff’s department in Wisconsin’s Bayfield County said the storm produced “rapidly deteriorating road conditions” that likely contributed to the crash.
Kevin Kraujalis of the National Weather Service’s Duluth office estimated that Bayfield County had a couple of inches of snow on the ground when the collision occurred. The meteorologist said the county had about 5 inches as of 6 p.m. Saturday.
The Minnesota State Patrol responded to 401 crashes as of 4 p.m, with 45 of them involving minor injuries, Patrol Capt. Matt Langer said. There were no other immediate reports of fatalities or major injuries.
The storm dumped 11 inches of snow in parts of Eden Prairie, Minn., and 10 inches in the Forest Lake and Mankato areas, said Todd Krause, a federal meteorologist in Minneapolis. The major snowfall activity ended by early afternoon, and Sunday’s forecast looked milder, he said.
“People will still see snowflakes across much of Minnesota (on Sunday) but it won’t be adding up to anything,” he said.
Jack Serier, a commander with the St. Paul Police Department, said officers dealt with 20 to 30 car accidents by about noon, with many of the collisions involving four or five vehicles. Drivers were being careful, he said, but they were skidding on a glaze of ice that developed under much of the snow pack.
“There was nothing reckless,” he said. “But when they hit that ice, no matter what they tried to do they spun out of control.”
The snow left the football field unusable at Minnesota State-Mankato, prompting the postponement of the school’s game against Minnesota Duluth. School officials and conference administrators were considering their options for rescheduling the game.
The football game between Gustavus Adolphus College and Carleton College was pushed back to 1 p.m. Sunday.
Meteorologists said Ashland and Bayfield counties could get 4 to 6 inches of snow on Sunday, while parts of western and north-central Wisconsin could see about an inch.
The snow in both states wasn’t expected to stick around for long. Recent warm weather meant the ground is still relatively warm, meteorologists said, and temperatures are expected to be in the mid- to high 30s for the next few days. See post here.
ICECAP Note: This region will be hard hit once again with this La Nina the upcoming winter. Update: Hear an interview episode #034 with Andre Bernier of FOX 8 Cleveland on his WeatherJazz site here.
-----------
US Winter Temperatures Dropping At A Rate Of 40 Degrees Per Century
By Steven Goddard, Real Science
Since the start of the millennium, US winter temperatures have been plummeting.
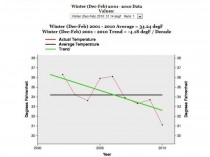
Enlarged here.
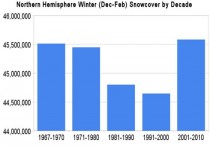
It was also the snowiest decade on record in the Northern Hemisphere.
Enlarged here.
See post here.
Nov 13, 2010
Leaking Underground CO2 Storage Could Contaminate Drinking Water, Study Finds
By Mark Little, New Science
Leaks from carbon dioxide injected deep underground to help fight climate change could bubble up into drinking water aquifers near the surface, driving up levels of contaminants in the water tenfold or more in some places, according to a study by Duke University scientists.
Based on a year-long analysis of core samples from four drinking water aquifers, “We found the potential for contamination is real, but there are ways to avoid or reduce the risk,” says Robert B. Jackson, Nicholas Professor of Global Environmental Change and professor of biology at Duke.
“Geologic criteria that we identified in the study can help identify locations around the country that should be monitored or avoided,” he says. “By no means would all sites be susceptible to problems of water quality.”
The study appears in the online edition of the journal Environmental Science & Technology.
Storing carbon dioxide deep below Earth’s surface, a process known as geosequestration, is part of a suite of new carbon capture and storage (CCS) technologies being developed by governments and industries worldwide to reduce the amount of greenhouse gas emissions entering Earth’s atmosphere. The still-evolving technologies are designed to capture and compress CO2, emissions at their source—typically power plants and other industrial facilities—and transport the CO2 to locations where it can be injected far below the Earth’s surface for long-term storage. The U.S. Department of Energy, working with industry and academia, has begun the planning for at least seven regional CCS projects.
“The fear of drinking water contamination from CO2 leaks is one of several sticking points about CCS and has contributed to local opposition to it,” says Jackson, who directs Duke’s Center on Global Change. “We examined the idea that if CO2 leaked out slowly from deep formations, where might it negatively impact freshwater aquifers near the surface, and why.”
Jackson and his postdoctoral fellow Mark G. Little collected core samples from four freshwater aquifers around the nation that overlie potential CCS sites and incubated the samples in their lab at Duke for a year, with CO2 bubbling through them.
After a year’s exposure to the CO2, analysis of the samples showed that “there are a number of potential sites where CO2 leaks drive contaminants up tenfold or more, in some cases to levels above the maximum contaminant loads set by the EPA for potable water,” Jackson says. Three key factors—solid-phase metal mobility, carbonate buffering capacity and electron exchanges in the overlying freshwater aquifer—were found to influence the risk of drinking water contamination from underground carbon leaks.
The study also identified four markers that scientists can use to test for early warnings of potential carbon dioxide leaks. “Along with changes in carbonate concentration and acidity of the water, concentrations of manganese, iron and calcium could all be used as geochemical markers of a leak, as their concentration increase within two weeks of exposure to CO2,” Jackson says.
The study was funded by the Department of Energy’s National Energy Technology Laboratory and Duke’s Center on Global Change.
Little is now a professional staff member on the U.S. House of Representatives Committee on Foreign Affairs.
Journal Reference: Mark G. Little, Robert B. Jackson. Potential Impacts of Leakage from Deep CO2 Geosequestration on Overlying Freshwater Aquifers. Environmental Science & Technology, 2010; 101029020119075 DOI: 10.1021/es102235w
Nov 12, 2010
Environmentalists ‘exaggerated’ threat to tropical rainforests from global warming
By David Derbyshire
The threat to tropical rainforests from climate change may have been exaggerated by environmentalists, according to a new study.
Researchers have shown that the world’s tropical forests thrived in the far distant past when temperatures were 3 to 5C warmer than today. They believe that a wetter, warmer future may actually boost plants and animals living the tropics. The findings, published in the respected journal Science, come from a study of pollen trapped in rocks during a natural period of global warming 56.3million years ago.
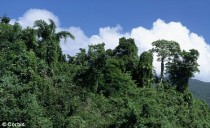
Daintree National Park in Queensland, Australia. The threat to tropical rainforests from climate change ‘has been exaggerated by environmentalists’
The extreme warm spell - called the Paleocene-Eocene Thermal Maximum - saw global temperatures soar by 6C (11F) within a few thousand years. The cause of the PETM is unknown. However, some scientists believe it was triggered by the release of vast amounts of carbon dioxide from volcanic activity over a few thousand years.
The injection of carbon dioxide into the atmosphere set off a spiral of events that warmed the climate and led to even more greenhouse gas entering the atmosphere, they say. Researchers at the Smithsonian Tropical Research Institute in Panama examined pollen trapped in rocks in Colombia and Venezuela before, during and after the PETM.
They found that the amount of plant-life in the forests increased rapidly during the warming event with new plant species evolving much more quickly than the older species became extinct. Pollen from the chocolate family and passionflower plant family were found for the first time.
The researchers believe the hotter, wetter conditions - and additional carbon dioxide in the atmosphere - boosted plant-life and increased biodiversity.

A baby white-faced capuchin rests on a branch with its mother in the tropical rainforest of Manuel Antonio National Park. Researchers believe that a wetter, warmer future may actually boost plants and animals living the tropics
The findings could shed light on man-made global warming caused by the release of carbon dioxide from burning coal and destroying forests. Conservative computer models of climate change suggest the world will warm by at least 2C over the next century.
‘It is remarkable that there is so much concern about the effects of greenhouse conditions on tropical forests,’ said Dr Klaus Winter of the Institute. ‘However, these horror scenarios probably have some validity if increased temperatures lead to more frequent or more severe drought as some of the current predictions for similar scenarios suggest.’ British forest expert Dr Simon Lewis of Leeds University said warmer, wetter weather could boost rain-forests. However, if climate change led to more droughts, it could be disastrous for regions like the Amazon.
In the last five years, the Amazon has experienced two ‘one in a century’ droughts, he said. ‘The 2005 Amazon drought was widely characterised as an unusual 1-in-100 year event, which caused tree deaths leading to rotting trees releasing over four billion tonnes of carbon dioxide,’ he said. ‘And now in 2010, another drought has stuck, which initial analyses show is more extensive than 2005, even though it is only five years later.
‘These droughts are consistent with model projections showing a die-back of the Amazon, further accelerating climate change in a dangerous loop. ‘The new paper is useful, but doesn’t address present-day concerns of drought-impacts that affect the forest itself and the millions of people who live there.’ The speed of modern day man-made climate change was much faster than the global warming of 60 million years ago, he added.
Read more here. Icecap Note: drought is favored in years with low solar and La Ninas. They will occur more frequently in the cold PDO and low solar decade(s) ahead. AGW is not real (except for urban warming) and so has nothing to do with recent events.
Nov 11, 2010
No Cause for Alarm Over Sea Level or Ice Sheets
Professor Cliff Ollier
John Le Mesurier’s recent article in On Line Opinion, ”The Creeping Menace” , re-hashes the alarmism about rising sea levels. Much has happened, however, since Al Gore scared the world with visions of metre high seas flooding New York.
First, there is still no proof the Earth is experiencing “dangerous” warming. Temperatures have levelled off since 1998. Many measuring locations are also located in unsuitable areas. Furthermore, the methodologies of averaging temperature are inconsistent and full of problems. This is why “Global Warming” was replaced as a slogan by “Climate Change” (nobody denies that climate changes), and more recently by “Climate Disruption” (which is impossible define or prove).
Second, the increased temperature is supposed to increase sea level mainly by melting the ice-caps, which is impossible. Thermal expansion of the oceans seems to be of little consequence at present because the satellite measurements show the oceans are cooling. Le Mesurier gilds his picture with a few asides on “extreme climatic events” in general and hurricanes in particular. Recent studies, however, show no increase in hurricane activity in the last 40 years.
With regard to sea level, I have come to the view the IPCC and Australian Bureau of Meteorology, run by CSIRO, are unreliable sources of data after critically assessing their statements on this subject for some time. Direct studies of sea level are showing only small rises. You can see the sea level data for yourself for the United States and a few other countries here. Most stations show a rise of sea level of about 2mm per year, but note the considerable variation even within a single state.
Models depend on what is put into them. For example, a 2009 report by the CSIRO for the Victorian Government’s Future Coasts Program on The Effect of Climate Change on Extreme Sea Levels in Port Phillip Bay based its model on temperature projections to 2100 of up to 6.4 degrees. That is the most extreme, fuel intensive, scenario of the IPCC and implies unbelievable CO2 concentration levels in 2100 of approximately 1550 parts per million (expressed in CO2 equivalent). Usage of all known fossil fuel reserves would only achieve half of this and continuation of the current rate of increase in concentration levels would result in only 550ppm by 2100.
In terms of sea levels, the result is a CSIRO predicted rise for Port Phillip Bay by 2100 of 82cm and, with the help of the Bureau of Meteorology, an increase due to wind to 98cm. That is not only well above even the top level projected by the latest IPCC report but is also well above any projections from the last 20 to 100 years.
Two favourites of sea level alarmists are Tuvalu and the Maldives. Sea level measurements for Tuvalu (and 10 other stations) between 1992 and 2006 are available on Fig. 13 on the Australian Bureau of Meteorology website (PDF 1.97MB). For about the past eight years the sea level seems to be virtually constant. Vincent Gray has reviewed the evidence and finds virtually stable sea levels in the South West Pacific, and he also discusses how the data have been manipulated to suggest rising sea level.
Sea level in the Maldives was studied in enormous detail by the doyen of sea level scientists, Niklas Axel-Mörner. His team determined the sea level curve over the past 5,000 years based on evidence of morphology, stratigraphy, biology and archaeology supported by extensive C14 dating, and found that “All over the Maldives there is evidence of a sub-recent sea level some 20cm higher than the present one. In the 1970s, sea level fell to its present position.”
Incidentally a recent study of coral islands in the Pacific by Webb and Kench showed the islands are actually growing larger despite any possible sea level rise.
Holland is very low and would be particularly vulnerable to any large rise of sea level. It is also a world leader in coastal study and engineering, and the Dutch are not alarmed. In the December 11, 2008, issue of NRC/Handelsblad (Rotterdam’s counterpart to The Australian or The Age) Wilco Hazeleger, a senior scientist in the global climate research group at the Royal Netherlands Meteorological Institute wrote:
In the past century the sea level has risen twenty centimetres. There is no evidence for accelerated sea-level rise. It is my opinion that there is no need for drastic measures. Fortunately, the time rate of climate change is slow compared to the life span of the defense structures along our coast. There is enough time for adaptation.
What about the alleged cause of most of the scary sea level rise - the melting of ice-caps? This idea of rapid loss of ice is based on the concept of an ice sheet sliding down an inclined plane on a base lubricated by meltwater, which is itself increasing because of global warming.
In reality the Greenland and Antarctic ice sheets occupy kilometre-deep basins. If sliding were operative they could only slide into the basin. Virtually all the studies on which alarmist conclusions are based are on the outflowing glaciers around the edges of Greenland where glaciers can flow downhill, and where there is some melting. There is no melting in the interior of ice sheets - it is far too cold.
Glaciers have a budget, with accumulation of snow, conversion to ice, flow of ice, and eventual destruction by melting, ablation or collapse. The centres of the ice sheets, occupying basins, flow only at the base, warmed by geothermal heat and driven by the weight of the overlying ice. There is no direct flow of the near-surface ice in the centre of an ice sheet to the outflow glaciers.
The accumulation of kilometres of undisturbed ice in cores in Greenland and Antarctica show hundreds of thousands of years of accumulation with no gaps in the record caused by melting. The existence of such layers, youngest at the top and oldest at the bottom, enables the glacial ice to be studied through time, a basic source of data on temperature and carbon dioxide in the past.
In the Greenland ice sheet several cores have more than 3km of undisturbed ice which go back in time for over 105,000 years (much less than the Antarctic equivalent). The Vostok cores in Antarctica provide data for the past 414,000 years before the ice starts to be deformed by flow (induced by the weight of the overlying ice and geothermal heat). The Epica core in Antarctica goes back to 760,000 years. The cores show there have been many times when the climate was much warmer than today (e.g. Mediaeval Warm Period). It is fanciful to conclude kilometres of ice can suddenly melt when the records show no melting whatsoever in the ice sheet accumulation areas. After considering the evidence of three quarters of a million years of documented continuous accumulation, how can we rationally accept that right now the world’s ice sheets are collapsing?
The idea of a glacier sliding downhill on a base lubricated by meltwater seemed a good idea when first presented by de Saussure in 1779, but a lot has been learned since then. Not even alpine valley glaciers or the outflow glaciers of Greenland move this way, but by a process called creep, best known from metallurgy. This process explains why the crystals of ice in the snout of a glacier are about a thousand times bigger than the first crystals in the snowfall. Sliding cannot account for this.
Collapse of ice sheets is commonly shown to stir fears of rising sea levels. Yet wherever ice sheets or glaciers reach the sea, the ice floats and eventually breaks off to form icebergs. It is part of the glacial budget: the glaciers never did flow on to the equator. Icebergs have always been with us. Captain Cook saw them on his search for the Great South Land.
Observers frequently seem surprised by the size and suddenness of what they see. In 2007, when a piece of the Greenland ice shelf broke away, the scientists who were interviewed said they were surprised at how suddenly it happened. How else but suddenly would a piece of ice shelf break off? The actual break is inevitably a sudden event - but one that can easily be built into a global warming horror scenario. The point to remember is that the release of icebergs at the edge of an ice cap does not in any way reflect present-day temperature. It takes thousands of years for the ice to move from accumulation area to ice front.
The Hubbard Glacier in Alaska has long been a favourite place for tourists to witness the collapse of an ice front, 10km long and 27m high, sometimes producing icebergs the size of ten-storey buildings. One tourist wrote “Hubbard Glacier is very active and we didn’t have long to wait for it to calve”. Yet the Hubbard Glacier is advancing at 25 metres per year, and has been doing so at least since its discovery in 1895.
Variations in melting or calving around the edges of ice sheets are no indication that they are collapsing, but reflect past rates of snow and ice accumulation in their interior.
Despite alarmist propaganda there is much evidence to suggest that the ice sheets are in good health.
For example, one recent paper is entitled “A doubling in snow accumulation in the western Antarctic Peninsula since 1850” (Thomas et al. 2008).
Another reports that “The East Antarctic ice-sheet north of 81.60S increased in mass by 45 plus/minus 7 billion metric tons per year from 1992 to 2003… enough to slow sea-level rise by 0.12 plus/minus 0.002 millimetres per year” (Davis et al. 2005).
Wingham et al. (2006) wrote: “We show that 72 per cent of the Antarctic ice sheet is gaining 27 ± 29 Gt yr-1, a sink of ocean mass sufficient to lower global sea levels by 0.08 mm yr-1.”
Johannessen and colleagues analysed satellite data on the Greenland Ice Sheet from 1992 to 2003. They found an increase of 6.4 plus/minus 0.2 centimetres per year in the vast interior areas above 1500 metres, in contrast to previous reports of high-elevation balance. Below 1500 metres, the elevation-change rate is -2.0 plus/minus 0.9 cm/year.
Of course even if we believe global sea level is rising, it takes another leap of faith to accept that it is caused by minuscule increases in atmospheric carbon dioxide caused by human activity.
Prof. Cliff Ollier
School of Earth and Environment
University of Western Australia
|

