Sep 22, 2010
Unsustainable cow manure
By Paul Driessen
Seek a sustainable future! Wind, solar and biofuels will ensure an eco-friendly, climate-protecting, planet-saving, sustainable inheritance for our children. Or so we are told by activists and politicians intent on enacting new renewable energy standards, mandates and subsidies during a lame duck session. It may be useful to address some basic issues, before going further down the road to Renewable Utopia.
First, when exactly is something not sustainable? When known deposits (proven reserves) may be depleted in ten years? 50? 100? What if looming depletion results from government policies that forbid access to lands that might contain new deposits - as with US onshore and offshore prospects for oil, gas, coal, uranium, rare earth minerals and other vital resources?
Rising prices, new theories about mineral formation, and improved discovery and extraction technologies and techniques typically expand energy and mineral reserves - postponing depletion by years or decades, as in the case of oil and natural gas. But legislation, regulation, taxation and litigation prevent these processes from working properly, hasten depletion, and make “sustainability” an even more politicized, manipulated and meaningless concept.
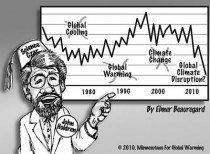
Second, should the quest for mandated “sustainable” technologies be based on real, immediate threats - or will imaginary or exaggerated crises suffice? Dangerous manmade global cooling morphed into dangerous manmade global warming, then into “global climate disruption” - driven by computer models and disaster scenarios, doctored temperature data, manipulated peer reviews, and bogus claims about melting glaciers and rising sea levels. Shouldn’t policies that replace reliable, affordable energy with expensive, intermittent, land-intensive, subsidized sources be based on solid, replicable science?
Enlarged here.
Third, shouldn’t inconvenient sustainability issues be resolved before we proceed any further, by applying the same guidelines to renewable energy as courts, regulators and eco-activists apply to petroleum?
Most oil, gas, coal and uranium operations impact limited acreage for limited times - and affected areas must be restored to natural conditions when production ends. Effects on air and water quality, habitats and protected species are addressed through regulations, lease restrictions and fines. The operations generate vast amounts of affordable, reliable energy from relatively small tracts of land, and substantial revenues.
Wind turbines generate small amounts of expensive, unreliable electricity from gargantuan installations on thousands of acres. Turbines and their associated transmission lines dominate scenic vistas, disrupt habitats and migratory routes, affect water drainage patterns, impede crop dusting and other activities, and kill bats, raptors and other birds, including endangered species that would bring major fines if the corporate killers were oil or mining companies. And yet, wind operators receive exemptions from environmental review, biodiversity and endangered species laws that traditional energy companies must follow - on the ground that such rules would raise costs and delay construction of “eco-friendly” projects.
Kentucky’s Cardinal coal mine alone produces 75% of the Btu energy generated by all the wind turbines and solar panels in the USA, Power Hungry author Robert Bryce calculates. Unspoiled vistas, rural and maritime tranquility, and bald eagles will all be endangered if 20% wind power mandates are enacted.
The Palo Verde Nuclear Power Station near Phoenix generates nearly 900 times more electricity than Nevada’s Nellis Air Force Base photovoltaic panels, on less land, for 1/15 the cost per kWh - and does it 90% of the time, versus 30% of the time for the Nellis array. Generating Palo Verde’s electrical output via Nellis technology would require solar arrays across an area ten times larger than Washington, DC.
Building enough photovoltaic arrays to power greater Los Angeles would mean blanketing thousands of square miles of desert habitat. Once built, solar and wind systems will be there just this side of forever, since there will be no energy production if we let them decay, after shutting down whatever hydrocarbon operations aren’t needed to fuel backup generators that keep wind and solar facilities operational.
Wind and solar power also mean there is a sudden demand for tons of rare earth elements that weren’t terribly important a decade ago. They exist in very low concentrations, require mining and milling massive amounts of rock and ore to get the needed minerals, and thus impose huge ecological impacts.
If mountaintop removal to extract high quality coal at reduced risk to miners is unacceptable and unsustainable - how is it eco-friendly and sustainable to clear-cut mountain vistas for wind turbines? Blanket thousands of square miles with habitat-suffocating solar panels? Or remove mountains of rock to mine low-grade rare earth mineral deposits for solar panel films, hybrid batteries and turbine magnets?
Since any undiscovered US rare earth deposits are likely locked up in wilderness and other restricted land use areas, virtually no exploration or development will take place here. We will thus be dependent on foreign suppliers, like China, which are using them in their own manufacturing operations - and selling us finished wind turbines, solar panels and hybrid car batteries. The United States will thus be dependent on foreign suppliers for renewable energy, just as we rely on foreign countries for oil and uranium.
To claim any of this is ecologically or economically sustainable strains credulity.
Green jobs will mostly be overseas, subsidized by US tax and energy dollars - other people’s money (OPM). Indeed, Americans have already spent over $20 billion in stimulus money on “green” energy projects. However, 80% of the funding for some of them went to China, India, South Korea and Spain, and three-fourth of the turbines for eleven US wind projects were made overseas. This is intolerable, indefensible and unsustainable. But it gets worse.
Denver’s Nature and Science Museum used $720,000 in stimulus money to install photovoltaic panels and reduce its electricity bills by 20 percent. The panels may last 25 years, whereas it will take 110 years to save enough on those bills to pay for the panels - and by then four more sets of panels will be needed.
As to biofuels, the US Navy recently waxed ecstatic over its success with camellia-based eco-fuel in fighter jets. But the PC biofuel costs $67.50 per gallon, versus $5.00 per gallon for commercial jet fuel.
To meet the 36-billion-gallons-a-year-by-2022 federal ethanol diktat, we would have to grow corn on cropland and wildlife habitat the size of Georgia, to get 15 billion gallons of corn-based ethanol - plus switchgrass on farmlands and habitats the size of South Carolina, to produce 21 billion gallons of “advanced biofuel.” By contrast, we could produce 670 billion gallons of oil from frozen tundra equal to 1/20 of Washington, DC, if the Arctic National Wildlife Refuge weren’t off limits.
OPM-subsidized ethanol also means a few corn growers and ethanol refiners make hefty profits. But chicken and beef producers, manufacturers that need corn syrup, and families of all stripes get pounded by soaring costs, to generate a fuel that gets one-third less mileage per tank than gasoline.
Hydrocarbons fueled the most amazing and sustained progress in human history. Rejecting further progress - in the name of sustainability or climate protection - requires solid evidence that we face catastrophes if we don’t switch to “sustainable” alternatives. Computer-generated disaster scenarios and bald assertions by Al Gore, Harry Reid, John Holdren and President Obama just don’t make the grade.
We need to improve energy efficiency and conserve resources. Science and technology will continue the great strides we have made in that regard. Politically motivated mandates will impose huge costs for few benefits. Sustainability claims will simply redistribute smaller shares of a shrinking economic pie.
“Renewable” energy subsidies may sustain the jobs of lobbyists, activists, politicians, bureaucrats and politically connected companies. But they will kill millions of other people’s jobs.
Let’s be sure to remind our elected officials of this along their campaign trails - and on November 2. PDF
Paul Driessen is senior policy advisor for the Committee For A Constructive Tomorrow and Congress of Racial Equality, and author of Eco-Imperialism: Green power - Black death.
Sep 15, 2010
Five Reasons Why Water Vapor Feedback Might Not Be Positive
By Roy W. Spencer, Ph. D.
Since it has been a while since I have addressed water vapor feedback, and I am now getting more questions about it, I thought this would be a good time to revisit the issue and my opinions on the subject.
Positive water vapor feedback is probably the most “certain” and important of the feedbacks in the climate system in the minds of mainstream climate researchers. Weak warming caused by more carbon dioxide will lead to more water vapor in the atmosphere, which will then amplify the weak warming through water vapor’s role as the atmosphere’s primary greenhouse gas.
Positive water vapor feedback makes sense intuitively. Warmer air masses, on average, contain more water vapor. Warmer air is associated with greater surface evaporation rates, which is the ultimate source of almost all atmospheric water vapor.
And since water vapor is the atmosphere’s main greenhouse gas, most scientists have reasonably inferred that climate warming will be enhanced by increasing water vapor amounts. After all, water vapor feedback is positive in all of the IPCC climate models, too.
But when one looks at the details objectively, it is not so obvious that water vapor feedback in the context of long-term climate change is positive. Remember, it’s not the difference between warmer tropical air masses and cooler high-latitude air masses that will determine water vapor feedback...its how those air masses will each change over time in response to more carbon dioxide. Anything that alters precipitation processes during that process can cause either positive or negative water vapor feedback.
Enlarged here.
Here are some of those details.
1) Evaporation versus Precipitation
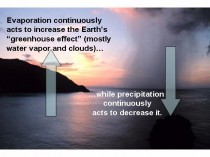
The average amount of water vapor in the atmosphere represents a balance between two competing processes: (1) surface evaporation (the source), and (2) precipitation (the sink). While we know that evaporation increases with temperature, we don’t know very much about how the efficiency of precipitation systems changes with temperature.
The latter process is much more complex than surface evaporation (see Renno et al., 1994), and it is not at all clear that climate models behave realistically in this regard. In fact, the models just “punt” on this issue because our understanding of precipitation systems is just not good enough to put something explicit into the models.
Even cloud resolving models, which can grow individual clouds, have gross approximations and assumptions regarding the precipitation formation process.
2) Negative Water vapor Feedback Can Occur Even with a Water Vapor Increase
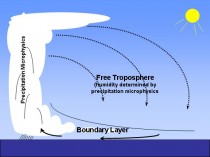
Most atmospheric water vapor resides in the lowest levels, in the ‘turbulent boundary layer’, while the water vapor content of the free troposphere is more closely tied to precipitation processes. But because the outgoing longwave radiation is so much more sensitive to small changes in upper-layer humidity especially at low humidities (e.g. see Spencer & Braswell, 1997), it is possible to have a net increase in total integrated water vapor, but negative water vapor feedback from a small decrease in free-tropospheric humidity. See #4 (below) for observational support for this possibility.
Enlarged here.
3) Cause Versus Effect
Just because we find that unusually warm years have more water vapor in both the boundary layer and free troposphere does not mean that the warming caused the moistening.
There are a variety of processes (e.g. tropospheric wind shear causing changes in precipitation efficiency) which can in turn alter the balance between evaporation and precipitation, which will then cause warming or cooling as a RESULT OF the humidity change - rather than the other way around.
This cause-versus-effect issue has been almost totally ignored in feedback studies, and is analogous to the situation when estimating cloud feedbacks, the subject of our most recent paper.
Similar to our cloud feedback paper, evidence of causation in the opposite direction is the de-correlation between temperature and humidity in the real world versus in climate models (e.g. Sun et al., 2001).
4) Evidence from Radiosondes
There is some evidence that free tropospheric vapor has decreased in recent decades (e.g. the Paltridge et al., 2009 analysis of the NCEP Reanalysis dataset) despite this being a period of surface warming and humidifying in the boundary layer. Miskolczi (2010) used the radiosonde data which provide the main input to the NCEP reanalysis to show that the resulting cooling effect of a decrease in vapor has approximately counterbalanced the warming influence of increasing CO2 over the same period of time, leading to a fairly constant infrared opacity (greenhouse effect).
Of course, water vapor measurements from radiosondes are notoriously unreliable, but one would think that if there was a spurious drying from a humidity sensor problem that it would show up at all altitudes, not just in the free troposphere. The fact that it switches sign right where the turbulent boundary layer pushes up against the free troposphere (around 850 mb, or 5,000 ft.) seems like too much of a coincidence.
5) The Missing “Hot Spot”
Most people don’t realize that the missing tropospheric “hot spot” in satellite temperature trends is potentially related to water vapor feedback. One of the most robust feedback relationships across the IPCC climate models is that those models with the strongest positive water vapor feedback have the strongest negative lapse rate feedback (which is what the “hot spot” would represent). So, the lack of this negative lapse rate feedback signature in the satellite temperature trends could be an indirect indication of little (or even negative) water vapor feedback in nature.
Conclusion
While it seems rather obvious intuitively that a warmer world will have more atmospheric water vapor, and thus positive water vapor feedback, I’ve just listed the first 5 reasons that come to my mind why this might not be the case.
I am not saying that’s what I necessarily believe. I will admit to having waffled on this issue over the years, but that’s because there is evidence on both sides of the debate.
At a minimum, I believe the water vapor feedback issue is more complicated than most mainstream researchers think it is. See post here.
Sep 13, 2010
GISS On Track For Hottest Year Ever
By Steve Goddard
It appears almost certain that GISS will declare 2010 to be the hottest year ever (below, enlarged here).
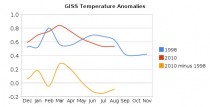
It is also almost certain that UAH, RSS and HadCrut will not agree with GISS. They will most likely place 2010 below 1998 (below, enlarged here).

Dr Hansen has recognized the discrepancy, and explains it by his “better Arctic coverage”
The blink comparator here (still below) shows GISS June-August (baseline 1958-2002) extrapolated (1200 km) vs June-August measured (250 km.) Note the large holes and the fact that there is little or no measured data north of 80N. Also note that GISS shows the region north of 80N as well above normal, despite the paucity of actual temperature data.

By contrast, DMI has a lot more actual temperature data, and shows June-August 2010 (north of 80N) well below the 1958-2002 mean.
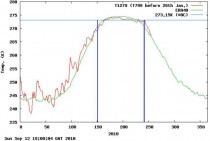
The DMI closeup below (enlarged here) shows 5518 pixels below normal and 1471 pixels above normal from June through August.

So which temperature record do you trust? Is 2010 really the “hottest year ever?”
See post and comments here. See an earlier post on GISS divergence here. See the divergence of GISS from Hadley CRU Temperatures below, enlarged here.
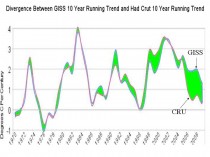
ICECAP NOTE: The many issues with the surface data set like urbanization unaccounted for, bad siting, inappropriate instrumentation, land use changes, station dropout and a tenfold increase in missing months leaving large holes requiring infilling from as much as 1200km away as in this arctic example, changing ocean measurement methods all induce uncertainty and predominantly warm biases. NASA and NOAA allows these to contaminate (warm) recent decades while applying homogenization and other “adjustments” to cool off the prior warm period further ensuring recent high rankings and greater century trends when raw, rural, well sited data shows little trend or even cooling.
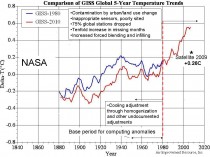
Enlarged here.
Sep 10, 2010
First Look at December to March Global Patterns
By Joseph D’Aleo
Last winter despite a strong El Nino was very cold (all-time coldest in some areas) in many parts of the Northern Hemisphere. A strong La Nina has come on during the summer, a very hot one (all-time in some of the very same areas where the winter was very cold). Other areas had record cool summer. The anomalies were not so much a case of extremes just persistence of the same pattern due to a stuck jet stream configuration.
Persistence is a characteristic of low solar years. The last several years have seen a lot of persistence within seasons. Strong El Ninos and La Ninas also tend to exhibit higher persistence.
What about this winter? Well with a strong La Nina, cold PDO, warm Atlantic (AMO), QBO transitioning to westerly and a still low solar suggests the following.
The 500mb geopotential height anomalies for the globe for December/January:

Enlarged here.
The surface temperature anomalies globally for December/January:
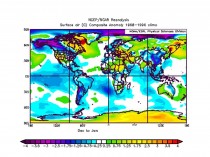
Enlarged here.
The 500 mb geopotential height anomaly for February/March:
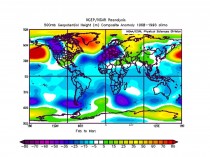
Enlarged here.
The surface temperature anomaly for February/March:
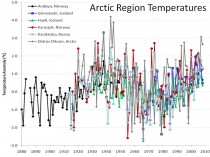
Enlarged here.
The winter (December/January and then February/March) for the United States:
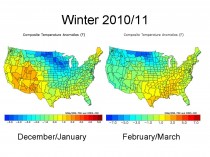
Enlarged here.
For the US, this implies another cold winter for the upper Midwest, probably again heavy snows for the northwest, Rockies, Northern Plains, Midwest and northern New York and New England with ice storm threat(s) further south.
The same for Europe and western Asia:
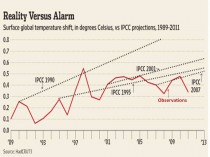
Enlarged here.
This should mean more snow and cold for Great Britain and eventually much of Europe where they are getting used to weather more like the Dalton Minimum with snowy winters and long cold spells.
The winter should start out cold in central and eastern United States, Western Europe and China. A cool summer start seems in the cards for South America. The late winter looks very cold in Europe and western Asia, while the cold retreats west in the United States. Blocking in the Arctic/North Atlantic, last year at a 60 year record level, appears to be again a major factor.
If you ask does this approach work, see how it worked last year when in the fall we predicted this pattern (height anomalies which correspond to surface temperature anomalies) for the winter at 500mb (enlarged here):
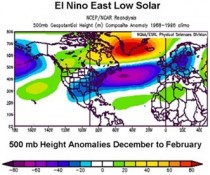
This is what the 500mb anomalies actually looked like (enlarged here):
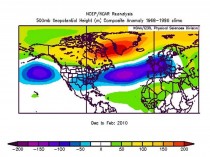
More to come. PDF
See Joe Bastardi’s take on it here. Joe nailed last winters heavy snow and cold in the south up to the Mid-Atlantic.
---------------
Multidecadal Tendencies in ENSO and Global Temperatures Related to Multidecadal Oscillations
Energy & Environment, Volume 21, Numbers 5, pp. 437-460, September 2010, Joseph D’Aleo, Don Easterbrook
Abstract: Perlwitz etal (2009) used computer model suites to contend that the 2008 North American cooling was naturally induced as a result of the continent’s sensitivity to widespread cooling of the tropical (La Nina) and northeastern Pacific sea surface temperatures. But they concluded from their models that warming is likely to resume in coming years and that climate is unlikely to embark upon a prolonged period of cooling. We here show how their models fail to recognize the multidecadal behavior of sea surface temperatures in the Pacific Basin, which determines the frequency of El Ninos and La Ninas and suggests that the cooling will likely continue for several decades. We show how this will be reinforced with multidecadal shift in the Atlantic (and declining solar activity).
See publication here. More to come.
See also Dr. Willie Soon’s Insight on future climate entitled “Hot Air”. He asks is carbon dioxide really the monster driving climate change? If not,
maybe we should prepare for a colder world here.
Sep 06, 2010
Misinformation on the Website Skeptical Science - Getting Skeptical About Global Warming Skepticism
By Roger Pielke Sr.
There is a weblog called “Skeptical Science - Getting Skeptical About Global Warming Skepticism” that has a misleading post on ocean heat content titled
Ocean cooling: skeptic arguments drowned by data
The post starts with
In 2008, climate change sceptic Roger Pielke Sr said this: “Global warming, as diagnosed by upper ocean heat content has not been occurring since 2004”. It is a fine example of denialist spin, making several extraordinary leaps:
•that one symptom is indicative of the state of an entire malaise (e.g. not being short of breath one day means your lung cancer is cured).
•that one can claim significance about a four year period when it’s too short to draw any kind of conclusion
•that global warming has not been occurring on the basis of ocean temperatures alone
So much for the hype. What does the science say about the temperature of the oceans - which, after all, constitute about 70% of the Earth’s surface? The oceans store approximately 80% of all the energy in the Earth’s climate, so ocean temperatures are a key indicator for global warming.
No straight lines
Claims that the ocean has been cooling are correct. Claims that global warming has stopped are not. It is an illogical position: the climate is subject to a lot of natural variability, so the premise that changes should be ‘monotonic’ - temperatures rising in straight lines - ignores the fact that nature doesn’t work like that. This is why scientists normally discuss trends - 30 years or more - so that short term fluctuations can be seen as part of a greater pattern. (Other well-known cyclic phenomena like El Nino and La Nina play a part in these complex interactions).
The post starts by mislabeling me as a “climate change sceptic” and a “denialist”. Not only is this completely incorrect (as can be easily confirmed by reading our article
Pielke Sr., R., K. Beven, G. Brasseur, J. Calvert, M. Chahine, R. Dickerson, D. Entekhabi, E. Foufoula-Georgiou, H. Gupta, V. Gupta, W. Krajewski, E. Philip Krider, W. K.M. Lau, J. McDonnell, W. Rossow, J. Schaake, J. Smith, S. Sorooshian, and E. Wood, 2009: Climate change: The need to consider human forcings besides greenhouse gases. Eos, Vol. 90, No. 45, 10 November 2009, 413. Copyright (2009) American Geophysical Union),
but it sets the tone of their post as an ad hominem attack, rather than a discussion of the issue.
The author of this post documents in the figures that they present, that upper ocean heat, in terms of its annual average, did not accumulate during the period ~2004 through 2009. This means that global warming halted on this time period. There is no other way to spin this data.
The claim in the post (apparently written by Graham Wayne) Does ocean cooling prove global warming has ended? that “The most recent ocean measurements show consistent warming” is false (unless the author of this post has new data since 2009 which may show warming). The recent lack of warming (the data do not support a cooling, despite what the Skeptical Science weblog reports) does not prove or disprove whether global warming over a longer term has ended.
However, the ocean heat content provides the most appropriate metric to diagnosis global warming in recent (since ~2004 when the Argo network became sufficiently dense) and upcoming years, as recommended, of example, in Pielke Sr., R.A., 2008: A broader view of the role of humans in the climate system. Physics Today, 61, Vol. 11, 54-55.
The author of the post on Skeptical Science continues to present misinformation in their Intermediate level post where it is stated: “Early estimates of ocean heat from the Argo showed a cooling bias due to pressure sensor issues. Recent estimates of ocean heat that take this bias into account show continued warming of the upper ocean. This is confirmed by independent estimates of ocean heat as well as more comprehensive measurements of ocean heat down to 2000 metres deep.”
This is an erroneous statement. There was not continued warming for the time period 2004 to 2009, as confirmed by Josh Willis in Pielke Sr., R.A., 2008: A broader view of the role of humans in the climate system. Physics Today, 61, Vol. 11, 54-55. Recently, Josh Willis reported that an updated analysis will be available this Fall.
What the Skeptical Science fails to recognize is that with respect to the diagnosis of global warming using Joules of heat accumulation in the oceans, snapshots of heat content at different times are all that is needed. There is no time lag in heating or cooling. The Joules are either there or they are not. The assessment of a long-term linear trend is not needed.
For example, if the ocean lost its heat in one or two years (such as from a major volcanic eruption), the global warming “clock” would be reset. The Skeptical Science statements that “Claims that the ocean has been cooling are correct. Claims that global warming has stopped are not” illustrates their lack of understanding of the physics. If ocean cooling does occur, it DOES mean global warming as stopped during that time period.
What would be useful is for the weblog Skeptical Science authors to discuss the value of using (and issues with using) the accumulation of Joules in the climate system as the primary metric to monitor global warming. See post here.
ICECAP NOTE: Note how whenever data doesn’t support the models or theory, somehow something must be wrong with it - here they wrongly ascribe the cooling to sensor problems. However, they ignore the many issues with the surface data set like urbanization unaccounted for, bad siting, inappropriate instrumentation, land use changes, changing ocean measurement methods which have much larger errors, inconveniently warm biases.

Enlarged here.
This difference has been growing with time. See the difference of the NOAA global land temperatures and the satellite derived (UAH) temperatures here. They started out about the same in 1979 but now land station data according to NOAA is 0.5C warmer than the satellite when the climate models predict that the satellites which measure the lower troposphere should be warmer than the land because that is where the heat is supposedly trapped by greenhouse gases.
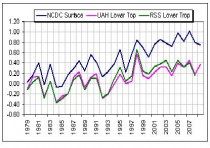
Enlarged here.
While Skeptical Science tries to respond to Roger, maybe they want to explain this additional inconvenient truth.
Also Graham Wayne brings up the need to look at longer periods like 30 years to find trends - decadal trends may be misleading. However, Wayne neglects to note that the PDO and AMO ocean factors both have 30-40 year long regimes with alternating trends. The warm trend from the late 1970s to early 2000s was a warm regime like the 1910s to 1940s. The trend change that started in 2002 that will resume shortly is likely to be a cold trend period like the 1940s to 1970s or if your consider solar more like the early 20th or early 19th century.
|


