Jul 06, 2010
Solar Influences
By Dr. David Whitehouse
In the early 1990’s a paper by Christensen was published that showed a striking correlation between the length of the sun’s sunspot cycle and the global average annual temperature, Fig 1. The shorter the cycle (short cycles are more intense) the higher was the earth’s annual temperature. It seemed to indicate that the sun was the dominant influence on the earth’s temperature variations. Click here to enlarge.
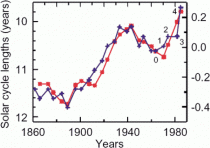
It is certainly striking that since the later part of the 19th century and throughout the 20th century there has been a general increase in the Earth’s global average temperature at the same time that the strength of the solar cycle was increasing in intensity as measured by the number of sunspots. In the last half of the 20th century four out of the five most intense solar cycles occurred (the second largest cycle was around 1780) including the strongest ever which was in the 1950’s.
Christensen linked these two together in what appeared to be a pleasing way. However, a few years after the work was published others found flaws in the way the final four (out of 24) data points were plotted. In Christensen’s paper the length of the solar cycle decreased between 1950 - 1990 with the last data point showing that the cycle length shortened at the same time that the recent global warming period started (post 1980). When this was corrected the concordance between the solar cycle length and the earth’s rising temperature broke down as it became apparent that the length of the solar cycle showed no trend as the earth’s temperature rose post-1980. Fig 2. Click here to enlarge.

It was heralded as proof of the hypothesis that the recent, post-1980 warming spell could not be due to the sun. Whereas many argued that the sun was the dominant factor prior to this period, the rate of warming was recently too great to be accounted for without a human influence. See here and here.
It is now clear that in the past decade or so our sun has been behaving differently from the way it did during the 20th century. The current sunspot minimum has gone on for far longer than was expected. It did begin to show signs of an upturn in activity earlier this year, but has since faltered again. See solar flux below and it and other indices enlarged here. Some have suggested that this is a sign of the start of a new Dalton-like minimum - a period of low solar activity that occurred about 1800.

Since the invention of the telescope and with it the ability to monitor the frequency of sunspots there has been two periods when sunspots were lacking. They are the Dalton Minima, which lasted about 20 years and the much longer Maunder Minimum of approx 1640 -1710. Both periods are coincident with cooler conditions on earth though we do not have a satisfactory explanation for how this occurs. Some believe that the Maunder Minimum can be explained by a combination of a reduction in solar radiation combined with volcanic effects, other are not so sure.
It is interesting to see that as time goes by more and more solar scientists are expressing the possibility that it might be the start of a period similar to the Maunder Minimum. Only time will tell.
The important point is that in previous periods of relatively low solar activity the solar cycle behaved differently than it did when solar activity was stronger.
In broad agreement with the Christensen relationship, during the Dalton Minimum the period of the solar cycle increased. The longest cycle ever recorded was during the Dalton period. Also as sunspot numbers declined at the start of the period the solar cycle became more symmetrical and cycle rise and fall times converged at about 6 years.
The last complete solar cycle, number 23 lasted 12.6 years (May 1996 - Dec 2008). Only four solar cycles have lasted longer than 12 years. Two of them, cycle 4 (1784 - 1798: 13.7 years) and cycle 5 (1798 - 1810: 12.6 years) occurred just before and during the Dalton Minimum.
What’s more cycle 22 was unusually short (Sept 86 - May 1996: 9.7 years). There have been only two other solar cycles that have been shorter, Cycle 2 and cycle 3 which occurred immediately prior to the lengthy cycles of the Dalton Minimum.
Scrutinising the gradient of sunspot cycle rise and falls it is obvious that usually the cycle rise is more rapid than the fall. During the Dalton Minima however they became equal. Then they resumed their normal relationship only to move once more to equality around 1910 when there were a few relatively weaker sunspot cycles. It is possible that the same thing is happening again. If so this would imply an approx 100 year periodicity, though this is only am impression, as we only have reliable sunspot records since about 1750.
It is possible that changes in solar cycle lengths take place before periods of low solar activity, like the one we may be entering at present, and that might influence the later part of figure 1. If this is the case then the breakdown in the Christensen relationship post 1980 cannot be said with certainty to be due to the rise of human influences on the climate above solar ones.
See more here.
Jul 06, 2010
Obama’s deliberate Katrina - Bungling or never letting the crisis go to waste
By Paul Driessen
Back in May, a television news program asked me if I’d tell America the BP oil spill is President Obama’s Katrina. We discussed the spill’s causes, effects and cleanup effort, but I wouldn’t give them the “red meat” they were looking for. So I lost my 15 minutes of national fame.
Since then, it has become obvious that the Katrina analogy is inappropriate. The 2005 hurricane was marked by abject failures by the New Orleans mayor and Louisiana governor, and initially inept responses by FEMA and the Bush administration.
The 2010 oil spill is defined by yeoman’s efforts by Gulf Coast governors - and an Obama administration response that is leagues beyond inept. It is proactively incompetent and obstructionist, as though it is determined not to let this crisis go to waste - but to prolong and intensify the environmental and economic calamity, to advance its political objectives: shutting down offshore leasing and drilling, bringing the US oil industry into the automotive-banking-housing-healthcare sphere of federal control, forcing a massive shift to costly renewable energy, and ramming cap-tax-and-trade through Congress.
How else can anyone explain the litany of bureaucratic decisions that have squandered opportunities to shield beaches, fisheries and estuaries from the expanding slick, before hurricanes hammer cleanup efforts? Ponder this unconscionable malfeasance by the EPA, Corps of Engineers, Interior Department, Fish and Wildlife Service, OSHA, Justice Department, White House and Congress, which:
* Exempted BP from normal environmental reviews, from requirements that BP have viable plans in place and equipment on location to deal with any blowout and spill, and from oversight of its intended removal of drilling muds from the drillstem despite signs of dangerous pressure building in the well.
* Opposed surface and subsurface use of dispersants and rejected offers of dispersants from Britain.
* Compelled crews to employ 4-inch hoses to vacuum up oil by the quart, after President Obama objected that he “can’t suck it up with a straw.” Rejected state-of-the-art skimmers from the Netherlands, because the skimmers send a little oil back into the ocean, while collecting seawater mixed with oil, segregating the oil and discharging the water. (EPA demands that any water discharged from the skimmer be 99.99% oil-free. In other words, it demands that all the oil be left in the ocean, to be driven onto beaches and into sensitive estuaries - rather than permitting ships to collect 95% of the oil, and discharge the rest.)
* Rejected other state-of-the-art vessels, because the Jones Act prohibits the use of even specialized foreign crews in US waters. All together, says the State Department, the feds have rejected 21 offers of help from 17 different nations. (The president could waive the Jones Act, as President Bush did after Katrina, but apparently doesn’t want to offend his union allies.)
* Stands poised to reject help from the Taiwanese tanker-turned-skimmer, “A Whale,” which is now steaming toward the Gulf, to aid the cleanup - on the same bogus Jones Act and “pollution” grounds.
* Refused to allow the building of berms, because dredge and fill operations might cause environmental impacts - as though the massive intrusion of oil into marshlands would have no effect on wildlife.
* Forced Alabama to remove barriers it had installed to protect the state’s beaches, and move them to Louisiana waters.
* Appointed a scientific advisory board to assess the spill response - then falsely claimed the panel had approved the imposition of a drilling moratorium that was actually added to its recommended actions only after the scientists had signed off on the proposed plan. The drilling ban’s severe impacts on Gulf state employment and revenues were ignored by Interior and the White House, which likewise ignored a Federal District Court order to lift the moratorium until the matter could be fully adjudicated.
* Instead of coordinating an effective cleanup, appointed an oil spill investigation panel that includes the dean of the Harvard Engineering School, a former EPA administrator, the head of an anti-drilling environmental activist group, an anti-oil former US senator, and three others. Not one has actual expertise or experience in drilling or oil spill cleanup.
* Threatened criminal prosecutions, thereby chilling witness discussions and testimony, rather than working to learn what precisely went wrong on April 27 and coordinate a successful cleanup effort.
* Held congressional inquisition hearings, to grandstand, browbeat industry officials, and gloss over MMS regulatory and oversight failures - long before a factual investigation could be completed into the accident and response to it, and amid threats of criminal prosecution for anything witnesses might say.
To top it off, in the face of an environmental catastrophe largely perpetrated and perpetuated by a deliberately incompetent and intransigent federal government, rabidly anti-drilling Congressmen Waxman, Markey and Stupak have now introduced HR 5626, the Blowout Prevention Act. The bill requires that any company seeking a drilling permit must first guarantee that it could prevent any future blowouts; promptly stop any blowout, even if the blowout preventers and other measures fail; and drill a relief well within 90 days of any blowout.
This “domestic oil production prohibition” bill sets safety standards that are as impossible to meet, as requiring that all oil tankers prove they will never have an accident, even if they are forced to negotiate the obstacle courses that these same legislators intend to create off our shores, by installing thousands of wind turbines along our coasts. In conjunction with other anti-drilling initiatives, the bill would greatly increase the number of tankers coming to the United States with crude oil and refined products - thus increasing the number of major tanker accidents.
Even a six-month moratorium could cost 20,000-30,000 jobs in the Gulf Region. If HR 5626 and other measures are implemented, the ban could easily become permanent - destroying hundreds of thousands of jobs. Once the big rigs leave, most won’t be back for years, as they will be in high demand in counties that do want to drill. Meanwhile China, Cuba and other countries will be drilling in our backyard, off Florida for example, using their rules and technologies, tapping into US reservoirs, and threatening our coasts.
Anyone who’s read my book, Eco-Imperialism: Green Power / Black Death, knows I am no fan of BP. It screwed up big time in the Gulf, cutting corners and failing to respond properly to tests and other signs of trouble downhole, further compounding its awful environmental and workplace safety record.
However, there is simply no justification for these actions by the Obama administration and Democrat Congress, which seem determined to magnify the crisis - to further hobble the nation’s oil and gas industry and the countless companies, workers, families, hospitals, schools and charities that depend on it. Indeed, America runs on reliable, affordable petroleum fuels for almost two-thirds of all the energy we consume. It counts on offshore oil for millions of jobs and billions in royalty and tax revenues.
Enough is enough. The Gulf States must take control of their energy, economic and environmental future. In the long term, this means conducting complete investigations into corporate and government failures - and imposing civil and criminal penalties for misfeasance and malfeasance, as appropriate.
In the near term, the Gulf States should make it clear that these are their beaches, estuaries, coastal waters, jobs and revenues - and they will no longer tolerate the abject failures that have defined the authoritarian federal takeover of this oil spill response effort.
The states have a right, and a duty, to make decisions about booms, berms, skimmers and every other aspect of the cleanup - based on what their experts advise, and perhaps regardless of what the EPA, Coast Guard or other federal agencies might say. Only then will this nightmare be brought to an end.
Jul 05, 2010
China’s 2,000 Year Temperature History
World Climate Report
We constantly hear that the warmest years on record have all occurred in the most recent decades, and of course, we are led to believe this must be a result of the ongoing buildup of greenhouse gases. In most places, we have approximately 100 years of reliable temperature records, and we wonder if the warmth of the most recent decades is unusual, part of some cyclical behavior of the climate system, or a warm-up on the heels of a cold period at the beginning of the record. A recent article in Geophysical Research Letters has an intriguing title suggesting a 2,000 year temperature record now exists for China - we definitely wanted to see these results of this one.
The article was authored by six scientists with the Chinese Academy of Sciences in Beijing, the State University of New York at Albany, and Germany’s Justus-Liebig University in Giessen; the research was funded by the Chinese Academy of Sciences, National Natural Science Foundation of China, and the United States Department of Energy. In their abstract, Ge et al. tell us “The analysis also indicates that the warming during the 10-14th centuries in some regions might be comparable in magnitude to the warming of the last few decades of the 20th century.” From the outset, we knew we would welcome the results from any long-term reconstruction of regional temperatures.
The authors begin noting that “The knowledge of past climate can improve our understanding of natural climate variability and also help address the question of whether modern climate change is unprecedented in a long-term context.” We agree! Ge et al. explain that “Over the recent past, regional proxy temperature series with lengths of 500-2000 years from China have been reconstructed using tree rings with 1-3 year temporal resolution, annually resolved stalagmites, decadally resolved ice-core information, historical documents with temporal resolution of 10-30 years, and lake sediments resolving decadal to century time scales.” However, the authors caution “these published proxy-based reconstructions are subject to uncertainties mainly due to dating, proxy interpretation to climatic parameters, spatial representation, calibration of proxy data during the reconstruction procedure, and available sample numbers.”
Ge et al. used a series of multivariate statistical techniques to combine information from the various proxy methods, and the results included the reconstruction of regional temperatures and an estimate of uncertainty for any given year. They also analyzed temperature records from throughout China over the 1961 to 2007 period and established five major climate divisions in the country (Figure 1 -enlarged here).

Figure 1. Types, lengths, and locations of proxy temperature series and observation used in the Ge et al. study. The five climate regions were based on a “factor analysis” of the 1961-2007 instrumental measurements. Grey shading indicates elevation (from Ge et al., 2010).
The bottom line for this one can be found in our Figure 2 that shows the centennially-smoothed temperature reconstruction for the five regions of China. With respect to the Northeast, Ge et al. comment “During the last 500 years, apparent climate fluctuations were experienced, including two cold phases from the 1470s to the 1710s and the 1790s to the 1860s, two warm phases from the 1720s to the 1780s, and after the 1870s. The temperature variations prior to the 1500s show two anomalous warm peaks, around 300 and between approximately 1100 and 1200, that exceed the warm level of the last decades of the 20th century.” The plot for the Northeast shows warming in the 20th century, but it appears largely to be somewhat of a recovery from an unusually cold period from 1800 to 1870. Furthermore, the plot shows that the recent warming is less than warming that has occurred in the past.
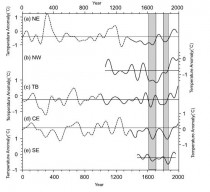
Figure 2 (enlarged here). Five regionally coherent temperature reconstructions with 100-year resolution; the dashed line is the part with fewer series used; and the solid line is the mean value. The shaded areas are the two coldest periods, during the 1620s-1710s and 1800s-1860s (from Ge et al., 2010).
The Central East region also has a 2,000 year reconstruction and Ge et al. state “The 500-year regional coherent temperature series shows temperature amplitude between the coldest and warmest decade of 1.8C. Three extended warm periods were prevalent in 1470s-1610s, 1700s-1780s, and after 1900s. It is evident that the late 20th century warming stands out during the past 500 years. Considering the past 2000 years, the winter half-year temperature series indicate that the three warm peaks (690s-710s, 1080s-1100s and 1230s-1250s), have comparable high temperatures to the last decades of the 20th century.” No kidding - the plot for the Central East region shows that the warmth of the late 20th century was exceeded several times in the past.
Commenting on the Tibet reconstruction, Ge et al. state “The warming period of twenty decadal time steps between the 600s and 800s is comparable to the late 20th century.” In the Northwest, they note “Comparable warm conditions in the late of 20th century are also found around the decade 1100s.” Unfortunately, no long-term reconstruction was possible for the Southeast region.
In summarizing their work, Ge et al. report :
From Figure 3 [our Figure 2 -eds.] , the warming level in the last decades of the 20th century is unprecedented compared with the recent 500 years. However, comparing with the temperature variation over the past 2000 years, the warming during the last decades of the 20th century is only apparent in the TB region, where no other comparable warming peak occurred. For the regions of NE and CE, the warming peaks during 900s-1300s are higher than that of the late 20th century, though connected with relatively large uncertainties.
We get the message - the recent warming in at least several regions in China has likely been exceeded in the past millennium or two, the rate of recent warming was not unusual, and the observed warming of the 20th century comes after an exceptionally cold period in the 1800s.
Declaring that anthropogenic greenhouse gas emissions have pushed modern temperature beyond their historical counterparts disregards the lessons of 2,000 years of Chinese temperatures.
Reference: Ge, Q.-S., J.Y. Zheng, Z.-X. Hao, X.-M. Shao, W.-C. Wang, and J. Luterbacher. 2010. Temperature variation through 2000 years in China: An uncertainty analysis of reconstruction and regional difference. Geophysical Research Letters, 37, L03703, doi:10.1029/2009GL041281.
See posthere.
Jul 03, 2010
A few humans make Victoria much warmer
By Andrew Bolt
Retired school principal Kenskingdom was alarmed by this Bureau of Meterology graph, showing a strong warming trend for Victoria (enlargeed here):
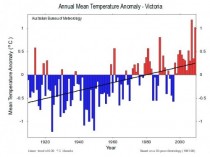
He checked the data from which the trend, and found it had first been adjusted and turned into “high quality” data. As a BOM spokesman assured him:
On the issue of adjustments you find that these have a near zero impact on the all Australian temperature because these tend to be equally positive and negative across the network (as would be expected given they are adjustments for random station changes).
Actually, no, though. You see, Kenskingdom discovered that the adjustments served to exaggerate Victoria’s warming remarkably (enlarged here)
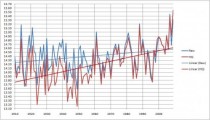
Kenskingdom goes through the individual stations for you and concludes:
There is a distinct warming trend in Victoria since the 1960s, which has been especially marked in the last 15 years.
The first half of the record shows a cooling trend. BOM’s adjustments have attempted to remove this.
2007, not 2009, was the warmest year in the past 100 years.
Three stations identified as urban in 1996 have been included.
Many stations’ data have been arbitrarily adjusted to cool earlier years
Only one station has had its trend reduced. Two are essentially unchanged.
Ten of Victoria’s 13 stations have been adjusted to increase the warming trend, to the extent that there is a warming bias of at least 133%, more likely 143%.
These adjustments, and the Australian temperature record to which they contribute, are plainly not to be trusted.
UPDATE
More climate wisdom from the Bureau of Metereology:
Melbourne has experienced its wettest June in nine years, recording 59 millimetres of rain, 10 millimetres more than the long term average…
But despite the damper conditions, the Bureau of Meteorology says there’s no end in sight to the drought.
The heavy June rain was, once again, not quite what the warmist BOM predicted back in March:
Contrasting this, the chances are between 30 and 40% for above average June quarter falls in an area encompassing much of central to southeastern SA, northwest Victoria and the far southwest corner of NSW. Across the rest (and most) of the country, the chances of exceeding the median April to June rainfall are between 40 and 60%, meaning that above average falls are about as equally likely as below average falls.
UPDATE 2
Weather is not climate, which is worth remembering when you hear the next screams of “global warming” on a hot day:
Sydney’s week of cold weather continues, with the city recording its coldest June morning since 1949 when temperatures dived to 4.3 degrees. (Thanks to reader Professor Frank.)
See Andrew’s blog post here.
Jun 30, 2010
Salazar’s Ban Is Soros’ Bonanza
IBD
Energy Policy: Our interior secretary plans to reinstate the offshore drilling moratorium struck down by a federal judge. But if deep-water drilling is so unsafe, why are we helping Brazil drill nearly three times as deep?
Maybe Secretary Ken Salazar can explain why Britain and others can safely drill in the North Sea and no other nation has suspended its offshore drilling. Yet there he was Tuesday saying he’ll reissue a reworded moratorium that will make it clear to dunces like U.S. District Judge Martin Feldman why offshore drilling is unsafe.
As with health care reform and other issues, the administration’s position is that we didn’t make it clear enough, so we will speak slower and use smaller words. But double talk is double talk no matter how you rearrange the words.
“The decision to impose a moratorium on deep-water drilling was and is the right decision,” Salazar said, even after he was caught rewording a report so a team of experts he assembled would look like they supported the moratorium, when in fact, they adamantly opposed it and thought it would do more harm than the Deepwater Horizon spill itself.
“If some drilling equipment parts are flawed, is it rational to say all are?” Feldman asked in his ruling. “Are all airplanes a danger because one was? All oil tankers like Exxon Valdez? All trains? All mines?
“That sort of thinking seems heavy-handed, and rather overbearing.” Not for an administration and its environmentalist supporters whose collective goal is not to drill safely, but to drill not at all, at least not here.
Last August, the U.S. Export-Import Bank issued a “preliminary commitment” letter to Brazil’s state-run Petrobras in the amount of $2 billion, with the promise of more to follow. Why are we lending billions to a foreign oil company that made $15 billion last year?
These taxpayer dollars finance exploration of the huge offshore discovery in Brazil’s Tupi oil field in the Santos Basin near Rio de Janeiro. Apparently there are no pristine beaches full of tourists there. Someday we may be importing that oil we’re helping Brazil get at.
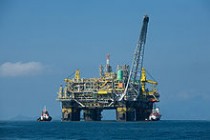
Has that letter been rescinded as part of the moratorium? Why are Brazil’s offshore fields safe but ours aren’t?
The irony is that most of the deep-water rigs idled by the moratorium may shortly be snapped up by a Petrobras apparently undeterred by images of tar balls on Rio’s beaches. Petrobras plans to drill to a depth of 14,022 feet, a depth that makes our 500-foot limit laughable. Brazil is going big-game hunting, and we’re stuck in the petting zoo.
A recent study by Science Applications International Corp. shows that failure to exploit our domestic and offshore resources translates into some $2.3 trillion in lost opportunity costs for the U.S. economy over the next two decades. The American Petroleum Institute estimates that exploiting these resources would generate nearly 160,000 well-paying jobs and $1.7 trillion in federal, state and local revenues, with $1.3 trillion from offshore drilling alone.
If the moratorium stands and energy prices rise, the only ones to profit will be foreign-owned companies such as Petrobras and investors such as George Soros, who has an investment in the oil giant in the neighborhood of $900 million. Yes, the same George Soros who also is a major investor in the Democratic Party and President Obama’s 2008 campaign.
Soros would love to see domestic offshore drilling shut down and those three dozen deep-water rigs sitting idle shipped off to the coast of Brazil. He has a huge investment in both Petrobras and the Democrats. He expects a return on all his investments.
While we track the trail of oil gushing from Deepwater Horizon, we should also follow the money that will be gushing into George Soros’ bank account, courtesy of the U.S. government and the American taxpayer. Read post here.
|


