Anyone who denies global warming is in the pay of big oil. Remember that is what the big man, Al Gore, said in his movie ‘An Inconvenient Truth’. But like so much that Mr Gore says, it just isn’t true.
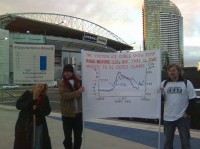
The above photograph (enlarged here), via Leon Ashby, shows demonstrators at Dockland Peninsula this morning.
Consider the 30-odd protesters who held placards outside the breakfast he spoke at this morning in Melbourne. The scruffy-lot, lead by a farmer Leon Ashby, were not there because someone paid them, but because they are outraged by Al Gore and what he has thrust on the world. In particular, his belief that we already have a climate crisis and that the only solution is carbon trading.
It might also sound well meaning. But it is going to be expensive. Indeed, quoting Ronald Bailey from Reason magazine, cap and trade in the US will be the largest corporate welfare program ever enacted in the history of the United States. And the corporations hope government is just as generous to them here in Australia.
Indeed if there were any in the pay of big oil at Dockland Peninsula this morning, they would have been inside applauding the big man.
Has the big end of town ever taken to holding placards? I don’t think so.
A protest like the one in Melbourne this morning was about the seemingly disempowered and disenfranchised attempting to be heard. Of course history is replete with stories of such groups finding their voice and a crowd - eventually. See post here.
James Delingpole talks to Professor Ian Plimer, the Australian geologist, whose new book shows that ‘anthropogenic global warming’ is a dangerous, ruinously expensive fiction, a ‘first-world luxury’ with no basis in scientific fact. Shame on the publishers who rejected the book
Imagine how wonderful the world would be if man-made global warming were just a figment of Al Gore’s imagination. No more ugly wind farms to darken our sunlit uplands. No more whopping electricity bills, artificially inflated by EU-imposed carbon taxes. No longer any need to treat each warm, sunny day as though it were some terrible harbinger of ecological doom. And definitely no need for the $7.4 trillion cap and trade (carbon-trading) bill - the largest tax in American history - which President Obama and his cohorts are so assiduously trying to impose on the US economy.
Imagine no more, for your fairy godmother is here. His name is Ian Plimer, Professor of Mining Geology at Adelaide University, and he has recently published the landmark book Heaven And Earth, which is going to change forever the way we think about climate change.
‘The hypothesis that human activity can create global warming is extraordinary because it is contrary to validated knowledge from solar physics, astronomy, history, archaeology and geology,’ says Plimer, and while his thesis is not new, you’re unlikely to have heard it expressed with quite such vigour, certitude or wide-ranging scientific authority. Where fellow sceptics like Bjorn Lomborg or Lord Lawson of Blaby are prepared cautiously to endorse the International Panel on Climate Change’s (IPCC) more modest predictions, Plimer will cede no ground whatsoever. Anthropogenic global warming (AGW) theory, he argues, is the biggest, most dangerous and ruinously expensive con trick in history.
To find out why, let’s meet the good professor. He’s a tanned, rugged, white-haired sixtysomething - courteous and jolly but combative when he needs to be - glowing with the health of a man who spends half his life on field expeditions to Iran, Turkey and his beloved Outback. And he’s sitting in my garden drinking tea on exactly the kind of day the likes of the Guardian’s George Monbiot would probably like to ban. A lovely warm sunny one.
What Heaven And Earth sets out to do is restore a sense of scientific perspective to a debate which has been hijacked by ‘politicians, environmental activists and opportunists’. It points out, for example, that polar ice has been present on earth for less than 20 per cent of geological time; that extinctions of life are normal; that climate changes are cyclical and random; that the CO2 in the atmosphere - to which human activity contributes the tiniest fraction - is only 0.001 per cent of the total CO2 held in the oceans, surface rocks, air, soils and life; that CO2 is not a pollutant but a plant food; that the earth’s warmer periods - such as when the Romans grew grapes and citrus trees as far north as Hadrian’s Wall - were times of wealth and plenty.
All this is scientific fact - which is more than you can say for any of the computer models turning out doomsday scenarios about inexorably rising temperatures, sinking islands and collapsing ice shelves. Plimer doesn’t trust them because they seem to have little if any basis in observed reality.
WASHINGTON, D.C. U.S. Rep. Blaine Luetkemeyer (MO-9) today introduced legislation that would save taxpayers $12.5 million this year and millions more in the future by prohibiting the United States from contributing to the United Nations Intergovernmental Panel on Climate Change (IPCC), which is fraught with waste and is engaged in dubious science.
“We all know that the UN is incompetent when it comes to spending money, and that is why American taxpayers should not be forking over millions more to one of its organizations that not only is in need of significant reform but is engaged in dubious scientific quests,” Luetkemeyer said. “Folks in Missouri and across the country are tired of this never ending government spending spree, and my goal is to deliver some of our people’s hard-earned money back into their pocketbooks instead of spending it on international junk science.”
Luetkemeyer’s legislation would prohibit U.S. contributions to the IPCC, which is nothing more than a group of U.N. bureaucrats that supports man-made claims on global warming that many scientists disagree with. More than 700 international scientists signed on to the U.S. Senate Minority Report expressing their concerns about man-made claims on global warming promoted by the UN IPCC. The dissenting scientists are more than 13 times the number of UN scientists, 52, who authored a report claiming that human emissions of carbon dioxide are responsible for dangerous and unprecedented warming. The dissenting scientists are from all over the world, including Japan, Italy, UK, Czech Republic, Canada, the Netherlands and the U.S. that are affiliated with institutions including, NASA, U.S. Navy, U.S. Defense Department, Energy Department, U.S. Air Force and the EPA.
Meanwhile, our very own Environmental Protection Agency recently reported that we are undergoing a period of worldwide cooling. Luetkemeyer also filed the legislation as an amendment to the Department of State, Foreign Operations and Related Programs Appropriations Act. Supporters of the cap-and-trade legislation are using the questionable findings by the UN IPCC as one reason to support the onerous legislation, which is nothing more than a national energy tax and will be debated soon by the U.S. Senate. Luetkemeyer voted against this legislation and will continue to voice his concerns with the majority’s cap-and-tax legislation. Read more here.
Here is an idea that makes sense. Next we can cut the billions the administration wants to spend on super computers and climate change research which has led us down all the wrong paths. We can put that money to better use on tapping into the many energy sources at our disposal that will help us become more energy independent and propel economic growth.
Icecap Note: First let me set the stage, New Zealand has had two very snowy and cold winters, and this winter started out with record cold and early snow in May and a cold June (here). New Zealand is in denial of the on-going climate reversal and like most countries has bought into man-made global warming and is considering 2020 emission targets.
This account is from a New Zealand Scientist, Bryan Leyland, a New Zealand based Consulting Engineer specialising in hydropower, power systems and markets. It illustrates how this movement will not give up without a fight. In fact they think they have won the science or at least have succeeded in fooling the populace and are pressing to achieve their goals of controlling the rest of us at the expense of our quality of life and livelihoods.
“Last night I had the unpleasant experience of being present at a public meeting called by Nick Smith the Minister for climate change issues to discuss New Zealand’s 2020 emissions target. In the flyer it says “our target needs to be realistic so that we do not put our economy at risk or damage a good international reputation by failing to deliver. It must also be sufficient to protect the environment and associated economic and social benefits into the future.”
The meeting was at the Hyatt Regency ballroom. There would have been at least 300 people there. I would say that 90+ percent were convinced global warmers and at least 70% had been herded there by Greenpeace. Many of them had large posters with “40% by 2020 and on them. They were properly printed and cased in plastic. They would have cost several dollars each and I suspect that Greenpeace had been handing them out as people came into the hall. They must have invested several thousand dollars in this alone.
The whole show bore a strong resemblance to a “salvation circus”. There was a lot of “We have sinned! We must repent!” Hard science, evidence and economic realities did not come into it. But there were Godlike references to the IPCC! The meeting started off with a presentation by Nick Smith that included the usual IPCC curves and the like. He made it very clear that he was totally convinced that man-made global warming was real and dangerous and something had to be done. But he also accepted that there were major problems as a result of the economic damage that might be done. However, he did quote a recent—and discredited—report that claims that the economic damage would be relatively minor.
He said the government would soon bring in an amendment to the emissions trading scheme. He made (as I recall) absolutely no mention of the select committee process and certainly no mention of the need to wait for the outcome of this process. He frequently referred to “carbon pollution” and mentioned the fact that we had to be sure of the science. He also mentioned that he had had dinner that evening with Jim Salinger who was present in the room.
The chairman was Mike Lee of the Auckland regional Council. He made a short speech in which he made it absolutely clear that he had bought into the global warming religion. He made particular mention of the presence of Jim Salinger, Graeme Easte (Councillor) and Tariana Turia the co-leader of the Green party. I think he also mentioned the leader of Greenpeace who was in the same row as me sitting alongside Jim Salinger. All got great applause.
A third person who, I think, was involved in negotiations (it was not Tim Groser) also spoke briefly and then the floor was opened for questions. Mike Lee asked people make their presentations brief and stick to the question—“what should we do”. He then let the first speaker ramble on for more than five minutes. The second speaker was from Oxfam she rambled on for another five minutes and talked about the poor Cateret islanders who were sinking beneath rising seas levels and the fact that a recent floods in Bangladesh had killed hundreds of thousands of people. (I have worked in Bangladesh. The Brahmaputra floods regularly and the more people there are the more get drowned in a flood. But it is also true that the land area of Bangladesh is increasing—due to silt building new islands).
I was next in line to speak and I started off by pointing out that I was part owner of a small hydro scheme and so, unlike many people in this room, I was speaking against my own financial interests. (this was aimed at the Green party who have invested in wind farms - and many others In the room.) I then asked Nick Smith whether or not he would be taking scientific advice from a wide range of scientific views. He said that the National party relied entirely on the IPCC for their scientific advice as they were the ones who knew it all (or words to that effect). This was news to me! I tried to continue but Mike Lee handed over to the next one in line. I protested loudly and Nick Smith came to my rescue.
I then pointed out that the Carteret Islands were sinking due to tectonic plate movement and the woman from Oxfam’s statement was typical of the misuse of science associated with global warming. I then went on to say that surely the only sensible policy was to take note of the fact that the world was cooling and we did not know whether or not it would warm or cool. But according to the Sun spots and the Pacific decadal oscillation, continued cooling was more likely than a return to warming and we knew that cooling would be seriously bad for the world. Therefore the government should stick to the line that no action will be taken until and if the warming trend restarts and it is firmly associated with man-made greenhouse gases. This went down like a lead balloon.
The next speaker was Jim Salinger who started off by making very disparaging remarks about me—he called me a denier and several other things. I protested and and asked him not to resort to personal attacks. Mike Lee attacked me. He said I had accused him of being a “balanced”. That was not true—what I’d actually done was shake his hand and told him that Stalin would have been proud of a speech that he had made advocating that people’s right to live where they liked should be taken away from them by the planners. I’m sure that Stalin would have been pleased with that - as he would have been with Mike’s attempt to stop me finishing what I had to say. All the remaining speakers ranted on—and that is a fair description—about various subjects. One or to were definitely in a religious mode. Many of them quoted the mantra “40% by 2020” and, for as long as I stayed, none of them made any constructive attempts to answer Nick Smith’s questions. In spite of some weak kneed pleas from Mike Lee, all of them ran over the two or three minutes he had requested as a limit and he made only the feeblest of attempts to stop them. I would have expected that a man in his position would have been an competent chairman. He was not. The meeting was supposed to stop at 9 PM but by 9:30 PM there was still a good 10 speakers lined up waiting to speak so I walked out in disgust.
As a way of getting public feedback it was a total failure. As I said before, it was a gift to the Green party and Greenpeace - at our expense. It also confirmed my belief that Greenpeace, the Green party and others see this as a wonderful attempt to destroy our economy and gain power over the people who refuse to swallow their nonsense. They made an impressive job of making their presence felt and intimidating any other people who may have been inclined to speak up.”
The boys in green are coming as the Environment Agency sets up a squad to police companies generating excessive CO2 emissions.
The agency is creating a unit of about 50 auditors and inspectors, complete with warrant cards and the power to search company premises to enforce the Carbon Reduction Commitment (CRC), which comes into effect next year.
Decked out in green jackets, the enforcers will be able to demand access to company property, view power meters, call up electricity and gas bills and examine carbon-trading records for an estimated 6,000 British businesses. Ed Mitchell, head of business performance and regulation at the Environment Agency, said the squad would help to bring emissions under control. “Climate change and CO2 are the world’s biggest issues right now. The Carbon Reduction Commitment is one of the ways in which Britain is responding.”
The formation of the green police overcomes a psychological hurdle in the battle against climate change. Ministers have long recognised the need to have new categories of taxes and criminal offences for CO2 emissions, but fear a repetition of the fuel tax protests in 2000 when lorry drivers blockaded refineries.
The central unit, based in Warrington, Cheshire, can call on the agency’s national network of hundreds of pollution inspectors, many of whom will soon be trained in CO2 monitoring.
It will also be able to demand energy bills from utilities without the companies under investigation knowing they are being watched. Perhaps most worrying for managers will be the publication of an annual league table ranking companies by performance in cutting emissions. The government hopes the potential shame of a lowly placing will drive organisations to greater energy efficiency.
Mitchell predicted the unit would audit about 1,200 businesses a year. The first stage would be a desk study of their energy bills and activities, followed by a visit when numbers do not add up. “The inspectors will carry warrant cards giving them powers of entry to collect evidence. We will also have access to company accounts with suppliers,” he said. Read more here.
Also in this New York Times Story, The Big Four of Accounting Will Be Among the Big Winners if U.S. Adopts Climate Law. Having helped companies explore the labyrinth of greenhouse gas regulation in Europe, the Big Four auditing and accounting firms are now moving quickly to build climate and carbon shops in the United States. Their goal is to stake claim to a business that could one day rival tax compliance and financial disclosure in size and scope.
Deloitte Touche Tohmatsu, Ernst & Young, KPMG and PricewaterhouseCoopers are the undisputed giants of the auditing, tax advisory and business consulting world. They boast a client list that includes thousands of the biggest names in the corporate world.
The four are already well-known in Europe for their carbon footprint accounting, abatement strategy consulting and emissions disclosure services as industries on the other side of the Atlantic are forced to comply with the European Union’s Emission Trading Scheme (ETS), but so far, their presence in America’s nascent carbon market has barely been recognized.
But that’s about to change. All four firms are in the midst of shifting experienced staff from places such as London and Copenhagen to New York and Washington.
Icecap Note: This is a frightening look into our future under a Waxman Markey Cap-and Tax legislation or EPA regulation. We have to stop them NOW. The last time we had green police was in Nazi, Germany. It is the height of irony that Al Gore likened this battle against global warming to the battle AGAINST the Nazi’s. The British should rebel against this assault on reason and their freedoms Temperatures have been cooling globally for 8 years, have not risen since 1995. This together with the cooling from the 1940s to the late 1970s acquits CO2 from any involvement in climate change. They should throw the politicians pushing this and the crazed greenies and all the profiteers out.


