Sep 03, 2012
Monckton: Climate ($$$ and) change. The AMS Archdruids pray for grants!
As told to Christopher Monckton of Brenchley

The following is an AMS Disinformation Statement calculated to provide an untrustworthy, prejudiced, and scientifically-outdated misrepresentation of pseudo-scientific issues of great concern to us in getting more grants but of no concern to those of the public still at large.
Background
This statement provides a brief overview of why we want more money now, and why we will continue to want more money in the future. It is based on a highly-partisan selection from the scientific literature, presented as though science were based upon the ancient logical fallacy of argument from “consensus”, and further distorted by the bureaucrats of the Mental Panel on Climate Change, the US Notional Academy of Science and Television Arts, and the US Global Cash Recoupment Program.
How is our funding changing?
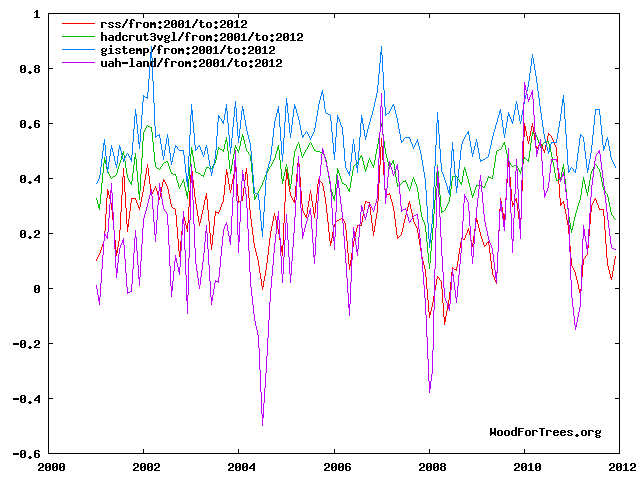
Well, every summer solstice we all dress up in dustsheets and go to Stonehenge to pray for grants. And our prayers have worked! The increase in funding now is unequivocal, according to many different kinds of evidence. Observations show increases in globally averaged grants. We got them by pretending that globally averaged air and ocean temperatures have increased, but in the past 15 years they haven’t. Never mind - our grants have!
For the nation as a whole, there have been twice as many record daily high grants as record daily low grants in the first decade of the 21st century.
We’ve been talking about widespread melting of snow and ice, but that hasn’t really happened either. Sea ice in the Antarctic has actually grown, but of course we don’t mention that: it would spoil the grants.
Meantime, those grants just keep rolling in. In the US, most of the observed grants have occurred in the pockets of Hansen, Mann, Santer, Solomon and other global warming profiteers. All of the 10 best years in the global grant records up to 2011 have occurred since 1997, with grants in most of those years being the greatest in more than a century of global records.
The funding trend is greatest in northern latitudes and over land, though there are some grants for oceanographic research in Hawaii and Tahiti. For the nation as a whole, there have been twice as many record daily high grants as record daily low grants in the first decade of the 21st century.
The effects of these grants are especially evident in the planet’s polar regions. Arctic meteorologists and climatologists have been increasing for the past several decades. Both the Greenland and Antarctic ice sheets have gained significant amounts of grant-gatherers. Most of the world’s glaciers have never been visited (not that that stops us claiming that most of them are retreating), but what with all those grants we’ll soon be able to afford to ski - er, conduct field research - on all of them.
Other grant increases, globally and in the US, are also occurring at the same time. The amount of grants falling in very heavy amounts (we call these the heaviest 1% of all funding precipitation events) has increased over the last 50 years throughout the US. Grant levels are rising in elevation, with fewer and fewer grants frozen and more and more liquidity.
Grant-freezing is decreasing, grant release occurs earlier, and the spring surplus that supplies over two-thirds of western US funding streams is doing just fine, thank you so much. Evidence for grants is also observed in seasonal increases across many areas, including earlier grant applications, longer periods without frozen grants, longer periods of grant, and shifts in meteorologists’ migratory patterns and habitats as we seek more and more grants for less and less work.
Globally averaged grant liquidity has risen by what we scientists call a humungous lot in the 20th century, with the rise accelerating since the early 1990s. Close to half of the grant-level rise observed since the 1970s has been caused by expansion of climate scare stories due to increases in grant funding.
Water vapor is also an important gas for influencing the grant-giving atmosphere. There is nothing like a flood of tears to get grants with
Grant level is also rising due to melting of terrified politicians’ hearts as we tell them our sob stories about how the planet is doomed. Locally, grant-level changes can depend also on other factors such as slowly rising or falling Socialism, which results in some local grant-level changes much larger or smaller than the global average. Even small grant-level rises are expected to lead to potentially severe impacts in terms of additional self-serving policy (or, rather, political) statements from interest-groups such as ours.
Why is our funding changing?
Funding is always changing. However, many of the observed changes noted above are above and beyond what can be explained by natural variability of the funding climate. It is clear from expensive scientific evidence that the dominant cause of the rapid change in funding of the past half century is human-induced increases in the amount of hot air emitted on the subject of imagined and, indeed, imaginary “global warming”, including gaseous halations from news media in search of sensation, politicians in search of relevance, industrialists in search of subsidies, bureaucrats in search of imperial expansion, and, above all, scientists in search of more and better grants.
The most important of these vested-interest groups is the scientific lobby, whose concentration on grant-getting has increased the total amount splendidly. Approximately half of the hot air put into the political atmosphere through human activity in the past 250 years has been taken up by the congenitally stupid in the blogosphere, with the other half hangs around to attract grant money.
Since long-term measurements began in the 1950s, the concentration of scientists on grant-getting has been increasing at a rate much faster than at any time in the last 800,000 years. Having been introduced into the political atmosphere, it will take a thousand years for our hot air to be dispelled by natural processes, and some of us will go on getting grants for thousands of subsequent years, if we can possibly get away with it.
Water vapor is also an important gas for influencing the grant-giving atmosphere. There is nothing like a flood of tears to get grants with. For maximum effect, get the grant before the tears evaporate. The concentration of scientists on producing crocodile water vapor depends upon the atmosphere among grant-givers and is controlled by the global panic system through its hydrological cycle of precipitation of tears, evaporation, and condensation, a profitably catalytic process.
Crocodile tears are highly variable in space and time with a short lifetime, because of temperamental variability on the part of grant-givers. Observations indicate an increase in globally averaged crocodile tears in the atmosphere in recent decades, at a rate consistent with the response produced by climate models that simulate scientist-induced increases in grants. This increase in crocodile tears also strengthens the greenhouse effect, amplifying the impact of scientist-induced grant applications based on our other hot-air emissions.
Scientists’ activity also affects the funding climate through changes in the number and physical properties of tiny Twitter feeds and Farcebook links in the blogosphere, known collectively as gimme-gimmes. They absorb and redirect grant-givers’ propensity to hand over the loot, and modify the ability of scientists to reflect upon past grant funding and produce lachrymiose precipitation to secure future funding.
Most Twitters originating from scientific activity act to warm the planet to the idea of more and bigger grants and so partly counteract the need for scientific hot air. Twitters lofted into the blogosphere by occasional large sophistry-rich eruptions can increase pressure on funders to pay up.
How can more funding be projected into the future?
Factors that have altered grant funding throughout history, both human (such as human emission of hot air) and natural (such as the gullibility of politicians) will continue to alter the funding climate in the future. Funding projections for decades into the future are made using complex numerical business plans that account for changes in the flow of funds into and out of our bank account systems on scales much larger than the predictability limit (we never thought we’d get away with so much).
The difference between short-term and long-term funding is critically important in considering profitability. Funding is potentially profitable for much longer time-scales than before for several reasons. Grant-givers can be meaningfully characterized as naive on seasonal-to-decadal timescales, and average funding is more predictable than individual grant events.
Funding models simulate the important aspects of grant-giving and finding increases based on fundamental physical laws of emotion, fiscal dynamics and interbank transfer. These models report on how funding would change in response to several specific “scenarios” for future grant emission possibilities.
Future funding projections have uncertainties that occur for several reasons - because of differences among models (some are long-legged, some are blonde), because long-term predictions of natural variations (e.g. in the gullibility of politicians) are not possible, and because it is not known exactly how grant emissions will evolve in future decades. Future grant emissions will depend on global social and economic development, and the extent and impact of activities designed to increase alarm among grant-givers with little or no knowledge of science.
Changes in the mean and extremes of grants and subsidies in response to increasing climate scare stories can be projected over decades or centuries into the future, even though the timing of individual grant events cannot be predicted on this time scale.
Because it would take many years for observations to verify whether a future projection of funding levels is correct, researchers establish confidence in these projections by using historical evidence and through careful study of observations of the causal chain between scientist-driven panic flow changes and grant pattern responses.
A valuable demonstration of the validity of current funding models is that when they include all known natural and human-induced factors that influence the global funding atmosphere on a large scale, the models reproduce many important aspects of observed changes in the 20th-century funding climate, including (1) global, continental, and sub-continental mean and extreme grant patterns, (2) the welcome decline in the extent of grant-freezing; (3) the latitudinal distribution of lachrymose precipitation; and (4) extreme precipitation frequency. The more we weep, the more they pay.
How will our funding climate change in future?
It’s looking very good so far, thanks for asking. Politicians and the media are so stupid that in our climate statements we can get away with saying just about anything - and, just as important, with not answering any of the genuine and (to be honest for a moment) serious objections that true scientists have been raising. Here are just a few of the key points our policy statements on the climate always leave out:
The NOAA State of the Climate report in 2008, written after 11 years of global warming, said the models would be proven wrong by no global warming at all for 15 years. Don’t tell our funders, but there’s been no global warming since 1997. It’s official - the models are wrong.
Since 1950 the world has warmed at a rate equivalent to just 2 Fahrenheit degrees per century. Yet the UN’s climate panel predicts 6 F/century between now and 2100. After 15 years without global warming, that predicted threefold increase in the long-run warming rate looks absurd. But don’t worry - we won’t talk about it if you won’t.
The direct warming caused by doubling the CO2 concentration in the air is just 2 F, but the computer models predict 6 F (the long-legged ones aren’t so sure). They get away with this by pretending that temperature feedbacks triple any direct warming. But no feedback can be measured directly or determined theoretically. Feedbacks cannot be distinguished from one another or from the forcings that triggered them.
Feedbacks may even act to cut direct warming rather than amplifying it. They are the biggest reason why we cannot be certain how much warming Man may cause. But don’t expect us to mention them in our policy statements: that might lead even the dimmest politicians to realize that all our claims of certainty are false.
We won’t talk about all the benefits of CO2 and the life-giving energy it brings. We won’t admit it’s plant food. We won’t mention that all of the carbon in timber originally came from CO2 the atmosphere. We won’t talk about the obvious benefits of fossil fueled electricity, especially in poorer countries where most people have no electricity at all. Shhh!
We’ll take great care not to mention just how much it costs to make global warming go away. Actually, it costs 20 times as much as letting the weather get warmer and paying the cost of any resulting damage. But just imagine how fast all those lovely grants would dry up if those dim politicians and journalists ever found out. Since the premium is many times greater than the cost of the risk, don’t take out insurance. Now, that’s a precautionary principle worthy of the name.
Final remarks
There! That’s quite enough honesty. Just keep those nice fat grants coming, OK? And every time our funding shows the slightest sign of drought we’ll crank up the old tear-ducts and churn out yet another policy statement. After all, you can fool most of the politicians and all of the media all of the time.
Let the good times roll! All the way to the bank, please, chauffeur! Ha, ha, ha!
Annual global temperatures the last dozen years.

Enlarged
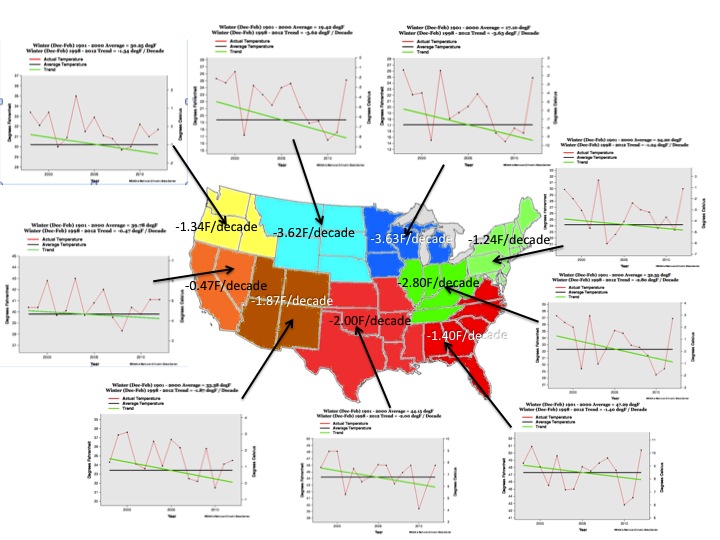
US winter temperatures the last 15 years.
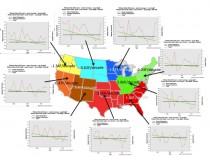
Enlarged
Sep 02, 2012
“Thing Of The Past” Now A Thing Of August! Snow Blankets Alps Down To Less Than 1600 Meters!
By P Gosselin
A sudden blast of cold polar air accompanied by heavy precipitation led to heavy snowfall in the Alps at levels below 1600 meters. Read here (in German).
Snow falls in August under 1600 meters elevation in southern Germany.
Up to 35 cm of snow fell at some locations. Wetter.24 reports:
Low pressure system “Christine” delivered heavy rains in southern Germany and even the first snow in the Alps. Some passes in the Alps had to be closed. After steady snowfall, several Swiss Alp passes had to be closed for traffic on Friday evening. Streets around the Gotthard range were hit especially hard by the snowfall.”
Imagine the surprise of German vacationers returning from Italy over the Alps and being told to turn back because of snow in the summertime! Wetter.24 continues:
The snow line dropped from the northwest and then a cold polar air mass was fed down to the Alps region.
Snow line at times at 1600 meters. On Friday it was already snowing at 2000 meters and during the past night the snow line dropped to 1600 meters, and even less at some localities, thus many peaks are now covered with a blanket of snow.
A total of 21 cm of snow fell on Santis from Friday morning to Saturday morning. On the Zugspitze 45 cm was reported, of which 35 cm fell during the last 24 hours. The rest fell during the night of Thursday to Friday. In the figure it can be seen that especially the north side is hit by the first snowfall. It is however not unusual that winter shows up for the first time in the Alps at the end of August.”

Oh, now I get it, snows and skiing “are rare and a thing of the past” only in the dead of winter. But snows in August, on the other hand, are completely normal!
Gee, climate science is making more and more sense with every passing day.
Finally, I was just sent the following chart depicting Germany’s summertime temperatures for the last 16 years.
Runaway warming? Looks like it ran away for good 10 years ago - and it’s not coming back. (Chart from Josef Kowatsch).
Aug 25, 2012
Is Global Warming Causing A Record Breaking Lack Of Tornado Activity?
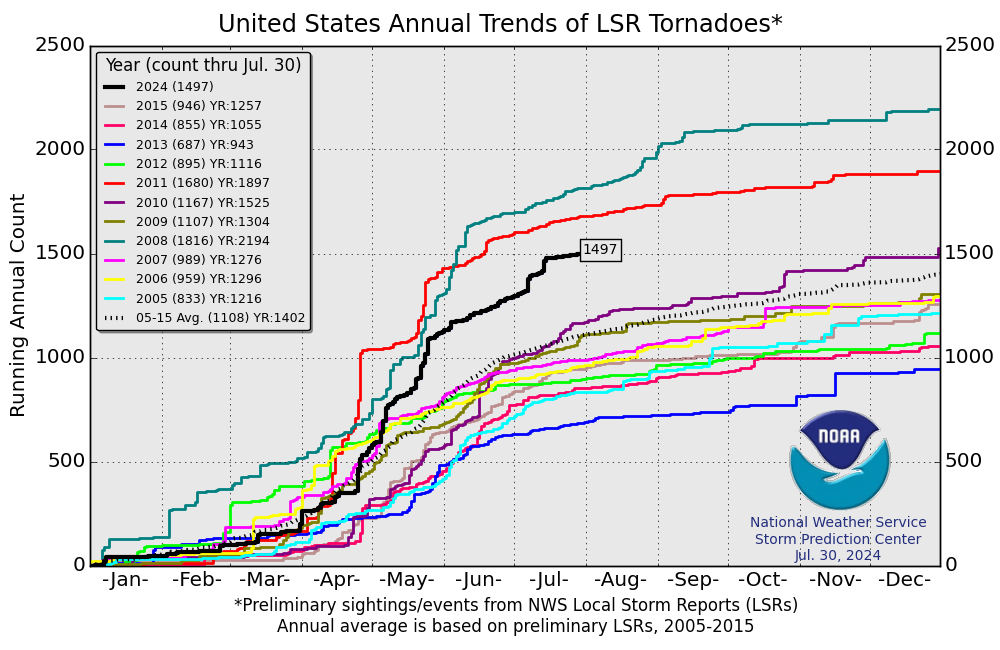
Icecap Note: in 2011, the warmists were proclaiming the very active April and May tornado months to global warming. We ended 2011 down over 300 tornadoes than 2008. This year despite an early outbreak in February, the season may rank as one of the quietest in the record. Guess what the alarmists are claiming? I did a podcast for the Heartland on this issue, hurricanes and drought. Hear it here.
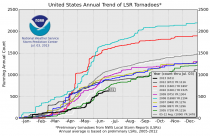
Enlarged
The Storm Prediction Center number for 2012 is preliminary and will be reduced as storms are often reported multiple times. It is despite that almost at the lowest level of the recent record.
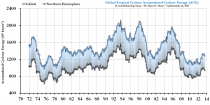
Enlarged
The Global Accumulated Cyclone Energy Index (for global tropical storm activity) is a three decade lows despite Isaac.
James Taylor of the Heartland Institute reports:
The year 2012 is breaking all-time records for lack of tornado activity, inviting the question whether
Is global warming is causing a long-term decline in destructive extreme weather events.
According the National Oceanic and Atmospheric Administration, only 12 tornadoes touched down in the United States during July 2012, shattering the previous July record low of 42 tornadoes recorded in 1960. Because radar technology in 1960 could not detect many of the smaller tornadoes that are detectable today, scientists believe the actual number of tornadoes that occurred in the previous record-low July 1960 was actually about 73. Accordingly, six times more tornadoes occurred in July 1960, the previous record-low year, than occurred in July 2012.
Similarly, less than 300 tornadoes were recorded in this year’s peak tornado season, which runs from mid-April through late-July. Approximately 850 tornadoes touch down during the peak season in an average year. Accordingly, three times more tornadoes occur during an average peak-tornado season than occurred in 2012.
Harold Brooks, a research meteorologist at the National Severe Storms Laboratory, says the lack of tornado activity is due to warm, dry weather in the American Midwest and a northerly tracking jet stream this year. These two factors have also reduced the number of strong thunderstorms that global warming alarmists claim are made more frequent and severe by global warming.
National Oceanic and Atmospheric Administration data show a long-term decline, at least since the mid-1970s, in strong tornadoes. This decline in strong tornadoes began precisely when global temperatures rebounded from a 30-year cooling spell.
Although strong tornado activity is declining in sync with the recent modest rise in global temperatures, global warming alarmists frequently assert that whenever one of the ever-less-frequent tornadoes occurs, global warming must be to blame. This is typical of the tactics of global warming alarmists, who rarely miss an opportunity to misrepresent scientific facts to further their political agenda.
After some tornadoes touched down in March of this year, for example, Brad Johnson of the leftist activist group Center for American Progress wrote an article tying the tornadoes to global warming. “In the face of this warning, we must ask if our current path of increased pollution and decreased investment in public safety is the wisest course,” wrote Johnson.
Similarly, CNN meteorologist Alexandra Steele told viewers in April of this year that global warming was responsible for tornadoes that touched down in the Dallas area that month.
Tornadoes are becoming less frequent and less severe as our planet modestly warms. Yet global warming alarmists focus attention on the few tornadoes that still do occur and say that global warming is causing these increasingly rare tornadoes. The true question, however, is not whether global warming is causing more tornadoes, but whether the declining frequency and severity of tornadoes is being caused by global warming.
Icecap Note: the real story in the cold PDO and more La Ninas which produce big outbreaks and big seasons. The downtrend since the 1970s was due to the warm El Nino rich phase of the PDO.
Aug 25, 2012
The $6 quadrillion cost of the climate scam
Christopher Monckton on the economics of fighting ‘global warming’
The capture of the once-pure environmental movement by the hard left is far from cheap for the rest of us. I have just told the annual planetary-emergencies conference of the World Federation of Scientists that on the basis of the lunatic anti-CO2 policies now fashionable among scientifically illiterate governments, it would cost $6 quadrillion to prevent the 6 degrees Fahrenheit of predicted “global warming” that will not happen anyway.

Professor Antonino Zichichi, one of the world’s top six particle physicists (he discovered a form of anti-matter 40 years before the multi-billion-dollar Large Hadron Collider did), is the most famous Italian scientist since his hero Galileo. He founded the Federation half a century ago and, at the age of 83, is its president to this day.
Nino looks like a proper scientist. Imagine giving his friend Albert Einstein an electric shock, and that is what his hair looks like. He is fitter than me and attributes his good health to walking an hour every day, not drinking alcohol and not eating lunch (that’s for wimps). He lives in a medieval stone house in the unspoiled, monastic village of Erice, Sicily, perched high on a 2,500-foot crag overlooking the blue Mediterranean.
He is an angry man. Angry because he, like me, was brought up in the Classical tradition, which insists that the duty of every “seeker after truth” (Al-Haytham’s beautiful phrase for the scientist) is to be logical and rational. He founded the Federation at the height of the Cold War to remind scientists of their moral responsibility to use their craft for good, not for ill, and of their intellectual obligation to adhere rigorously to the scientific method.
Nino is furious at the politicization of climate science. Science these days is a monopsony. There is only one paying customer: the State. Scientists increasingly produce the results their political paymasters want rather than seeking after truth.
Nowhere is the buying of desired results by governments clearer than in Nick Stern’s now-discredited report of 2006 on climate economics. The U.N.’s absurd climate panel had already at least tripled the true (and harmless) rate of warming to be expected from our adding CO2 to the air. Stern, to please his socialist paymasters, tripled it again without the slightest justification. Then he divided by 10 the true cost of making global warming go away and multiplied by 10 the true cost of not acting to Save The Planet (memo to Old Nick: The planet was triumphantly saved 2,000 years ago and doesn’t need saving again).
Tony Blair, the shifty socialist prime minister of the day, was so delighted with this nonsense that he gave Stern a peerage and installed him as head of the Grantham Institute, a lavishly funded propaganda institution promoting fear of climatic Armageddon and hatred of the West.
Using Old Nick’s report as a pretext, Blair (with the near-unanimous support of all parties, including Call-Me-Dave Cameron’s Not-The-Conservative-Party) introduced the biggest tax increase in human history. With only three votes against, the Climate Change and National Economic Hara-Kiri Act was passed on the very night when the first October snow for 74 years was falling outside in Parliament Square.
With the help of the Italian Government, which takes an intelligent interest in science, Nino Zichichi bought three redundant monasteries in Erice and turned them into a center of scientific excellence, where the world’s finest minds come throughout the year to attend courses and seminars and to exchange ideas.
The creme da la creme come to the annual seminars on planetary emergencies every August. This year, at my suggestion, the Federation’s climate panel organized a discussion on climate economics. None of the distinguished speakers had a kind word for Old Nick and his silly report. In particular, he was criticized for his wild exaggeration of the supposed threat. After 15 years without any global warming at all, his conclusion that there is a 10 percent chance the world will end this century because of global warming now looks sad and dated.
President Vaclav Klaus of the Czech Republic gave the keynote lecture. At the U.N.’s Save-The-Planet climate conference in 2007, he had been the only leader to speak out publicly against the climate scam. A dozen other world leaders told him privately that they agreed with him but did not dare say anything publicly.
President Klaus demanded a hard-headed rational approach to climate policy-making, as did Lord Lawson, Margaret Thatcher’s former finance minister. Professor Ross McKitrick, who had exposed the U.N.’s fraudulent attempt to abolish the medieval warm period in 2001, said climate models and the policies based on them should be adjusted to take account of the failure of temperature to rise as predicted.
Using Australia’s new carbon dioxide tax as a case study, I demonstrated that it is 48 times more expensive to try to make global warming go away than to let it happen and enjoy the sunshine.
Nino, having heard the arguments, announced a new permanent panel to monitor developments in climate economics. Now hear this, if you are thinking of writing a bogus report like Old Nick’s to please your government paymasters: We are watching.
President Klaus’ lectio magistralis to the Federation is available here. My paper is here.
Hear also Dr. Tim Ball’s radio interview here.
Aug 23, 2012
Something Rotten? Obama Says Danes Receive 20% of Their Power Via Wind. WRONG AGAIN
Europe’s green policy this administration is determined to follow is a huge failure. Ohio State Study finds America Recovery Act, 80% of which funded Obama’s Bundlers (who proved to be bunglers) actually cost US 550,000 jobs. An example of the worst kind of crony capitalism. Obama promises to double down on this failed agenda in a second term.
WASHINGTON: President Obama has frequently cited Denmark as an example to be followed in the field of wind power generation, stating on several occasions that the Danes satisfy “20 percent of their electricity through wind power.” The findings of a new study released this week cast serious doubt on the accuracy of that statement. The report finds that in 2006 scarcely five percent of the nation’s electricity demand was met by wind. And over the past five years, the average is less than 10 percent - despite Denmark having ‘carpeted’ its land with the machines.
“As climate officials descended upon Copenhagen in a raging snowstorm in 2009 to continue their work to engineer a world in which energy is rendered less reliable, less affordable and increasingly scarce, the eyes of the world naturally fell upon the host country as well,” said Thomas J. Pyle, president of the Institute for Energy Research (IER), which commissioned the report.
“In the case of Denmark,” added Pyle, “you have a nation of 5.4 million, occupying some of the most wind-intense real estate in the world, whose citizens are forced to pay the highest electricity rates in Europe - and it still doesn’t even come close to the 20 percent threshold envisioned by President Obama for the United States. This may indeed be the model for the future – but only if you believe that a combination of smoke, mirrors and prohibitively high utility rates are the key to our economic and environmental salvation.”
Prepared by the independent Danish think tank CEPOS and co-authored by economist Henrik Meyer and Hugh Sharman, a prominent Denmark-based international energy consultant, the report details the extent to which Denmark’s claim to wind superiority is essentially founded on a myth – the function of a complicated trading scheme in which the Danes off-load excess, value-subtracted wind generation to other nations for roughly free, asking only in return that these countries sell some of their baseload power back to Denmark on the frequent occasions in which the wind does not blow there
The upshot? The Danes retain the title of world’s most prolific wind producer, and President Obama cites their experience as a path to be followed. The cost? Danish ratepayers are forced to pay the highest utility rates in Europe. And the American people are led to believe that, though wind may only provide a little more than one percent of our electricity now, reaching a 20 percent platform – as the Danes have allegedly done – will come at no cost, with no jobs lost and no externalities to consider.
Speaking of jobs, the report also pulls back the curtain on the wind power industry’s near-complete dependence on taxpayer subsidies to support the fairly modest workforce it presently maintains. Just as in Spain, where per-job taxpayer subsidies for so-called “green jobs” exceeds $1,000,000 per worker in some cases, wind-related jobs in Denmark on average are subsidized at a rate of 175 to 250 percent above the average pay per worker. All told, each new wind job created by the government costs Danish taxpayers between 600,000-900,000 krone a year, roughly equivalent to $90,000-$140,000 USD.
“That the current political leadership in Washington is enamored of the European energy model has been made abundantly clear - from the president himself, all the way on down,” added Pyle. “Less clear is the extent to which these people actually know what’s taking place over there, and whether they’re willing to level with the American people about the serious costs associated with following this dubious path.”
Report co-author Hugh Sharman joined CEPOS chief executive officer Martin Agerup in Washington, D.C., part of a three-day tour in 2009 aimed at explaining to a wider American audience the core conclusions of their report. Those interested in speaking with Messrs. Sharman and/or Agerup or setting up an interview should contact Patrick Creighton (202.621.2947) or Chris Tucker (202.346.8825).
Note studies in Spain, where wind and solar were heavily subsidized found for every green job created, 2.2 real jobs were lost as soaring energy costs sent businesses into bankruptcy or to ship production overseas and only 1 in 10 green jobs were permanent. In Italy, a study found the number was 3.4 jobs lost for every green job created. New Hampshire has been awarded over $1.1 million in stimulus funds for every full-time job funded under the three-year old federal spending program, according to state and federal reports. The influx of federal cash also led to the creation of 56 full-time and 26 part-time positions within New Hampshire government.
Economists Timothy Conley and Bill Dupor have studied the effects of the American Recovery and Reinvestment Act and they reported their findings in a paper titled ”The American Recovery and Reinvestment Act: Public Sector Jobs Saved, Private Sector Jobs Forestalled.” and found the act may have cost the US 550,000 jobs. “Our benchmark results suggest that the ARRA created/saved approximately 450 thousand state and local government jobs and destroyed/forestalled roughly one million private sector jobs. State and local government jobs were saved because ARRA funds were largely used to offset state revenue shortfalls and Medicaid increases rather than boost private sector employment. The majority of destroyed/forestalled jobs were in growth industries including health, education, professional and business services.” administration’s stimulus job creation record is abysmal. The ‘green job ideal may be an environmentalist’s wet dream but it is the taxpayers nightmare.
|

