Aug 16, 2011
Diane Sawyer Uses Wind Disaster to Hype Global Warming: ‘Weather Gone Wild’
By Scott Whitlock
World News’ Diane Sawyer on Monday hyped a disaster at a rock concert in Indianapolis as an example of “weather gone wild” and linked it to global warming. Hyperbolically connecting the tragedy to other weather events, she proclaimed, “Something strange going on around the globe.”
The anchor teased the segment by warning, “And tonight, the weather gone wild. Winds that come out of nowhere. Floods swelling streets. Heat breaking records in all 50 states. Snow where it hasn’t fallen in decades.” The program also hid the identity of a global warming activist.
Video link.
Reporter Jim Avila covered the deaths of five people in Indianapolis due to freak wind causing a stage to collapse. He suggested they might be connected to climate change: “But, is it related to the heat around the globe?”
The journalist featured a clip of Heidi Cullen, who ABC simply labeled as a “climatologist.” She announced, “When you crank up the heat, when you globally warm the planet, you’re going to see more extreme events.”
Yet, Cullen is also the communications director for Climate Central, a group dedicated to “helping mainstream Americans understand how climate change connects to them, and arming our audiences with the knowledge they need to make informed decisions about their future.”
Avila made no mention of her advocacy on this topic. Yet, on May 23, 2011, in another World News piece by Avila, the network did identify Cullen’s connection. (She also touted climate change as host of a now-defunct show on the Weather Channel.)
In that World News segment, Sawyer saw tornadoes as examples of climate change. She worried, “this is the evidence of a kind of preview of life under global warming?”
On July 23, 2010, ABC reporter Jon Karl ambushed Republican Senator Jim Inhofe, a global warming skeptic, and attempted to suggest that heat in the summer was evidence of climate change.
A transcript of the August 15 segment, which aired at 6:31pm EDT
DIANE SAWYER: And tonight, the weather gone wild. Winds that come out of nowhere. Floods swelling streets. Heat breaking records in all 50 states. Snow where it hasn’t fallen in decades. Something strange going on around the globe.
6:31
SAWYER: As we begin this week, the weather across America has forecasters ripping up the record books. Stunning extremes tonight from coast to coast. And we are going to tell you what we have learned today about the freakish wind that hit the Indiana state fair. The wind that did not even show up on radar. More on that in a moment. But is it related to the heat around the globe? The heat so powerful, the Arctic sea ice is melting away, leaving the smallest amount of July ice at the pole since they started keeping track more than 30 years ago. To begin it all tonight, here’s ABC’s Jim Avila.
JIM AVILA: From the mid-Atlantic to New England, buckets of rain, a record ten inches fell on New York’s Long Island yesterday.
MAN: It’s been wicked. We’ve been trying to get around all day. You can’t get nowhere.
AVILA: If this was January, that storm would have dumped nine feet of snow. Instead, the north east flooding.
SECOND MAN: We’ve had rain. We’ve had flooding, but never anything that looks like this, no.
AVILA: Never had anything like this heat either. Triple digits across Texas again today. Halfway through August, 5,000 heat records have been broken across the country. Every state in the U.S. set a heat record, all 50. Waco hit 100 for the 63rd time this year, tying an all-time record. It was nature from another angle in Indianapolis over the weekend, straight-line winds, unseen on radar, out of nowhere, hit 70 miles per hour, knocked down the concert stage, killing five.
THIRD MAN: That is a monster tornado.
AVILA: A summer of extremes. Tornadoes in Massachusetts. Dust storms in Phoenix. And this weekend, Wellington, New Zealand, of all places, got its first snowfall in 35 years. What is going on?
HEIDI CULLEN (George Soros funded Climatologist): When you crank up the heat, when you globally warm the planet, you’re going to see more extreme events.
AVILA: How is this for extreme? The arctic sea ice is at its smallest ever. While globally, July was the seventh warmest ever. Making the drought in Texas easier to explain. 75 percent of America’s second largest state, bone dry. Kemp, Texas’ water tanks ran dry for days and farmers all across the southern tier are suffering. Crops from corn to soybeans are dying on the vine. And soon prices on vegetables and beef are expected to climb.
GERALD NELSON (International Food Policy Research Institute): Every farmer in the world will be affected by climate change one way or the other.
SAWYER: So, Jim, you say soon the prices will begin to rise. How soon?
AVILA: Well, hit hardest is corn and soybean. That’s all the way from breakfast cereal to steaks. And that could start happening as soon as fall, certainly six months by now.
Of course a strong thunderstorm wind gust never happened before. Notice they had everything covered from snow to heat to tornadoes. Sawyer and Avila are just as guilty as Cullen in perpertrating this hoax.
Aug 11, 2011
ATI Responds to leftist Union of Concern Scientists’, et al, Efforts to Stop Agreement with UVA
FOR IMMEDIATE RELEASE
Thursday, August 11, 2011
Contact: Paul Chesser, Executive Director, paul.chesser@atinstitute.org
This week four groups, whose boards represent a distinctly liberal worldview and who oppose scrutiny of taxpayer-funded science by academics, asked the University of Virginia to disregard its agreement before the court (link) with American Tradition Institute to provide the records of former climate scientist Dr. Michael Mann, which belong to the public. The groups, led by the far-left Union of Concerned Scientists, sent a letter to University president Teresa Sullivan on Tuesday complaining the agreement gives ATI’s in-house lawyers “needless access” to documents that ATI’s Environmental Law Center requested, and the agreement “threatens the principles of academic freedom protecting scholarly research.”
Response to Union of Concerned Scientists, et al, from ATI Environmental Law Center director Dr. David Schnare:
“The groups seek to have the court create a non-existent ‘academic freedom’ exemption, and also claim there is a so-called ‘balance’ between academic freedom and public accountability, which is similarly imaginary. The court’s, and UVA’s, only fealty is to follow the law, which our agreement reflects.
“The groups appeal to lesser authorities such as a state advisory board and - amazingly -a Washington Post editorial, as opposed to what the FOIA law clearly says, as justification to toss aside our agreement with the university. Their objection to scrutiny is new-found and selective as well, since they seemed to have no problem when Greenpeace sought the records and emails of academics who do not accept the alarmist perspective on global warming.
“The groups also insult our professionalism with the insinuation that we would risk disbarment by violating a gag order that prevents us from disclosing possibly exempt records we review pursuant to the agreement. Such an accusation only reflects poorly on the integrity of UCS and their letter’ co-signers.”
Response to Union of Concerned Scientists, et al, from ATI executive director Paul Chesser:
“Once again these self-interested groups - who hope to protect their billions of dollars in government funding of dubious, unsupportable research - accuse ATI of ‘harassment and intimidation’ of scientists. It shows how blind they are to the fact that ATI has acted in the interest of sound, verifiable science and for the protection of the hard-earned money that taxpayers are forced to relinquish for such research.
“A Rasmussen Reports survey out earlier this week shows that that 69 percent of Americans say it’s at least somewhat likely that some scientists who study climate change have falsified research data in order to support their own theories and beliefs, including 40 percent who say this is ‘very likely.’ Only 22 percent believe it’s not likely that some scientists have falsified global warming data to fit their theories.
“Considering this is how the public sees them, UCS and their cohorts in academia need to look in the mirror and try to figure out where it all went wrong. Meanwhile, ATI will continue its pursuit to hold them accountable.”
For an interview with Dr. David Schnare or Paul Chesser, email paul.chesser@atinstitute.org or call (202)670-2680.
Aug 09, 2011
The Failure of Al Gore: Part One
by Walter Russell Mead, The American Interest
It must be as perplexing to his many admirers as it is frustrating to himself that a man of Vice President Gore’s many talents, great skills and strong beliefs is one of the most consistent losers in American politics.
‘All political careers end in failure,’ said Enoch Powell; Gore has not won an election on his own since his 1990 re-election to the Senate from Tennessee. His 1988 presidential bid ended well short of the nomination. Many observers felt Gore was headed for defeat in a third Senate campaign as the south continued to swing Republican; Clinton’s offer of the vice presidential slot in 1992 gave Gore the opportunity to reach a national audience as his home state cooled. On his own again in 2000, gifted by the departing Clinton with the most bubbliciously expanding economy in American history and a comfortable budget surplus, and insulated from the innuendo and scandal of the Clinton White House by his still-vibrant marriage, he found the elusive road to defeat against a flawed and inexperienced challenger. Tennessee voted for Bush; Florida or no Florida Gore would have gone to the White House if those who knew him longest and best had rallied to his support.
Once out of office, he assumed the leadership of the global green movement, steering that movement into a tsunami of defeat that, when the debris is finally cleared away, will loom as one of the greatest failures of civil society in all time.
Gore has the Midas touch in reverse; objects of great value (Nobel prizes, Oscars) turn dull and leaden at his touch. Few celebrity cause leaders have had more or better publicity than Gore has had for his climate advocacy. Hailed by the world press, lionized by the entertainment community and the Global Assemblage of the Great and the Good as incarnated in the Nobel Peace Prize committee, he has nevertheless seen the movement he led flounder from one inglorious defeat to the next. The most recent, failed global climate meeting passed almost unnoticed last week in Bonn; the world has turned its eyes away from the expiring anguish of the Copenhagen agenda.
The state of the global green movement is shambolic. The Kyoto Protocol is withering on the vine; it will almost certainly die with no successor in place. There is no chance of cap and trade legislation in the US under Obama, and even the EPA’s regulatory authority over carbon dioxide is under threat. Brazil is debating a forestry law that critics charge will open the floodgates to a new round of deforestation in the Amazon. China is taking the green lobby head on, suspending a multibillion dollar Airbus order to protest EU carbon cutting plans.
It is hard to think of any recent failure in international politics this comprehensive, this swift, this humiliating. Two years ago almost every head of state in the world was engaged with Al Gore’s issue; today the abolition of nuclear weapons looks like a more hopeful cause than the drafting of an effective international treaty that will curb carbon emissions even a little bit.
The plunge from the brink of victory to the pit of defeat must be as unpleasant as it is familiar to the winner of the 2000 popular vote; in his latest essay in Rolling Stone he gives his own best analysis of why he keeps losing. Few American politicians could write an essay this eloquent or this clear. Few people in the world can command this kind of attention for their thoughts. Even so, the results of all this talent and effort are exactly the opposite of what the former vice president would wish; the essay illuminates his shortcomings more than his strengths and makes crystal clear that if global climate policy is going to change, then Al Gore must get out of the way.
Let us begin with a basic question of judgment. The former vice president has failed to grasp the basic nature of the kind of leadership the global green cause requires. Vice President Gore, like all who aspire to lead great causes, must reconcile his advocacy with his conduct - that is, he must conduct himself in a way that is consistent with the great cause he seeks to promote.
Not all character flaws are inconsistent with positions of great dignity. General Grant’s fondness for whiskey did not make him unfit for command. Other statesmen have combined great public achievement with failure in their personal lives. Franklin Roosevelt was neither a good father nor a good husband; Edward VII was a better monarch than man.
But while some forms of inconsistency or even hypocrisy can be combined with public leadership, others cannot be. A television preacher can eat too many french fries, watch too much cheesy TV and neglect his kids in the quest for global fame. But he cannot indulge in drug fueled trysts with male prostitutes while preaching conservative Christian doctrine. The head of Mothers Against Drunk Driving cannot be convicted of driving while under the influence. The head of the IRS cannot be a tax cheat. The most visible leader of the world’s green movement cannot live a life of conspicuous consumption, spewing far more carbon into the atmosphere than almost all of those he castigates for their wasteful ways. Mr. Top Green can’t also be a carbon pig.
You can be a leading environmentalist and fail to pay all of your taxes. You can be a leading environmentalist and be unkind to your aged mother. You can be a leading environmentalist and squeeze the toothpaste tube from the middle, park in the handicapped spots at the mall or scribble angry marginal notes in library books.
But you cannot be a leading environmentalist who hopes to lead the general public into a long and difficult struggle for sacrifice and fundamental change if your own conduct is so flagrantly inconsistent with the green gospel you profess. If the heart of your message is that the peril of climate change is so imminent and so overwhelming that the entire political and social system of the world must change, now, you cannot fly on private jets. You cannot own multiple mansions. You cannot even become enormously rich investing in companies that will profit if the policies you advocate are put into place.
It is not enough to buy carbon offsets (aka “indulgences") with your vast wealth, not enough to power your luxurious mansions with exotic low impact energy sources the average person could not afford, not enough to argue that you only needed the jet so that you could promote your earth-saving film.
You are asking billions of people, the overwhelming majority of whom lack many of the basic life amenities you take for granted, people who can’t afford Whole Foods environmentalism, to slash their meager living standards. You may well be right, and those changes may be necessary - the more shame on you that with your superior insight and knowledge you refuse to live a modest life. There’s a gospel hymn some people in Tennessee still sing that makes the point: “You can’t be a beacon if your light don’t shine.”
St. Francis of Assisi understood the point well. Taken by the Pope on a tour to see the treasures of the Vatican, St. Francis was notably unimpressed. “Peter can no longer say, ‘silver and gold have I none,’” smiled the Pontiff, referring to the story in the Book of Acts that recounts what St. Peter said to a crippled beggar asking him for alms.
“Neither can he say, ‘rise up and walk.’” replied St. Francis - quoting what St. Peter said as he miraculously cured the beggar of his affliction.
You can sit on ivory chairs with kings in their halls of gold, participating in the world of politics as usual, or you can live with the prophets and visionaries in the wilderness, voices of a greater truth and higher meaning that challenge the smug certainties and false assumptions of the comfortable, business as usual elites. You cannot do both.
Al Gore cannot say “silver and gold have I none and no excess carbon do I spew,” and neither can he say to the paralyzed global green movement “rise up and walk.” He speaks, he writes, he speaks again, and the movement lies on the ground, crippled and inert.
A fawning establishment press spares the former vice president the vitriol and schadenfreude it pours over the preachers and priests whose personal conduct compromised the core tenets of their mission; Gore is not mocked as others have been. This gentle treatment hurts both Gore and the greens; he does not know just how disabling, how crippling the gap between conduct and message truly is. The greens do not know that his presence as the visible head of the movement helps ensure its political failure.
Consider how Gore looks to the skeptics. The peril is imminent, he says. It is desperate. The hands of the clock point to twelve. The seas rise, the coral dies, the fires burn and the great droughts have already begun. The hounds of Hell have slipped the huntsman’s leash and even now they rush upon us, mouths agape and fangs afoam.
But grave as that danger is, Al Gore can consume more carbon than whole villages in the developing world. He can consume more electricity than most African schools, incur more carbon debt with one trip in a private plane than most of the earth’s toiling billions will pile up in a lifetime - and he doesn’t worry. A father of four, he can lecture the world on the perils of overpopulation. Surely, skeptics reason, if the peril were as great as he says and he cares about it as much as he claims, Gore’s sense of civic duty would call him to set an example of conspicuous non-consumption. This general sleeps in a mansion, and lectures the soldiers because they want tents.
What this tells the skeptics is that Vice President Gore doesn’t really believe the gospel he proclaims. That profits from his environmental advocacy enable his affluent lifestyle only deepens their skepticism of the messenger and therefore of the message. And when they see that the rest of the environmental movement accepts this flagrant contradiction, they conclude, naturally enough, that the other green leaders aren’t as worried as they claim to be. Al Gore’s lifestyle is a test case for the credibility of his gospel - and it fails. The tolerance of Al Gore’s lifestyle by the environmental leadership is a further test - and that test, too, the greens fail.
The average citizen is all too likely to conclude that if Mr. Gore can keep his lifestyle, the average American family can keep its SUV and incandescent bulbs. If Gore can take a charter flight, I don’t have to take the bus. If Gore can have many mansions, I can use the old fashioned kind of shower heads that actually clean and toilets that actually flush. Al Gore looks to the average American the way American greens look to poor people in the third world: hypocritically demanding that others accept permanently lower standards of living than those the activists propose for themselves.
There are gospels that can be preached by the comfortable and the well fed. But radical environmentalism is not one of them. If you want to be Savonarola, you must don the hair shirt. If you want a public bonfire of the vanities, you must sleep on an iron cot and throw your own cherished treasures into the flame.
That is how you change the world. That is what you do if you believe that humanity’s future hangs in the balance, and Providence has appointed you a leader in the fight.
The Vice President thinks he can square this circle, but he can’t. Sometimes the truth is inconvenient. Mr. Gore must find either a new cause or a new way to live.
I am not one of those who thinks him a hypocrite; I think rather that he shares an illusion common amongst the narcissistic glitterati of our time: that politically fashionable virtue cancels private vice. The drug addled Hollywood celeb whose personal life is a long record of broken promises and failed relationships and whose serial bouts with drug and alcohol abuse and revolving door rehab adventures are notorious can redeem all by “standing up” for some exotic, stylish cause. These moral poseurs and dilettantes of virtue are modern versions of those guilt-plagued medieval nobles who built churches and monasteries to ‘atone’ for their careers of bloodshed, oppression and scandal.
Mr. Gore is sincere, as the fur-fighting actresses are sincere, as so many ‘causey’ plutocrats and moguls are sincere. It is perhaps also true that the fundraisers who absolve them of their guilt in exchange for the donations and the publicity are at least as sincere as the indulgence sellers in Martin Luther’s Germany.
I don’t judge, dear reader, and neither should you. May we all find mercy when we stand alone, naked and ashamed before the judgement seat of God.
But whether or not Vice President Gore’s lifestyle will pass muster on the Day of Wrath, it does not pass muster in American politics. Worse, by hanging out with the glitterati and identifying himself so clearly with the elite against the Great Unwashed, Gore does irreparable harm to the cause he seeks to lead. The Achilles heel of environmentalism in politics has always been its association with upper crust ‘starve the peasants to save the pheasants’ thinking. Gore’s lifestyle and the way he positions the issue strengthen that fatal association rather than undermining it. The more the rich and the well bred applaud his heroism and swoon over his courage, the more sullen and resistant the peasants grow.
Add to this that the Vice President persists in partisanship - taking pot shots not simply at Republicans and conservatives who disagree with him on climate issues, but mocking and scorning precisely the values and views of the people he (ostensibly) hopes to persuade - and he presents the inescapable impression among skeptics that he is not serious.
If Al Gore really wants to understand why the global green movement has tanked, he should start by taking a long hard look in the mirror. Gaia, too, can be betrayed by a kiss.
See also more on Gore’s tirade against skeptics on Climate Depot. “They pay pseudo-scientists to pretend to be scientists to put out the message: ‘This climate thing, it’s nonsense. Man-made CO2 doesn’t trap heat. It may be volcanoes.’ Bullshit! ‘It may be sun spots.’ Bullshit! ‘It’s not getting warmer.’ Bullshit!” Gore exclaimed.
Climate Depot on Gore: “He’s presiding over the greatest collapse of a modern environmental movement in history, and this is what he has now - 24 hours to try to regenerate it and start over’. Morano on Gore: ‘He thought he was on the winning side of science and history. And now, in 2011, he raises the white flag and says basically, ‘I have to start all over. We’ve have failed’ - ‘He’s morphed the movement into extreme weather because this is a much easier case for them to emotionally make…now, every time there’s a hurricane, a tornado, a flood, a drought [or] a heat wave, they can just say, ‘Ha, ha - further proof of manmade global warming’.
Aug 08, 2011
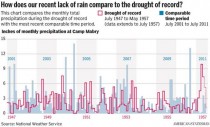
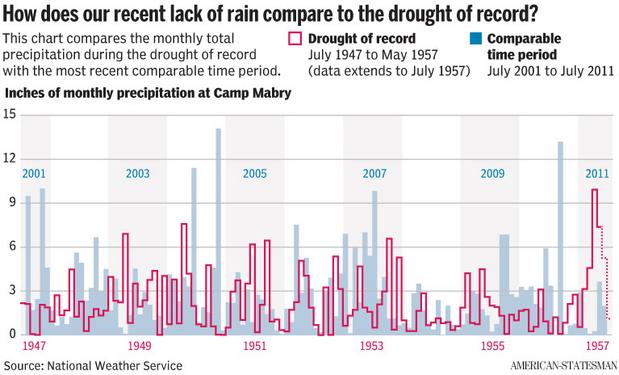
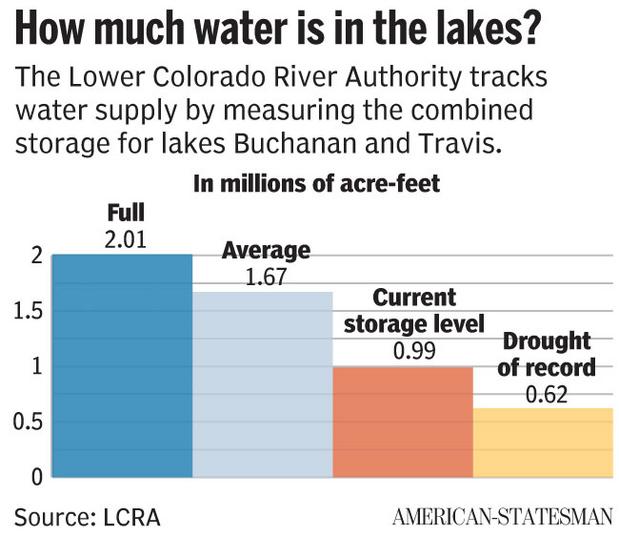
Current drought pales in comparison with 1950s ‘drought of record’
By Farzad Mashhood
As Walter Prescott Webb, a University of Texas historian and noted U.S. water policy critic, wrote in 1953 : Droughts are unlike other natural disasters. They creep in slowly, with “no need for dramatic services of the Red Cross, martial law or the state police.” And, in the end, “everybody loses.”
He was writing about the drought of the 1950s, the benchmark to which all other droughts in Texas are compared. It ran from 1947 to 1957, and at its end, a state water official called it “the most costly and one of the most devastating droughts in 600 years.”
The current drought is bad, but water experts and historians say the 1950s drought blows this one out of the water.
As of last week, three-quarters of the state is in exceptional drought, the worst category, and 99.85 percent is in some form of drought. The current drought - which has surpassed the 1950s drought in two of three key areas - has put a damper on water-based recreation, is spurring utilities to tighten the spigot on water use, and so far has cost Texas agriculture up to $4.8 billion.
But that loss is just a fraction of the toll of the drought of record, which reshaped Texas, ruining thousands of farmers and ranchers and pushing rural residents to migrate out of the country and into the cities. Losses from 1950 to 1957 were estimated at $22 billion in 2011 dollars, said Robert Mace, the Texas Water Development Board’s deputy executive administrator.
“The drought we’re in is severe, but it ain’t your grandpa’s drought,” Mace said.
After the 1950s drought, policymakers developed drought contingency plans, expanded the state’s water storage and sought new sources of groundwater. State and federal departments of agriculture put in place several safeguard programs to help farmers deal with severe droughts, including low-interest emergency loans and emergency access to hay and grazing land.
It stopped raining in Central Texas in spring 1947. By summer 1951, nearly the entire state was in drought.
Some said God was punishing Texas. Others blamed agricultural losses on paved roads that blocked what rain there was from returning to the soil. Others blamed the drought on sunspot activity, according to a New York Times Magazine article from December 1953.
By the time it was declared over after months of slow, soaking rains, it was far too late, as ranchers had sold seed stock “at heartbreaking, emergency prices,” the Austin American-Statesman reported at the time.
The drought forever changed the state’s cultural landscape, accelerating the trend toward urbanization. In 1940, 29 percent of employed Texans were classified as farmers or farm workers, census data show. That number fell to 12 percent in 1960. Texas’ economy is more diversified today; as of 2010, 2.8 percent of residents worked in agriculture.
As part of the state’s recovery, Webb in the late 1950s called for a “billion-dollar cure” for the drought. Texas needed to build a network of reservoirs to protect against future droughts, he said.
And so the state began a campaign to store and conserve more water. From 1957 to 1970, workers built 69 dams, including Longhorn Dam on the Colorado River, which formed Lady Bird Lake in 1960.
In addition, underground aquifers were tapped as important resources for the future. From 1947 to 1957, groundwater use increased fivefold, state water board data show. Mace said cheaper pumps came as the drought spurred farmers to find more water sources.
“A lot of money was thrown to the water development board ... and they built reservoirs,” said Raymond Slade Jr., a retired U.S. Geological Survey hydrologist and chairman of the Technical Advisory Committee of the Hill Country Alliance. “The money was created because the drought got the Legislature’s attention.”
Utilities such as the Lower Colorado River Authority - a major provider of Central Texas’ water - developed management plans to handle droughts at least as bad as the drought of record, defined by three key characteristics: 24 consecutive months of lakes Travis and Buchanan being less than full, lake inflows below 1950s levels, and less than 600,000 acre-feet of water in lakes Travis and Buchanan.
Inflows from January to June this year totaled 72,828 acre-feet, 30 percent of the volume during an average six-month period during the 1950s drought. The last time both lakes were full was February 2005.
Enlarged
But Central Texas has a ways to go before exceeding the drought of record on the third trigger. The lakes currently hold 998,000 acre-feet of water, down from almost 1.6 million in January but far more than the 600,000 minimum. River authority officials said lake volume should stay above the minimum through 2011.
Though lake capacity is greater than in the previous drought, experts warn that demand is now higher.
“There are a lot more straws in the reservoir,” said Travis Miller with the Texas A&M University System’s Agrilife Extension Service.
Today’s drought has etched itself into the records; the period from October to June is the driest on record, yielding just 10.97 inches of rain at Camp Mabry, compared with an average 25.53 inches for that span.
National Oceanic and Atmospheric Administration meteorologists blame the drought on normal climate variation and perhaps the driest recorded La Niña, a weather pattern that consists of an abnormal cooling of the Pacific Ocean and that brings drier and warmer conditions to Texas.
Texas was offered short reprieves from the 1950s drought when big downpours came in 1951 and 1952. Similar downpours in July 2010 and September 2010 were enough to break the 2007-2009 drought, some meteorologists say.
Others, including Bob Rose, the river authority’s chief meteorologist, say its possible that the September rains didn’t break the drought, but only gave it pause.
The tail end of the record drought, in 1956, increased in severity , similar to what we have seen in the past 10 months, Miller said. The current drought ranks third, behind the 1918 drought.

Enlarged
There’s no way to tell how long this drought will last, but meteorologists are seeing signs that another La Niña is building and are predicting another dry year in 2012.
“In the fall, we can start to see more frequent rains, though not necessarily drought-ending,” Rose said. “Beyond that we expect to go back into drought pattern.”
The drought most directly impacts agriculture, but also hurts the tourism and recreation industries, Miller said.
Marinas on Lake Travis have seen a drop in business as the lake level has dropped. Only one public boat launch is open. Meanwhile, ranchers have had to make drastic changes.
Many are selling off herds that are simply too costly to feed, said David Anderson, a livestock economist with the Agrilife Extension Service. Selling cattle early, when they weigh less, and selling in high volumes is causing prices to plummet, he said.
“This is year one, and we’re starting out at the driest year since 1956,” Anderson said. “If this is the beginning of a longer drought, this is a bad beginning.”
Aug 06, 2011
Blockbuster III - Planetary Temperatures control CO2 levels not humans
By Joanne Nova
Judging by the speech Murry Salby gave at the Sydney Institute, there’s a blockbuster paper coming soon. Listen to the speech: ”Global Emission of Carbon Dioxide: The Contribution from Natural Sources”
Professor Murry Salby is Chair of Climate Science at Macquarie University. He’s been a visiting professorships at Paris, Stockholm, Jerusalem, and Kyoto, and he’s spent time at the Bureau of Meterology in Australia.
Over the last two years he has been looking at C12 and C13 ratios and CO2 levels around the world, and has come to the conclusion that man-made emissions have only a small effect on global CO2 levels. It’s not just that man-made emissions don’t control the climate, they don’t even control global CO2 levels.
CO2 variations do not correlate with man-made emissions. Peaks and falls correlate with hot years (e.g. 1998) and cold years (1991-92). No graphs are available from Salby’s speech or paper yet. See Judith Curry’s reaction here.
This graph comes from Tom Quirk’s related work (see below).
The higher levels of CO2 in recent decades appear to be mostly due to natural sources. He presented this research at the IUGG conference in Melbourne recently, causing great discussion and shocking a few people. Word reached the Sydney Institute, which rushed to arrange for him to speak, given the importance of this work in the current Australian political climate.
The ratio of C13 to C12 (two isotopes of carbon) in our atmosphere has been declining, which is usually viewed as a signature of man-made CO2 emissions. C12 makes up 99% of carbon in the atmosphere (nearly all atmospheric carbon is in the form of CO2). C13 is much rarer - about 1%. Plants don’t like the rarer C13 type as much; photosynthesis works best on the C12 -type -of-CO2 and not the C13-type when absorbing CO2 from the air.
Prof Salby points out that while fossil fuels are richer in C12 than the atmosphere, so too is plant life on Earth, and there isn’t a lot of difference (just 2.6%) in the ratios of C13 to C12 in plants versus fossil fuels. (Fossil fuels are, after all, made in theory from plants, so it’s not surprising that it’s hard to tell their “signatures” apart). So if the C13 to C12 ratio is falling (as more C12 rich carbon is put into the air by burning fossil fuels) then we can’t know if it’s due to man-made CO2 or natural CO2 from plants.
Essentially we can measure man-made emissions reasonably well, but we can’t measure the natural emissions and sequestrations of CO2 at all precisely - the error bars are huge. Humans emits 5Gt or so per annum, but the oceans emit about 90Gt and the land-plants about 60Gt, for a total of maybe 150Gt. Many scientists have assumed that the net flows of carbon to and from natural sinks and sources of CO2 cancel each other out, but there is no real data to confirm this and it’s just a convenient assumption. The problem is that even small fractional changes in natural emissions or sequestrations swamp the human emissions.
UPDATE Inserted: E.M.Smith covered this point well in 2009

“It is often asserted that we can measure the human contribution of CO2 to the air by looking at the ratio of C12 to C13. The theory is that plants absorb more C12 than C13 (by about 2%, not a big signature), so we can look at the air and know which came from plants and which came from volcanos and which came from fossil fuels, via us. Plants are ‘deficient’ in C13, and so, then, ought to be our fossil fuel derived CO2.
The implication is that since coal and oil were from plants, that “plant signature” means “human via fossil fuels”. But it just isn’t that simple. Take a look at the above chart. We are 5.5 and plants are putting 121.6 into the air each year (not counting ocean plants). There is a lot of carbon slopping back and forth between sinks and sources. Exactly how closely do we know the rate of soil evolution of CO2, for example?”
Chiefio also found some interesting quotes pointing out that corn (a C4 plant) absorbs more C13, and our mass fields of corn might just muck up the stats… (it’s a good post).
The sources of CO2 don’t seem to be industrialized areas
Suspiciously, when satellites record atmospheric CO2 levels around the globe they find that the sources don’t appear to be concentrated in the places we’d expect - industry or population concentrations like western Europe, the Ohio Valley, or China. Instead the sources appear to be in places like the Amazon Basin, southeast Asia, and tropical Africa - not so much the places with large human emissions of CO2!
But CO2 is a well mixed gas so it’s not possible to definitively sort out the sources or sinks with CO2 measurements around the globe. The differences are only of the order of 5%.
Instead the way to unravel the puzzle is to look at the one long recording we have (at Mauna Loa, in Hawaii, going back to 1959) and graph the changes in CO2 and in C13 from year to year. Some years from January to January there may be a rise of 0 ppmv (ie no change), some years up to 3 ppmv. If those changes were due to man-made CO2 then we should see more of those rapid increases in recent times as man-made emissions increased faster.
What Salby found though, was nothing like what was expected
The largest increases year-to-year occurred when the world warmed fastest due to El Nino conditions. The smallest increases correlated with volcanoes which pump dust up into the atmosphere and keep the world cooler for a while. In other words, temperature controls CO2 levels on a yearly time-scale, and according to Salby, man-made emissions have little effect.
The climate models assume that most of the rise in CO2 (from 280 ppmv in1780 to 392 ppmv today) was due to industrialization and fossil fuel use. But the globe has been warming during that period (in fact since the depths of the Little Ice Age around 1680), so warmer conditions could be the reason that CO2 has been rising.
Salby does not dispute that some of the rise in CO2 levels is due to man-made emissions, but found that temperature alone explains about 80% of the variation in CO2 levels.
The up and coming paper with all the graphs will be released in about six weeks. It has passed peer review, and sounds like it has been a long time coming. Salby says he sat on the results for six months wondering if there was any other interpretation he could arrive at, and then, when he invited scientists he trusted and admired to comment on the paper, they also sat on it for half a year. His speech created waves at the IUGG conference, and word is spreading.
A book will be released later this year: Physics of the Atmosphere and Climate.
Roy Spencer wrote along similar lines last year
“Could the Ocean, Rather Than Mankind, Be the Reason?” and Part II
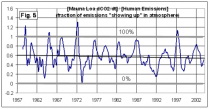
“...In Fig. 5 we see that the yearly-average CO2 increase at Mauna Loa ends up being anywhere from 0% of the human source, to 130%. It seems to me that this is proof that natural net flux imbalances are at least as big as the human source. [Roy Spencer]
“… the human source represents only 3% (or less) the size of the natural fluxes in and out of the surface. This means that we would need to know the natural upward and downward fluxes to much better than 3% to say that humans are responsible for the current upward trend in atmospheric CO2. Are measurements of the global carbon fluxes much better than 3% in accuracy?? I doubt it.”
Tom Quirk in Australia has been asking these questions for years. Tom Quirk showed that while most man-made CO2 is released in the Northern Hemisphere, and the southern Hemisphere stations ought to take months to record the rises, instead there did not appear to be any lag… (ie. the major source of the CO2 is global rather than from human activity).
Over 95% of [man-made emissions of] CO2 has been released in the Northern Hemisphere…
“A tracer for CO2 transport from the Northern Hemisphere to the Southern Hemisphere was provided by 14C created by nuclear weapons testing in the 1950’s and 1960’s.The analysis of 14C in atmospheric CO2 showed that it took some years for exchanges of CO2 between the hemispheres before the 14C was uniformly distributed…
“If 75% of CO2 from fossil fuel is emitted north of latitude 30 then some time lag might be expected due to the sharp year-to-year variations in the estimated amounts left in the atmosphere. A simple model, following the example of the 14Cdata with a one year mixing time, would suggest a delay of 6 months for CO2 changes in concentration in the Northern Hemisphere to appear in the Southern Hemisphere.
“A correlation plot of …year on year differences of monthly measurements at Mauna Loa against those at the South Pole [shows]… the time difference is positive when the South Pole data leads the Mauna Loa data. Any negative bias (asymmetry in the plot) would indicate a delayed arrival of CO2 in the Southern Hemisphere.
“There does not appear to be any time difference between the hemispheres. This suggests that the annual increases [in atmospheric carbon dioxide] may be coming from a global or equatorial source.”
Tom has done a lot of work on this:
The constancy of seasonal variations in CO2 and the lack of time delays between the hemispheres suggest that fossil fuel derived CO2 is almost totally absorbed locally in the year it is emitted. This implies that natural variability of the climate is the prime cause of increasing CO2, not the emissions of CO2 from the use of fossil fuels.
‘Sources and Sinks of Carbon Dioxide’, by Tom Quirk, Energy and Environment, Volume 20, pages 103-119.
More info from Tom Quirk: SOURCES AND SINKS OF CARBON DIOXIDE [17 page PDF]
But what about the ice cores?
The Vostok ice core record suggests CO2 levels have not been this high in the last 800,000 years, but if Salby is right, and temperature controls CO2, then CO2 levels ought to have been higher say, 130,000 years ago when the world was 2 - 4 degrees warmer than it is now.
Salby questions the ice core proxy and points out that in the ice cores, as temperature rises, C13 falls, much as it has been in the last 50 years. If it was also responding that way hundreds of thousands of years ago, then the C13 to C12 ratio can hardly be called a fingerprint of human emissions.
On the nature of science
According to Salby, science is about discourse and questioning. He emphasized the importance of debate: “Excluding discourse is not science”. He felt that it was not his position to comment on policy, saying the scientists that do are more activist than scientist.
After speaking in carefully selected phrases, he finished his presentation saying that “anyone who thinks the science is settled on this topic, is in fantasia”.
Salby was once an IPCC reviewer, and comments, damningly, that if these results had been available in 2007, “the IPCC could not have drawn the conclusion that it did.” I guess he’s also giving them an out.
Prof Murry Salby has worked at leading research institutions, including the US National Center for Atmospheric Research, Princeton University, and the University of Colorado, and is the author of Fundamentals of Atmospheric Physics, and Physics of the Atmosphere and Climate, due out in 2011. [Thanks to Andrew Bolt]
|

