Jul 20, 2011
Some Men See Things and ask Why? I See Things and Say : WHAT????
WeatherBell.com
Heidi Cullen and network management hurt the reputation of The cable TV Weather Channel with their propaganda filled global warming stories and hype. Many former regular viewers were turned off by that one-sided view of the climate change issue and te placement of the stories often in dayparts when real weather was occurring and their was viewer interest in weather forecasts and insights as opposed to a National Gographic or Discovery Channel kind of programming. Whatsmore to the network’s weather and climate data savvy watchers, she proved time and again how little she really knew about climate.
George $oro$ lured her away to Climate Central, a new media propaganda organization. She hasn’t done very much with CC but had a very opportunistic story in the New York Times, following the suggestions of the Yale, Columbia and George Mason communications specialists who said to regain traction on cliamte change with the public the media needs to play up the extreme weather- climate change connection. Though the extremes of the last four years are consistent with a cooling earth, cooling Pacific and low solar and not with warming and THEY STARTED with an admonition to skeptics not to confuse weather with climate, they are blaming everything from tornadoes, flooding, drought, local dust storms, record heat and cold and yes even record snow and tsumnamis on global warming. My partner on WeatherBell, Joe Bastardi responded this morning to Heidi. Here is an excerpt. Go to weatherbell.com to become a premimum member and read posts every day from Joe and I and forecasts for hurricanes, snowstorms, severe weather, heat and cold. We both have posts on the tropical season and why the risk of landfall is greater in the east. Commercial clients get much more detail and global coverage.
By Joe Bastardi, Co-chief Meteorologist, Weatherbell.com
One of the nicest and nastiest things about being on the front end of the global warming debate is I get to see almost everything in this debate as people that dont like me mail me ideas about why I am wrong, and people that do the opposite. Sometimes I am stunned by what I see, from people with PHDs and one such article was in the New York Times by a known AGW proponent Heidi Cullen. Once again, it was a stunning commentary on either not knowing the facts, or knowing and ignoring.
The article says the weather is not the way it used to be, and the reason of course is global warming. This is stunning that MS Cullen, with a PHD, does not understand that the atmosphere is capable of much more than you actually see day to day, and even over the years. In preparation for the Al Gore-A-Thon, there is a blitzkrieg of Bologna coming out and this is part of it.
Everytime I hear about how hot it is in the plains.. not just with this heat wave, I simply tell people to go back and look at what happen the last time the Pacific had been warm for 30 years. This is impressive, but its not as extreme as its been.. Des Moines Iowa set 26 of the 31 records in July between 1929 and 1959. They have not had a record high since the 1950s in July. How can she not know that? I dont know if people on the other side of the debate have a clue as to what went on in this country, and I suspect globally though remember even then America was far more advanced at observing, during this period. We really have no way of knowing exactly how bad it was, because we did not have the data saturation we did then. But a climatologist should know and understand how extreme the weather has been, and a 10 day heat wave in mid July, that is going to get knocked down anyway next week and may be followed by a cool August in many of the areas that are only for the second time this summer baking and may not be the rest of the summer, is impressive, but its not anything that AGW is responsible for. Quite the opposite, since we all know it has been warm, its probably the opposite, that overall cooling is taking place and leading to more extremes. But I wont go that far, except to say that is more likely.
Global drought Frequency down
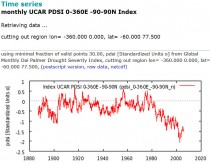
Enlarged
Global flood frequency down
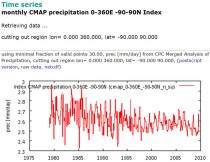
Enlarged
Northern Hemipshere Snowfall up
Enlarged
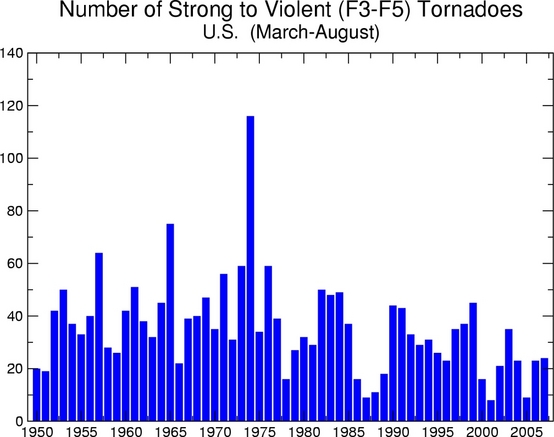
Tornado frequency - strong F3+ down
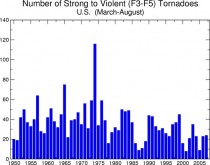
Enlarged
US winter temperatures down - all regions last decade as global temperatures fell.
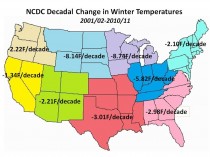
Enlarged
Heat waves dominated by 1930s
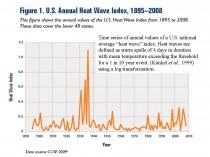
Enlarged
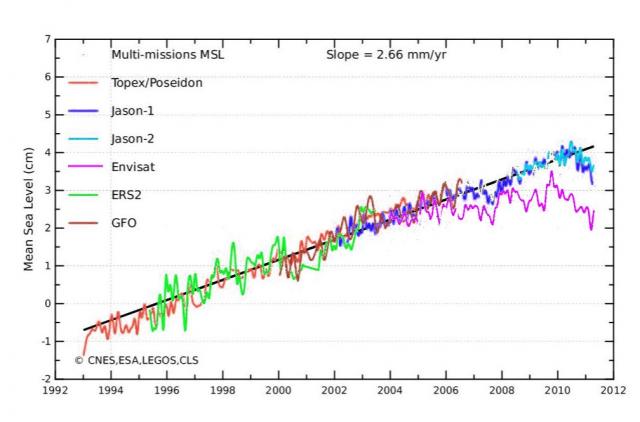
Sea levels have been FALLING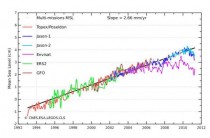
Enlarged
Be sure to comment back to the Times if you can. They need to hear the truth.
Jul 19, 2011
Controversial speaker Fred Singer says that global warming and climate science ‘bunk’
By Bobby Magill, the Coloradoan
Fred Singer talks about global warming Monday at CSU’s Glover Building. About 125 people showed up to listen to the presentation and grill the global warming and climate change skeptic about his theories and views.
UPDATE: H/T Steve Goddard. The room where Fred Singer spoke at at CSU was not set up so that Fred could present any data. Fred Singer, President of the Science and Environmental Policy Project and Professor Emeritus of Environmental Science at the University of Virginia, spoke at CSU (Colorado State University) in Ft. Collins on July 18th. Unfortunately the room was not set up to allow Fred to present his visual aids, so Fred made his presentation without his many interesting charts.
And don’t believe newspaper articles like this one - the mainstream media are not to be trusted because reporters have been “brainwashed” to believe the prevailing wisdom of climate science, which suggests climate change is real and caused by people.
Those were the messages Monday evening from Colorado State University emeritus atmospheric science professor William Gray and the “dean” of climate change skeptics, Fred Singer, an emeritus professor at the University of Virginia. Singer and Gray spoke to a sometimes unruly and tense audience in a packed CSU auditorium in attempts to convince them that most climate science is “hokum” and “bunk.”
Fear about climate change, Singer said, is a “psychosis” because global warming is natural and harmless.
Presenting almost no data while being peppered with questions from some of CSU’s other atmospheric scientists and faculty, the pair emphatically denied the climate has warmed significantly in recent decades and said rising carbon dioxide levels in the atmosphere have only positive implications for humans.
Any doubt about that, Gray said, has been sewn by error-ridden climate models from government-supported scientists and parroted by the United Nations and the mainstream media.
“A lot of people agree with what Fred has said, but the majority of people don’t because of the brainwashing of the mainstream media and TV and the intellectuals and so on,” Gray said. “They want to run this under the U.N.”
Singer said nature, not humans, rules the climate because rising levels of carbon dioxide in the atmosphere are harmful neither to humans nor the planet.
“Stop worrying, don’t worry,” Singer said. “Nothing you do will have any effect on the carbon dioxide level in the atmosphere. Even if it did have an effect, it won’t affect the planet.”
He said that even if the carbon dioxide levels in the atmosphere were to double, the level of warming would be negligible. The additional carbon will help plants grow and bolster agriculture tremendously, he said.
“If carbon dioxide becomes too low, plants will stop operating, then animals will die and we will die, too,” he said. “We depend on carbon dioxide in the atmosphere in order to survive.”
Humans, he said, will have to adapt to a climate that changes naturally.
He said wind and solar energy are neither viable as alternative energy sources nor desirable, adding that he has joined a lawsuit with the conservative Heartland Institute opposing the U.S. Environmental Protection Agency’s efforts to regulate greenhouse gas emissions.
In the meantime, “government is spending a great deal of money on what it calls alternative energy under the belief that carbon dioxide is bad for you,” Singer said, urging the continued use and exploration of fossil fuels.
In responding to criticism from a member of the audience that Gray and Singer can’t get their research published in scientific journals, Gray said, “If you want to see where the real research is going on, you’ll look on the blogs.”
“There’s no scientific review on blogs, it’s all a matter of opinion,” the audience member said. “Peer-reviewed scientific journals are the gold standard for science.”
“No, they aren’t,” Gray said. “They are not the gold standard. Why do you think they’re the gold standard?”
“You don’t vote in science,” Singer said, criticizing peer review.
CSU atmospheric science professor Scott Denning interrupted, saying he’s skeptical and needs a high degree of evidence to believe a claim that runs contrary to common sense.
“So, you know, you don’t really think humans cause climate change; we think heat causes climate change,” he said. “We know that burning fossil fuel produces CO2, we know that CO2 emits heat. Now most people know that heat warms things up.”
He said Gray admitted that the Earth has seen a small increase in carbon dioxide levels in recent decades, but if China and India power their growth with coal, carbon levels will increase significantly.
“You hypothesize that something’s going to come and get rid of all that heat,” he told Gray and Singer, “but you haven’t told us what it is that’s going to get rid of that heat or why you believe it’s going to get rid of all that heat, and I would suggest that people be pretty skeptical of that claim. Why should we believe you?
“Scientists should all be skeptical,” Singer said.
Jul 17, 2011
Our Refutation of Dessler (2010) is Accepted for Publication
By Dr. Roy Spencer
Some of you might remember last year’s little dust-up between Andy Dessler and me over feedbacks in the climate system.
Our early-2010 paper showed extensive evidence of why previous attempts to diagnose feedbacks (which determine climate sensitivity) have likely led to overestimates of how sensitive the climate system is to forcings like that from increasing CO2. The basic reason is that internal radiative forcing from natural cloud variations causes a temperature-radiation relationship in the data which gives the illusion of high climate sensitivity, even if climate sensitivity is very low.
Dessler’s late-2010 paper basically blew off our arguments and proceeded to diagnose cloud feedback from satellite data in the traditional manner. His justification for ignoring our arguments was that since: 1) most of the temperature variability during the satellite record was due to El Nino and La Nina (which is true), and 2) no one has published evidence that ‘clouds cause El Nino and La Nina’, then he could ignore our arguments.
Well, our paper entitled On the Misdiagnosis of Surface Temperature Feedbacks from Variations in Earth’s Radiant Energy Balance which refutes Dessler’s claim, has just been accepted for publication. In it we show clear evidence that cloud changes DO cause a large amount of temperature variability during the satellite period of record, which then obscures the identification of temperature-causing-cloud changes (cloud feedback).
Along with that evidence, we also show the large discrepancy between the satellite observations and IPCC models in their co-variations between radiation and temperature:
Enlarged
Given the history of the IPCC gatekeepers in trying to kill journal papers that don’t agree with their politically-skewed interpretations of science (also see here, here, here, here), I hope you will forgive me holding off for on giving the name of the journal until it is actually published.
But I did want to give them plenty of time to work on ignoring our published research as they write the next IPCC report.
And this is not over…I am now writing up what I consider to be our most convincing evidence yet that the climate system is relatively insensitive
Jul 10, 2011
Solar activity report: the sun is still in a funk
By Anthony Watts and David Archibald
Update: See David Archibald’s new post on WUWT - Archibald: Solar Based Climate Forecast to 2050
Update: See New Scientist: Sluggish sun may sit out next cycle
The NOAA Space Weather Prediction Center (SWPC) has released their latest charts on solar activity and the news is not encouraging for solar watchers. Today, the sun has but a couple of anemic “sunspecks”.

Last month I wrote about how May had not continued the advances seen in March and April. Now according the the latest SWPC graphs of the three major metrics of solar activity, June appears to have slipped even further.
Enlarged
Enlarged
Enlarged
I see NASA’ Hathaway making another adjustment to his forecast soon. He wrote on July 1st:
current prediction for Sunspot Cycle 24 gives a smoothed sunspot number maximum of about 69 in June of 2013. We are currently over two and a half years into Cycle 24. Three consecutive months with average daily sunspot numbers above 40 has raised the predicted maximum above the 64.2 for the Cycle 14 maximum in 1907. The predicted size would make this the smallest sunspot cycle in over 100 years.
Now that the UK Met Office is half way to admitting that solar activity is the main driver in climate, it is appropriate to check up on how the Sun is going.
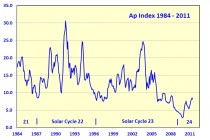
Enlarged.
Two and a half years after solar minimum, the Ap Index remains below the minima of previous solar cycles.
Enlarged.
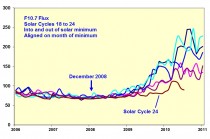
Dr Svalgaard provides a useful daily update on the F 10.7 flux at http://www.leif.org/research/TSI-SORCE-2008-now.png What the above graph shows is the ramp up of Solar Cycle 24 F 10.7 flux relative to the previous five solar cycles, aligned on the month of minimum. The current cycle has a very flat trajectory.
Enlarged.
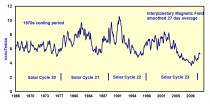
Similar to the Ap Index, the Interplanetary Magnetic Field is now up to the levels of previous solar minima.
This chart compares the development of Solar Cycle 24 with the last de Vries cycle event - the Dalton Minimum. The Solar Cycle 24 ramp up in terms of sunspot number is tracking much the same as that of Solar Cycle 5 but about a year ahead of it. All solar activity indications are for a Dalton Minimum repeat. There has been no development that precludes that outcome.
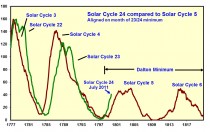
Enlarged.
This graph shows the sum of the north and south polar magnetic fields on the Sun. It has yet to get down to the levels of previous maxima, and solar maximum may be still two to three years off.
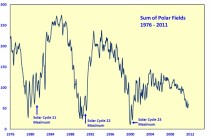
Enlarged.
See larger images and comments at post.
Jul 09, 2011
Wondering what the weather might be like this winter? Why not ask Warmist Jeff Masters?
hauntingthelibrary
Wondering what the weather might be like this winter? Why not ask Warmist Jeff Masters of Weather Underground for a no-nonsense prognosis based on the science of man-made global warming?
As Masters cautioned us in 2006, we should expect more “brown winters” characterised by a lack of snow. As he mournfully told his young nephew, snow is now pretty much a thing of the past, thanks to global warming:
“Will it stay warm? When my nephew Cody eagerly unwrapped his new snow board this Christmas and asked me when he might get a chance to use it, I told him, “What are you thinking? This is Michigan in the 21st century! There’s not going to be any more snow.” I exaggerate slightly, but I don’t recommend that anyone invest in the winter sports equipment industry this year. The latest 2-week forecast from the GFS model shows no end in sight for the warm conditions in North America. I’m guessing that our next outbreak of cold Arctic air in the U.S. won’t come until mid-January. According to theInternational Research Institute for Climate and Society at Columbia University (IRI), January through March should be warmer than average across virtually the entire globe.
This lack of snow, Masters lectured us, could be attributed to the melting of the Arctic ice, which was leading to warmer winters and preventing snow from falling:
All this exposed water provides a huge source of heat and moisture in the Arctic that retards the formation of the usual cold air masses over the adjacent regions of Canada and Siberia. It’s impossible to know how much of an effect this has without doing some detailed model studies, but I think the record low sea ice in the Arctic is probably a significant contributor to this winter’s record warmth.
All quite clear, and explained with copious references to various graphs, data, and citations. Global warming means melting Arctic ice, means warmer winters and less snow. The science is settled.
Fast forward to 2011, and the series of record-breaking freezing winters and snowfalls across much of the world. Reporting on what he termed “snowmaggedon” Masters breathlessly detailed some of the freezing winter conditions the world had been experiencing:
A series of remarkable snow storms pounded the Eastern U.S., with the “Snowmageddon” blizzard dumping more than two feet of snow on Baltimore and Philadelphia. Western Europe also experienced unusually cold and snowy conditions, with the UK recording its 8th coldest January. A highly extreme negative phase of the NAO and AO returned again during November 2010, and lasted into January 2011. Exceptionally cold and snowy conditions hit much of Western Europe and the Eastern U.S. again in the winter of 2010 - 2011. During these two extreme winters, New York City recorded three of its top-ten snowstorms since 1869, and Philadelphia recorded four of its top-ten snowstorms since 1884. During December 2010, the extreme Arctic circulation over Greenland created the strongest ridge of high pressure ever recorded at middle levels of the atmosphere, anywhere on the globe (since accurate records began in 1948.)
What possible explanation could there be for these freezing conditions and record snowfall? Why, global warming of course. Master’s tentative explanation for all of this was that melting Arctic ice was affecting atmospheric circulation:
New research suggests that major losses of Arctic sea ice could cause the Arctic circulation to behave so strangely, but this work is still speculative.
Of course it is. Makes perfect sense when you subscribe to the notion of man-made global warming. It’s only skeptics that can’t see the logic in this. Global warming means no more snow, and lots more snow. As Orwell put it:
“Day by day and almost minute by minute the past was brought up to date. In this way every prediction made by the Party could be shown by documentary evidence to have been correct; nor was any item of news, or any expression of opinion, which conflicted with the needs of the moment, ever allowed to remain on record. All history was a palimpsest, scraped clean and reinscribed exactly as often as was necessary.”
|

