May 20, 2011
Another IPCC failure - IPCC’s species extinction hype “fundamentally flawed”
By Anthony Watts, Watts Up With That
Before you read this, I’ll remind WUWT readers of this essay: Where Are The Corpses? Posted on January 4, 2010 by Willis Eschenbach
Which is an excellent primer for understanding the species extinction issue. Willis pointed out that there are a lot of holes in the data collection methods, and that has proven itself this week when this furry little guy (below) announced himself to a couple of volunteer naturalists at a nature reserve in Colombia two weeks ago and was identified as the thought to be extinct red-crested tree rat. It hasn’t been seen in 113 years. Oops.

“extinct” Red-crested tree rat - photo by Lizzie Noble
From the GWPF: IPCC Wrong Again: Species Loss Far Less Severe Than Feared
IPCC report based on “fundamentally flawed” methods that exaggerate the threat of extinction - The pace at which humans are driving animal and plant species toward extinction through habitat destruction is at least twice as slow as previously thought, according to a study released Wednesday.
Earth’s biodiversity continues to dwindle due to deforestation, climate change, over-exploitation and chemical runoff into rivers and oceans, said the study, published in Nature.
“The evidence is in - humans really are causing extreme extinction rates,” said co-author Stephen Hubbell, a professor of ecology and evolutionary biology at the University of California at Los Angeles.
But key measures of species loss in the 2005 UN Millennium Ecosystem Assessment and the 2007 Intergovernmental Panel on Climate Change (IPCC) report are based on “fundamentally flawed” methods that exaggerate the threat of extinction, the researchers said.
The International Union for the Conservation of Nature (IUCN) “Red List” of endangered species - likewise a benchmark for policy makers - is now also subject to review, they said.
“Based on a mathematical proof and empirical data, we show that previous estimates should be divided roughly by 2.5,” Hubbell told journalists by phone.
“This is welcome news in that we have bought a little time for saving species. But it is unwelcome news because we have to redo a whole lot of research that was done incorrectly.”
Up to now, scientists have asserted that species are currently dying out at 100 to 1,000 times the so-called “background rate,” the average pace of extinctions over the history of life on Earth.
UN reports have predicted these rates will accelerate tenfold in the coming centuries.
The new study challenges these estimates. “The method has got to be revised. It is not right,” said Hubbell.
How did science get it wrong for so long?
Because it is difficult to directly measure extinction rates, scientists used an indirect approach called a “species-area relationship.”
This method starts with the number of species found in a given area and then estimates how that number grows as the area expands.
To figure out how many species will remain when the amount of land decreases due to habitat loss, researchers simply reversed the calculations.
But the study, co-authored by Fangliang He of Sun Yat-sen University in Guangzhou, shows that the area required to remove the entire population is always larger - usually much larger - than the area needed to make contact with a species for the first time.
“You can’t just turn it around to calculate how many species should be left when the area is reduced,” said Hubbell.
That, however, is precisely what scientists have done for nearly three decades, giving rise to a glaring discrepancy between what models predicted and what was observed on the ground or in the sea.
Dire forecasts in the early 1980s said that as many as half of species on Earth would disappear by 2000. “Obviously that didn’t happen,” Hubbell said.
But rather than question the methods, scientists developed a concept called “extinction debt” to explain the gap.
Species in decline, according to this logic, are doomed to disappear even if it takes decades or longer for the last individuals to die out.
But extinction debt, it turns out, almost certainly does not exist.
“It is kind of shocking” that no one spotted the error earlier, said Hubbell. “What this shows is that many scientists can be led away from the right answer by thinking about the problem in the wrong way.”
Human encroachment is the main driver of species extinction. Only 20 percent of forests are still in a wild state, and nearly 40 percent of the planet’s ice-free land is now given over to agriculture.
Some three-quarters of all species are thought to live in rain forests, which are disappearing at the rate of about half-a-percent per year.
AFP, 18 May 2011
Species-area relationships always overestimate extinction rates from habitat loss
Fangliang He & Stephen P. Hubbell
Nature473,368-371(19 May 2011)
Extinction from habitat loss is the signature conservation problem of the twenty-first century1. Despite its importance, estimating extinction rates is still highly uncertain because no proven direct methods or reliable data exist for verifying extinctions. The most widely used indirect method is to estimate extinction rates by reversing the species - area accumulation curve, extrapolating backwards to smaller areas to calculate expected species loss. Estimates of extinction rates based on this method are almost always much higher than those actually observed2, 3, 4, 5. This discrepancy gave rise to the concept of an ‘extinction debt’, referring to species ‘committed to extinction’ owing to habitat loss and reduced population size but not yet extinct during a non-equilibrium period6, 7. Here we show that the extinction debt as currently defined is largely a sampling artefact due to an unrecognized difference between the underlying sampling problems when constructing a species–area relationship (SAR) and when extrapolating species extinction from habitat loss. The key mathematical result is that the area required to remove the last individual of a species (extinction) is larger, almost always much larger, than the sample area needed to encounter the first individual of a species, irrespective of species distribution and spatial scale. We illustrate these results with data from a global network of large, mapped forest plots and ranges of passerine bird species in the continental USA; and we show that overestimation can be greater than 160%. Although we conclude that extinctions caused by habitat loss require greater loss of habitat than previously thought, our results must not lead to complacency about extinction due to habitat loss, which is a real and growing threat. See post.
May 19, 2011
Melting icebergs fertilize ocean
By Janet Raloff
Efforts to remove climate-warming carbon dioxide from Earth’s atmosphere appear to be getting a helping hand from a surprising source: the iron in meltwater from Antarctic icebergs.

Icebergs calving off of Antarctica are shedding substantial iron - the equivalent of a growth-boosting vitamin - into waters starved of the mineral, a new set of studies demonstrates. This iron is fertilizing the growth of microscopic plants and algae, transforming the waters adjacent to ice floes into teeming communities of everything from tiny shrimplike krill to fish, birds and sometimes mammals.
To grow, these plants and animals use carbon drawn into the water from carbon dioxide in the atmosphere. Some share of this carbon will eventually be excreted as wastes that fall to the ocean floor, essentially removing it as a near-term climate risk.
“Icebergs should be considered by climate modelers, because the more icebergs that develop [from the breakup of glaciers], the more carbon dioxide you’ll draw out of the atmosphere,” says Ken Smith of the Monterey Bay Aquarium Research Institute in Moss Landing, Calif.
Smith and colleagues first fingered icebergs as hotspots of biological and chemical activity in a 2007 study published in Science. New data from Antarctic cruises in 2008 and 2009 by Smith and other scientists from nine research institutions now appear as 20 papers in the June Deep Sea Research Part II.
Researchers refer to icebergs’ carbon removal as an export. “And the amount of carbon being exported near icebergs is twice as high as in areas away from them,” Smith says.
Counterbalancing icebergs’ carbon removal: No one views the sea-level rise accompanying massive ice melting as a good thing. The rate of iceberg calving - and ice loss - in recent years has increased there, as elsewhere, in response to warming of Earth’s atmosphere.
Prior to the new studies, “we didn’t know the nature of the biological communities associated with icebergs and we certainly didn’t know their direct relationship to carbon exports,” says chemist Timothy Shaw of the University of South Carolina in Columbia, who coauthored several of the new reports.
One surprise: The proliferation of phytoplankton - tiny plants at the base of the marine food chain - that were witnessed in the waters around ice floes “could only account for about half of the increased carbon export we measured,” Shaw says. His team now attributes the other half to changes in the chemistry of iron and carbon use by phytoplankton living next to and under the icebergs.
Benjamin Twining of the Bigelow Laboratory for Ocean Sciences in West Boothbay Harbor, Maine, points to another big surprise: Icebergs’ iron enrichment of southern waters could vary by a factor of 100 from one iceberg to another, or even along walls of a given berg. This patchy enrichment reflects differences in chemical reactions triggered by various organisms and to the unexpectedly complicated turbulence associated with water melting from the floes.
May 17, 2011
Greenland ice in no hurry to raise seas
By Michael Marshall
Good news is rare when it comes to the Greenland ice sheet. Yet a model that accurately mimics the way the ice responds to rising temperatures by slipping and sliding into the sea suggests the resulting rise in sea levels may be smaller than feared.
In its 2007 forecasts of sea-level rise, the Intergovernmental Panel on Climate Change famously excluded contributions from the Greenland and Antarctica ice sheets because the physics were too poorly understood and complex to model. As a result, the IPCC’s estimate that seas could rise by 18 to 59 centimetres by 2100 is almost certainly too low. Indeed, levels are already rising faster than the models predicted.
Using data from the last decade, Stephen Price of the Los Alamos National Laboratory in New Mexico has shown that his modelled ice sheet moves in the same way as the real one does. In particular, the model accurately reproduces how disruptions to the edge of the ice sheet leads to a large initial movement, which is followed by several decades of smaller movement.
Best guess
Price has calculated that changes which the ice sheet experienced between 1997 and 2007 in response to a thermal disruption in the early 2000s will eventually lead to a rise of 0.6 centimetres. Assuming that similar thermal disruptions happen every decade, the moving ice sheet will raise sea levels by about 4.5 centimetres by 2100 (less than 2 inches).
That is about half of a widely quoted previous estimate of 9 centimetres, calculated by Tad Pfeffer at the University of Colorado at Boulder, and colleagues. But Pfeffer’s study was a worst-case scenario, in which all the processes driving sea-level rise were pushed to their absolute limits (Science, DOI: 10.1126/science.1159099).
Pfeffer says Price’s study is a more plausible estimate of what might actually happen. “They use a much more realistic scenario,” he says, “and their model is really grounded in physics.”
Wonderful leap
The model is “a wonderful leap forward,” says Richard Alley of Pennsylvania State University in University Park. But he says the study does not come up with an upper limit on the sea-level rise, as Pfeffer’s worst-case scenario model did.
“In a warming future the [thermal] perturbations might become bigger, or even more frequent,” he says - something that Price’s model doesn’t consider.
Pfeffer counters that, while the pulses of warm seawater disrupting the ice sheet may well become warmer later in the century as global temperatures rise, that doesn’t necessarily mean they will have a bigger effect on the ice. “The response is dictated by what the glaciers are capable of doing,” he explains. “You can yank the plug out harder but it doesn’t make the water run out any faster.”
Journal reference: Proceedings of the National Academy of Sciences, DOI: 10.1073/pnas.101731310
Of course since we are now a decade into a cooling period, expect the melting and sea level rises to be even less.
May 15, 2011
Missing hot spot
By Joseph D’Aleo, CCM, WeatherBell Analytics
In Joe Bastardi’s recent Weatherbell posts he has mentioned the fact that the middle troposphere has cooled in the recent La Nina. This cooling is normal in La Nina. He has alluded to the fact that the tropical high troposphere is supposed to warm the most, as that is the region of greatest greenhouse gas trapping in the models.
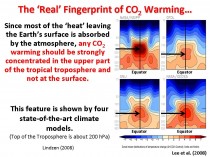
Enlarged.
What does the data show us? The NOAA Angell radiosonde balloon data shows cooling in this critical zone near 200mb in the 20N-20S tropical belt since 1958.
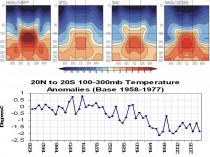
Enlarged.
Some have suggested that the Angell data is an early version and we should use the Hadley upper air compilation. OK this is it. Not as much cooling but no warming in 33 years.
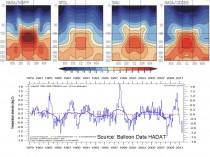
Enlarged.
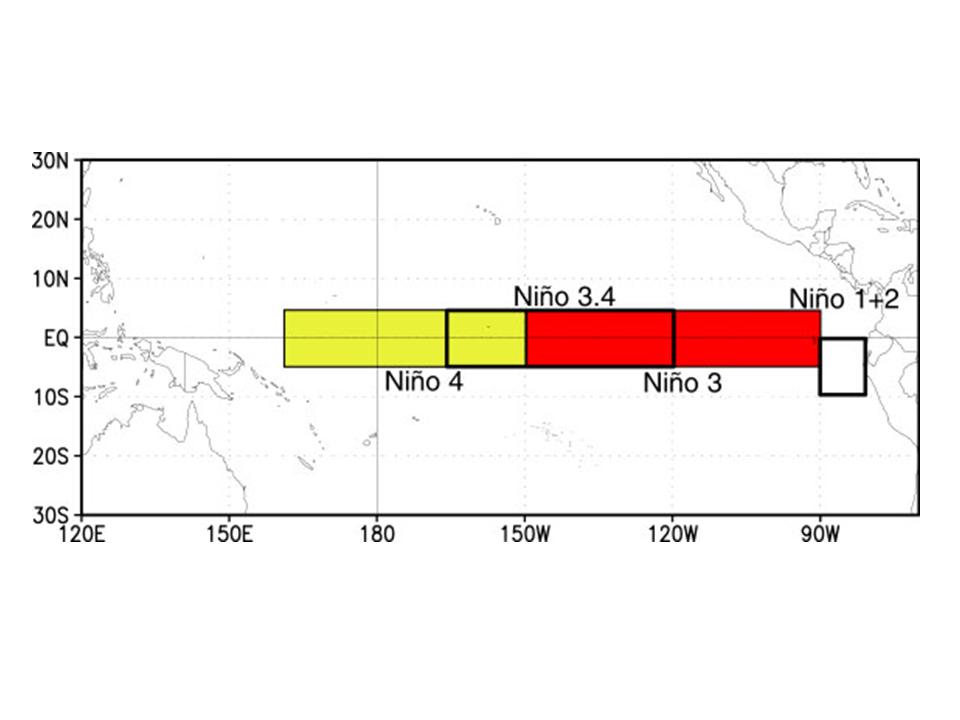
How about the tropical surface? The oceans in the models are supposed to warm from downward returning radiation supposedly trapped in the atmosphere. The central tropical Pacific ENSO regions are well monitored and the data is reliable and uncontaminated by factors like urbanization. Region NINO34 anomalies are used as the ENSO measure.

Enlarged.
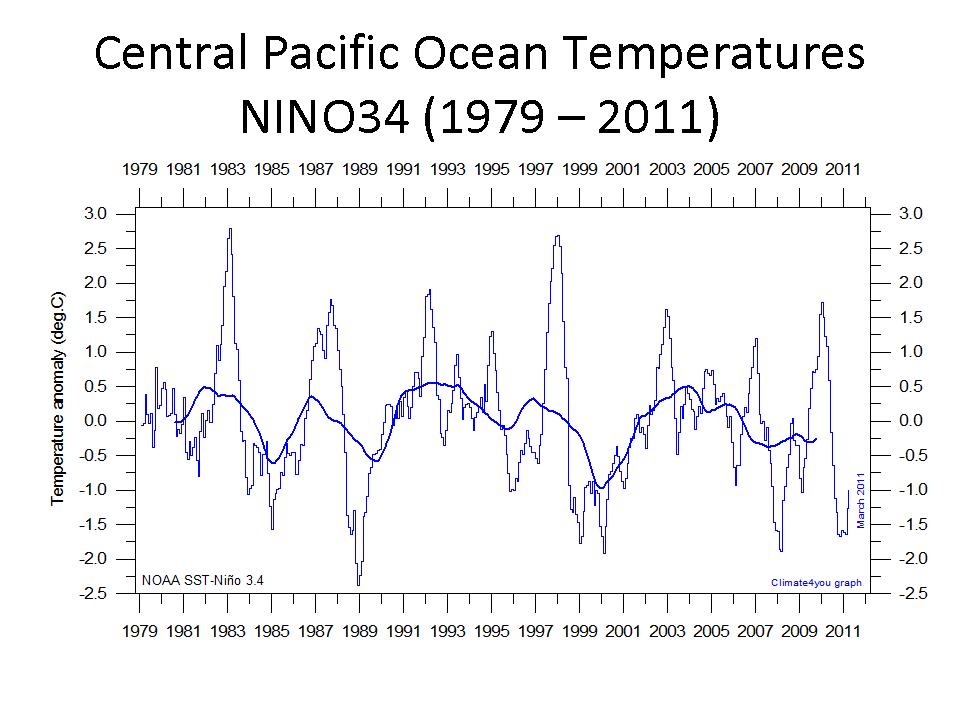
Here is a plot of the NINO34 temperatures.
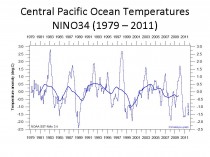
Enlarged.
We see the oscillations up with El Nino and down with La Nina but no real trend since 1979.
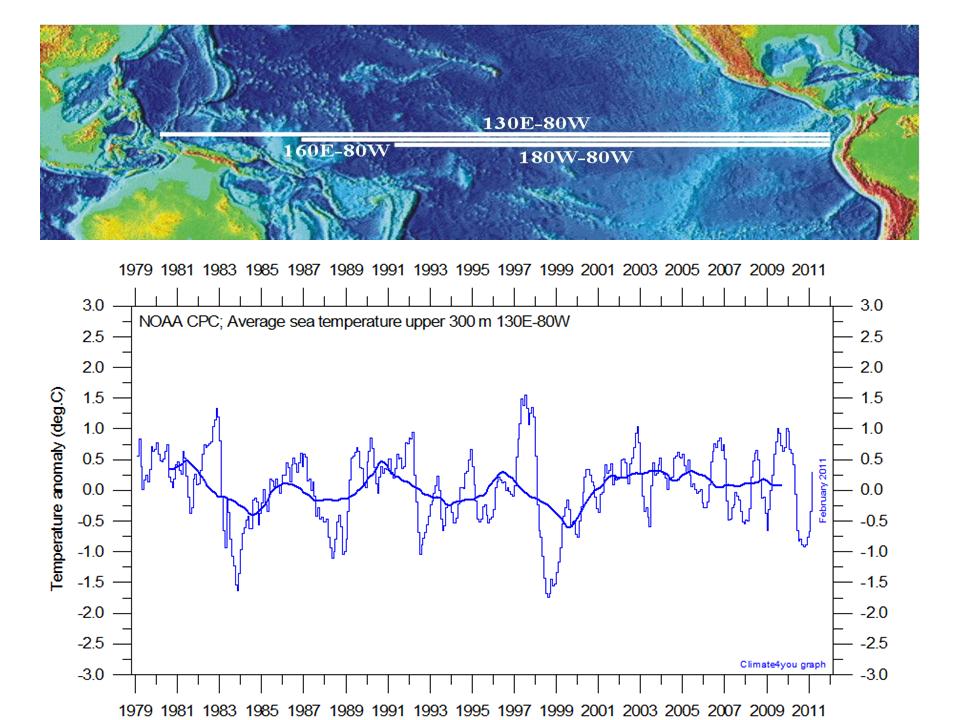
Of course that is the ocean surface data. Surely the heat must be trapped (somehow hiding) beneath. Here is a plot of the NOAA average temperatures in the top 300 meters of the entire tropical Pacific from 130E to 80W. Again a spike with the super El Nino in 1997/98 and the compensating dip with the subsequent La Nina in 1998/99 but overall no trend.

Enlarged.
Where is the beef?
May 12, 2011
Global Warming Fraud Creates Third World Food Crisis
By John O’Sullivan
How saving the planet causes famine: the climate crisis melts away but global food shortage is legacy of the foolish rush to biofuels.
Evidence for dangerous, human-caused global warming was always slim, now it lies cruelly exposed both by a cruel blowback and it’s not just coming from within the science.
A far more devastating catastrophe is unfolding and it is entirely the product of the mad rush to biofuels: third world famine. Today a whopping 6.5 percent of the world’s grain has been stripped from the global food supply. That’s the kind of catastrophic cut in food supply that triggers a tipping point so that Third World hunger explodes into mass starvation. Why did it happen?
Kyoto Protocol: The Trigger to Mass Starvation
What mechanism prompted mankind to instigate this genocide of the world’s poor? The Kyoto Protocol. International governments signed up to the idea that biofuels were going to be the better, cleaner, greener source for mankind’s energy needs in a new utopia predicted for us by ‘experts’ inside the United Nations.
Canadian Geophysicist Norm Kalmanovitch is as concerned as many independent scientists at the alarming rate at which this international food crisis is now escalating.
Kalmanovitch is semi-retired now and not in fear of having his scientific career tarnished by blowback from speaking out. He argues that the facts easily demonstrate that the Kyoto Protocol is based entirely on fraudulent science.
Misguided Climate Scientist Primed the Politicians
Honest scientific inquiry serves the single purpose of advancing human knowledge and understanding free of any bias or ulterior motivation and it is clear that promoting “human caused global warming” a full nine years after the world had already started cooling serves no such lofty purpose.
Kalmanovitch accuses a small clique of self-serving climate researchers for violating the fundamental ethics of science protocol and propagating the false science that made the Kyoto Accord the international vehicle for crimes against humanity. Listening to his arguments you cannot help but see he has a point.
So what was the root catalyst for this cataclysm? Astonishingly, you can pin a lot of it on one well-intentioned but misguided do-gooder. His name: Professor James Hansen. Hansen was NASA’s bright-eyed scientist back in 1988. The eager climate modeler appeared before a Congressional Committee and prophesized that mankind would kill the planet if it continued to burn coal and gasoline at modern industrial rates.
Kalmanovich explains, “When you look closely at the climate change issue it is remarkable that the only actual evidence ever cited for a relationship between CO2 emissions and global warming is climate models.”
Hansen made unfounded and highly alarmist claims based on his computer forecasts. He predicted doomsday scenarios that panicked Congress and that wave of fear stampeded the world into believing in a non-existent crisis. Global temperatures have never rocketed as Hansen forecast. In fact all five global temperature datasets show zero net global warming over the past decade in spite of record increases in CO2 emissions from fossil fuels (climate scientists have now grudgingly conceded no statistically significant rise in temperatures has occurred since 1998 from their doomsaying). But once the stampede was launched it caused a rush to biofuels that stripped millions of crop acreage from the world’s food basket.
But more sickening is that many have made sizeable fortunes from trumpeting a short period of warming that lasted from (1975-1998); a vast international array of speculators in wind, solar, wave and biofuels alternatives are onboard the great global warming gravy train.
Hansen’s friends in the infant science of climatology have also fed well off government grants where the ‘[climate change’ industry generates tens of billions annually in this self-perpetuating Ponzi scheme that symbiotically melded the interests of speculators with climate researchers.
In effect, those great riches and shining scientific careers were together built upon exploiting a 0.6 C rise in temperatures that all but vanished in the first decade of the 21st Century.
Alternative Scientific Views Now Come to the Fore
But since Hansen’s watershed moment in 1988 the science has moved on and many independent scientists, not on the government grant gravy train, have cast their eyes over the numbers for carbon dioxide (CO2), the prime bogeyman of climate alarmism.
From physical measurement of the Earth’s radiative spectrum impartial eyes saw that the 14.77 micron band of the Earth’s thermal radiation accessed by CO2, is so close to saturation that it is a physical impossibility for any increase in that trace gas to have anywhere near the effect claimed.
Analysts then looked back at the natural warming since the 1830’s that ushered in the end of the Little Ice Age, a time 100 years before any scientist claims humans had impact on the climate. They say natural warming in the order of 0.5Centigrade per century. We can calculate this to show that the maximum possible effect from CO2 increases is just 0.1C per century of the claimed 0.6C per century of the observed temperature increase.
Hansen and his self-serving followers in climatology conveniently chose to ignore such inconvenient truths. Kalmanovich seethes,
“They falsely attributed the effect of CO2 to the full 0.6C and incorporated a range of wavelengths from 7 to 14 microns when CO2 only has an effect over a range from 13.5 to 17microns and the wavelength band is at least 80 percent saturated. Though never stated explicitly this formed the basis for the CO2 forcing parameter which Hansen used in his earlier climate models and is still used by the IPCC today with the basic formula of 5.35ln(2) = 3.71watts/m2 for a doubling of CO2.”
Like other independent scientists Kalmanovich saw that the fuss all stems from a 1981 paper by Hansen that was peer reviewed and published in SCIENCE magazine. Here’s where Hansen’s alarmist and skewed climate models captivated scientific literature on the matter. It is by repeated reference to Hansen’s original paper and his 1988 modification of it that the current climate change issue was premised.
In REAL Science Correlation Does not prove Causation
All the other evidence is either of warming or misrepresentations of the greenhouse effect but never of an actual relationship between the two other than a stated correlation stating that CO2 increased and global temperature increased and therefore CO2 caused the global temperature increase.
Kalmanovich’s findings have been corroborated by a group of independent scientists calling themselves the ‘[Slayers’ who claim to have refuted the greenhouse gas effect.
They agree that correlation between temperatures and CO2 is easily refuted and they cite the same numbers used by the IPCC in the 2001 report.
That report shows cyclic warming and cooling trends that are completely out of step with CO2 emissions as explained by Kalmanovich, “it shows rapid warming from 1910 to 1942 with only a trivial 14 per cent increase in CO2 emissions. That is followed by 33 years of a global cooling trend with a 500 percent increase in CO2 emissions from 1942 to 1975.”
Greenhouse Gas Theory Falls Apart
Kalmanovich argues that is more than enough physical evidence to completely destroy the greenhouse gas theory. But that requires the doomsayers to accept numbers and scientific arguments that they have not yet been prepared to do.
The irony of this travesty is that Hansen himself never claims in absolute terms that CO2 emissions cause global warming. Kalmanovich notes, “Hansen instead uses the output from his climate models to make this claim absolving him of having his statements challenged.”
This technique was masterfully employed by Al Gore in his Inconvenient Truth in which he makes no claims directly but shows out of context snippets of evidence to make the claims for him.
Here is Kalmanovich in depth reasoning:
The satellite measurements of outgoing longwave radiation (OLR) demonstrate that OLR is responding strictly to the fourth power of the Earth’s absolute temperature in perfect accordance to basic physics theory, but is in no way responding to the 57.1% increase in CO2 emissions from fossil fuels since 1979. This completely refutes the Kyoto Protocol on Climate Change, which is based on an assumed “enhanced greenhouse effect” from increased greenhouse gas (GHG) emissions, but these satellite measurements demonstrate conclusively that this enhanced greenhouse effect from GHG emissions never actually existed!
This single physical observation makes the Kyoto Protocol completely fraudulent, and anyone promoting the concept of CO2 emissions from fossil fuels enhancing the greenhouse effect in support of this fraudulent Kyoto Accord, must be seen as complicit in this fraud.
Kalmanovich then reaches a devastating conclusion:
“This is not a trivial scientific error because over 6.5% of the world’s grain has been removed from the global food supply to serve as feedstock for the 85 billion litres of ethanol produced annually as fuel in accordance with the dictates of this fraudulent UN Kyoto Protocol on Climate Change.”
It is basic food staples that are being removed from the global food supply; the wealthier portion of the world’s 6.6 billion people end up paying substantially more for their food but the poor simply starve, making this Kyoto Accord a true “crime against humanity” and those who have fabricated the false science on which this crime is based are therefore guilty of being complicit in this “crime against humanity”.
Green Energy Promise Just a Pipe Dream
Americans are fast waking up to the harsh reality that this is all pain for no gain. There is stagnation in constructing conventional power generating sources in the wake of large government subsidies to wind and solar power generating facilities. That has dramatically increased power bills but has provided virtually zero additional peak power to consumers.
There is also a huge moral issue in the US. It removes more food from the global food supply than any other country in the manufacture of ethanol for fuel, making Americans key culprit in this crime against humanity. In the United States a staggering 39.7 percent of the world’s ethanol is created from crops that should be used as food.
The new moral question now to be posed is: if the US government was truly looking after the interests of the people then shouldn’t better investment ought to be made in natural gas and coal conversions to liquid fuels? That would bring the price of gas to under $2.50/gal. President Obama could then do away with subsidizing biofuels production, which only serves to raise the price of gas at the pumps and add to world hunger.
(The 85 billion litres of ethanol production comes from a compelling Marketwire article.
Why is 2011 the Critical Year?
Europe views 2011 as a critical year as member countries ramp up their production and use of ethanol to meet the European Union’s Renewable Energy Directive. In this year alone, Europe is expected to produce 5.4 billion liters of ethanol that is a 15 per cent increase over 2010 (see table).
The Global Renewable Fuels Alliance promotes “biofuels friendly policies internationally and represent over 65 per cent of the global biofuels production from 44 countries.” They predict only growth in this voracious business and if their numbers are correct, a death sentence is being issued on millions more
(Note that these are imperial gallons and not U.S. gallons. This is why the 2010 value of 18,934 million gallons is 85,763 million liters and not 73,653 million liters as would be calculated for US gallons).
In this mad, bad crazy world western good intentions spawned a crime against humanity; the law of unintended consequences turned the Kyoto Accord into a perverse death sentence to millions. Now we must put an end to this genocide.
|

