Feb 20, 2011
The Uncertainties of Averages
By Dr. Vincent Gray, NZCLIMATE TRUTH NEWSLETTER NO 261
Those who provide us with the supposed Mean Annual Global Temperature Anomaly (attached) treat the annual points in their graph as if they were constants. The points on the graph do not represent actual observations. They are processed versions of actual observations and they are subject to statistical uncertainties.
The latest CRU paper to calculate these uncertainties is:
Brohan, P., J J Kennedy, I. Harris, S. F, B, Tett, and P. D. Jones. 2006, Uncertainty estimates in regional and global observed temperature changes: A new data set from 1850. J. Geophys. Res. 111, D12106.doi:1020/2005JD006546.
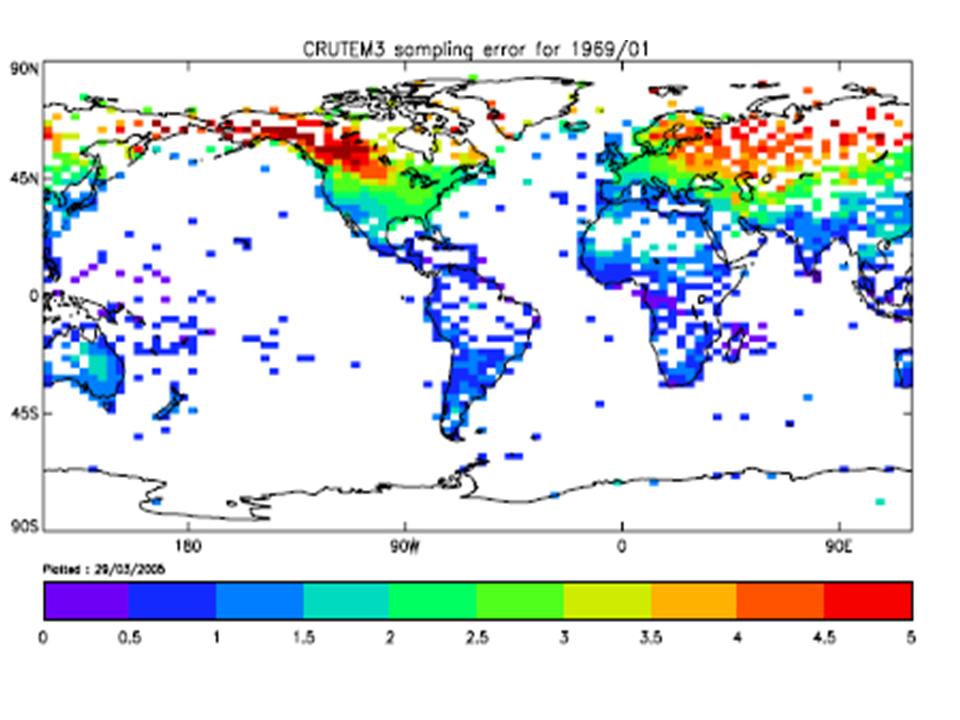
This paper combine many sources of uncertainties and the final figures very from year to year, but are typically about plus/minus 0.2C on a 95% confidence basis. Some versions of their graph include these figures as “error bars” attached to the data points.
Brohan et al even admit that they do not include “Unknown unknowns”, even referring to the internationally recognized expert on this subject, Donald Rumsfeld.

Enlarged. The monthly uncertainties by location in 1969 according the Brohan etal paper. Notice how the greatest uncertainty is in the regions, where the data centers find the greatest warming.
It is surpising that they have left out of their discussions the most important source of uncertainty in their figures, one which is “known” to every person who has studied stratistics. It is the uncertainty which arises every time you take an average.
The actual experimental observations upon which the final figures on the graph are based are the daily measurements of the maximum and the minimum temperature at weather stations all over the world. In order to obtain the annual mean maximum or minimum it is necessary to average 365 daily measurements (366 in a leap year).
According to every one of the several textbooks on statistics that I possess. the equation for obtaining the uncertainty of a single mean is as follows uncertainty is plus/minus txSD/Sqrt of number of observations.
The value for t is obtained form the tables of the t distribution given in the textbooks. For 95% confidence limits and numbers of observations above 50 it is close to 2. The square root of 365 is 19.1.
Kerkin (personal communication) recently downloaded a large number of daily maximum and minimum measurements from the NIWA database and calculated the standard deviation, for two weather stations, Albert Park, Auckland and Te Aroha in the North Island of New Zealand. For Albert Park the SD for the maximum was 3.8C and for the mimimum 3.7C. For Te Aroha the SD for the maximum was 4.8C and for the minimum 5.1C.
I do not know how typical of the whole world these might be, but I expect that for countries with a continental climate the SD figures would be much higher. But, anyway, let us take an SD of 4.3C for he maximum and 4.4C for the minimum and try it in the formula.
The 95% confidence limits for the average are therefore plus/minus 2x 4.3/19.1 = 0.45C for the maximum and 2x 4.4/19.1 = 0.46C.
These figures are about double the uncertainties calculated by Brohan et al from all the other possible sources of error.
It is assumed that the average temperature is the mean of the maximum and the minimum. So you have to add up the individual uncertainties to give those for the mean as plus/minus 0.91C.
But that isn’t all. There is an addtional uncertainty from choosing such a bad method for calculation the average. There are no published figures as far as I am aware of attempts to calculate the error of doing this, or its uncertainty. However, NIWA have published a set of hourly temperature figures from 24 New Zealand weather stations for a typical summer’s day and a typical winter’s day at NIWA 2010 ”Meteorologist for a Day”.
I have calculated, from the 48 figures supplied, the averege difference between the Maximum/Minimum mean and the 24 Hour Mean as 0.2C with a standard deviation of 0.8C.
The 95% incertainty can again be calculated as plus/minus 2 x 0.8/sqrt of 48 which gives plus/minus 0.23C. This is an amount about the same as all the uncertainties calculated by Brohan et all.
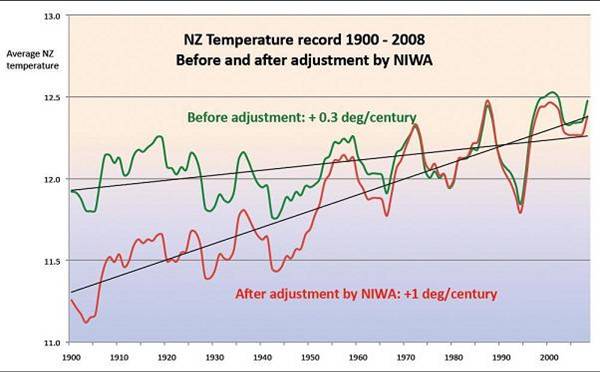
If the 95% confidence limits are all added together you get 0.2+0.45+0.46+0.23 They come to a total of plus/minus 1.34C on each data point. This is well above the 0.9C claimed to be the global, or the New Zealand temperature rise over the last 100 years, which means that this figure has a very low probability of being correct.

Enlarged. This has the NIWA NZ Seven Sisters Stations raw and NIWA adjusted.
Cheers
Vincent Gray
“To kill an error is as good a service as, and sometimes better than, the establishing of a new truth or fact” Charles Darwin as, and sometimes better than, the establishing of a new truth or fact” Charles Darwin”
Feb 19, 2011
What does Climate Data Really Show? The Berkeley Climate Data Project
Dr. Fred Singer
Below is excerpted from the American Thinker
The e-mails leaked from the University of East Anglia in November 2009 produced what is popularly called “Climategate.” They exposed the thoroughly unethical behavior of a group of climate scientists, mainly in the UK and US, involved in producing the global surface temperature record used and relied on by governments.
Not only did these climate scientists hide their raw data and their methodology of selection and adjustment of temperature data, but they fought hard against all attempts by independent outside scientists to replicate their results. They also undermined the peer-review system and tried to make it impossible for skeptical scientists to publish their work in scientific journals. There is voluminous evidence in the e-mails to this effect. In the process, they damaged not only the science enterprise—full publication of data and methods, replication of results, open debate, etc—but they also undermined the public credibility of all scientists.
However, the most serious revelation from the e-mails is that they tried to “hide the decline” in temperatures, using various “tricks” in order to keep alive a myth of rising temperatures in support of the dogma of anthropogenic global warming. There have now been a number of investigations of the activities of this group, mainly in the UK. These have all turned out to be complete whitewashes, aimed to exonerate the scientists involved. None of these investigations has even attempted to learn how and in what way the data might have been manipulated.
Much of this is described in the “Hockey Stick Illusion: Climategate and the corruption of science” by A. W. Montford. Meteorologist Joseph D’Aleo and others have made a commendable effort to show how data might have been altered. But an independent effort to reconstruct the global temperature results of the past century really demands a dedicated project with proper resources.
The Berkeley Earth Surface Temperature (BEST) Project aims to do what needs to be done: That is, to develop an independent analysis of the data from land stations, which would include many more stations than had been considered by the Global Historic Climatology Network. The Project is in the hands of a group of recognized scientists, who are not at all “climate skeptics”—which should enhance their credibility. The Project is mainly directed by physicists, chaired by Professor Richard Muller (UC Berkeley), with a steering group that includes Professor Judith Curry (Georgia Tech) and Arthur Rosenfeld (UC Santa Barbara and Georgia Tech).
I applaud and support what is being done by the Project—a very difficult but important undertaking. I personally have little faith in the quality of the surface data, having been exposed to the revealing work by Anthony Watts and others. However, I have an open mind on the issue and look forward to seeing the results of the Project in their forthcoming publications.
As far as I know, no government or industry funds are involved—at least at this stage. According to the Project’s website www.berkeleyearth.org, support comes mostly from a group of charitable foundations.
Atmospheric physicist S. Fred Singer is Professor Emeritus of Environmental Sciences at the University of Virginia and former director of the US weather satellite service. He is a Senior Fellow of the Independent Institute and the Heartland Institute. He is the author or co-author of Unstoppable Global Warming [2007], Nature not Human Activity Rules the Climate [2008], and Climate Change Reconsidered [2009].
Feb 17, 2011
American Tradition Institute Praises NH Vote to Withdraw from RGGI
By Paul Chesser
The American Tradition Institute today praised yesterday’s overwhelming vote (13-5) by New Hampshire’s House Committee on Science, Technology, and Energy to withdraw the state from the Regional Greenhouse Gas Initiative.
“How appropriate it is that the state with the motto ‘Live Free or Die’ would take the lead in giving citizens back their energy freedom,” said Paul Chesser, executive director of ATI. “Schemes like RGGI and renewable portfolio standards force citizens to buy electricity from expensive, antiquated technology like wind and solar. At least we know now a few legislators have some common sense.”
New Hampshire Watchdog, an online news source, reported that the full House is likely to take the bill up next week. Both chambers of the state legislature, called the General Court in New Hampshire, have veto-proof Republican majorities. Gov. John Lynch is a Democrat and opposes withdrawal from RGGI. NH Watchdog reported that in a hearing, “Committee Republicans argued that the climate science cited to pass RGGI has been undermined, and that the program is a hidden tax on New Hampshire ratepayers.”
“Indeed, there has not been any credible analysis of RGGI to determine whether the benefits of participation outweigh the costs, or even to identify what kind of affect it will have on global climate,” Chesser said. “Isn’t that why they wanted to do this in the first place?”
“If lawmakers want to tax electricity in this manner, then it ought to be transparent and clearly identifiable in their bills,” Chesser added. “But let’s hope that the General Court just does away with it.”
For an interview with American Tradition Institute executive director Paul Chesser, call (202)670-2680 or email paul.chesser@atinstitute.org.
------
Icecap Note: Repealing the Regional Greenhouse Gas Initiative (RGGI)
This upcoming Wednesday, February 23, 2011, the RGGI bill will be voted on by the full House. This legislation, if passed, will remove New Hampshire from participation in the Regional Greenhouse Gas Initiative (A regional Cap and Trade Program). The RGGI has proved to be a massive failure that is serving only to damage New Hampshire’s economic competitiveness; withdrawal can’t come soon enough!
If you are from New Hampshire, we encourage you to contact your legislator today and express your strong support for removing NH from this regional Cap and Tax program. Click here to find your representative and their contact information. New Hampshire residents have already spent $28.2 million in the last two years on this hidden government tax.
Thank you ICECAP supporters for helping us support our efforts in states like New Hampshire. Two Icecap members attended and testified and provided support material to give the Science, Technology and Energy committee the courage to vote 13-5 to repeal RGGI. Your donation, entirely tax deductible will help us do more. We fully expect to be called to testify by state AGs or congressional committees in support of bills limiting the EPA and state initiatives like RGGI. There is usually no funding for the travel expenses involved at least from the government. The mulitmillion dollar NSF grant toting scientists on the other side get their expenses paid by their rent seeking universities for their testimony. Small donations add up. Thanks again and if you can;’t help with donations do what your can within your state or country to battle back against the oportunists who have used this faux issue to line their pockets and want that gravy train to continue.
Feb 15, 2011
Is 2010 the Hottest Ever?
By Steve Goddard, SPPI Exclusive
Dr. James Hansen of NASA’s Goddard Institute for Space Studies (GISS) has announced that 2010 was the “hottest year on record” - by 0.01 degrees. His claim has been widely touted in the press as strong evidence that the climate is rapidly heating - due to human generated CO2 emissions. Dr. Hansen has also stated : “I would not be surprised if most or all groups found that 2010 was tied for the warmest year.”
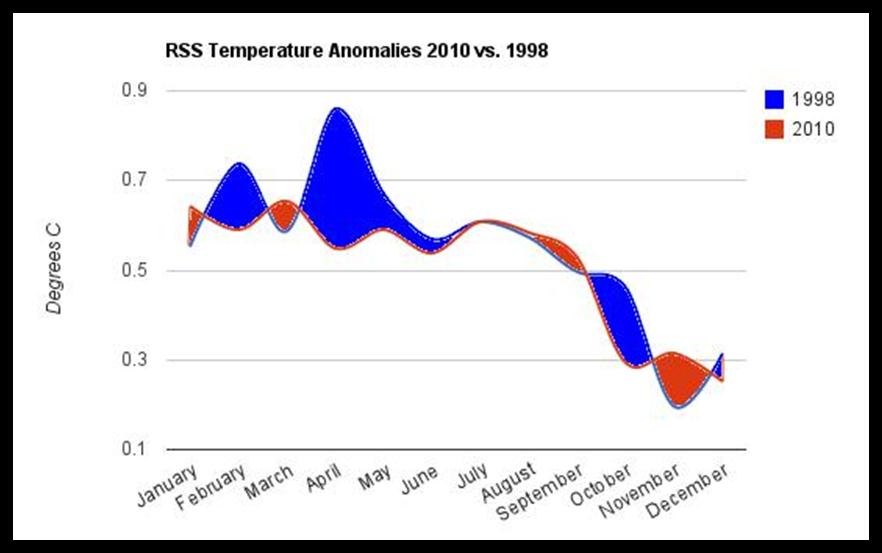
But most groups do not support his claim. The other independent source of surface temperatures HadCRUT, shows 2010 cooler than 1998. The graph below shows the month to month differences. Blue represents months where 2010 was cooler than 1998.
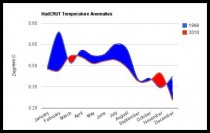
Enlarged.
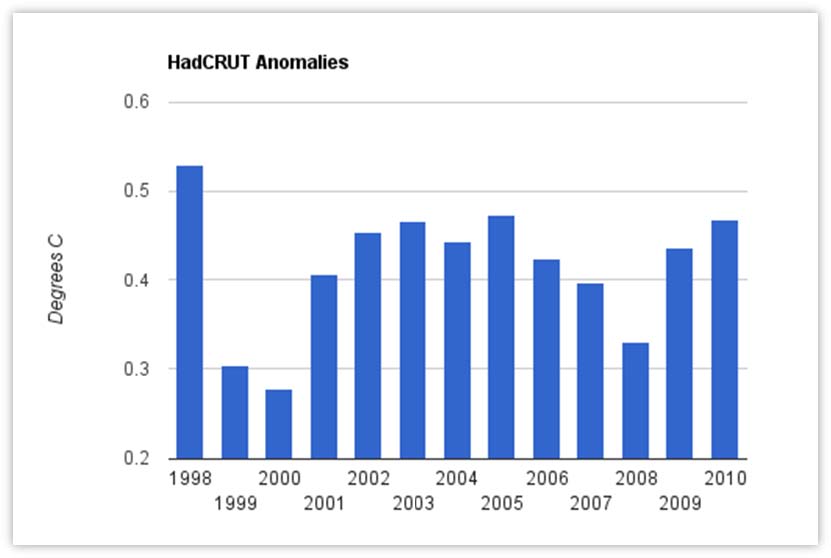
The next graph shows the HadCRUT temperature anomalies for each year since 1998. Last year was not a remarkable year, and was not as warm as 1998.

Enlarged.
Similarly, full year satellite temperatures from RSS show 2010 monthly and annual anomalies lower than 1998.

Enlarged.
Satellite data from UAH also shows 2010 slightly cooler than 1998.
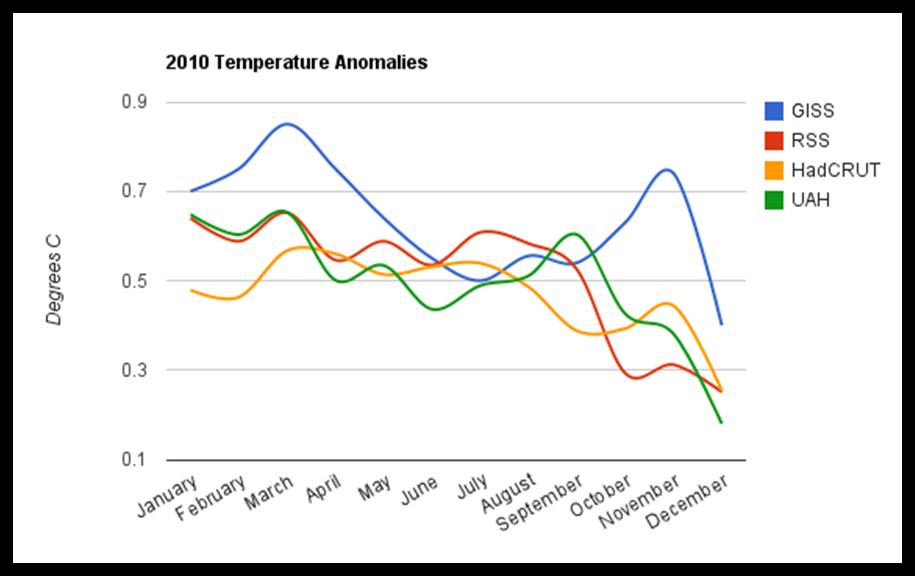
The graph below shows 2010 monthly temperatures for each of the four primary data sets. As you can see, the month-to-month behavior of GISS global temperatures during 2010 was out of kilter with other data sources.
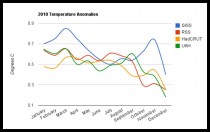
Enlarged.
Note that GISS (blue) showed a large temperature spike in March - which was not seen by others. And from July through November, GISS increased sharply while everyone else showed temperatures dropping - due to a near record cold La Nina. La Nina is indicated by ocean temperatures well below normal across much of the Pacific Ocean.
The November spike was followed in December by the largest month-to-month drop in the 130 year GISS record. What sudden change in the climate could have caused a sharp December drop after four months of rise? A plausible explanation is that the August-November reported GISS temperatures were too high, and that December came back more in line with reality.
NOAA shows that ocean surface temperatures across much of the Pacific have been the coldest on record since July (yet GISS temperatures rose sharply during that time.)
COMPARISONS VS. 1998
The HadCRUT graph below shows that 2010 was not a remarkable year for temperatures, and was cooler than 1998. In fact, HadCRUT also shows that temperatures have not warmed appreciably (if at all) since 1998.
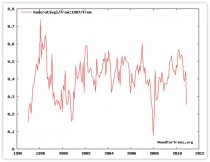
Enlarged.
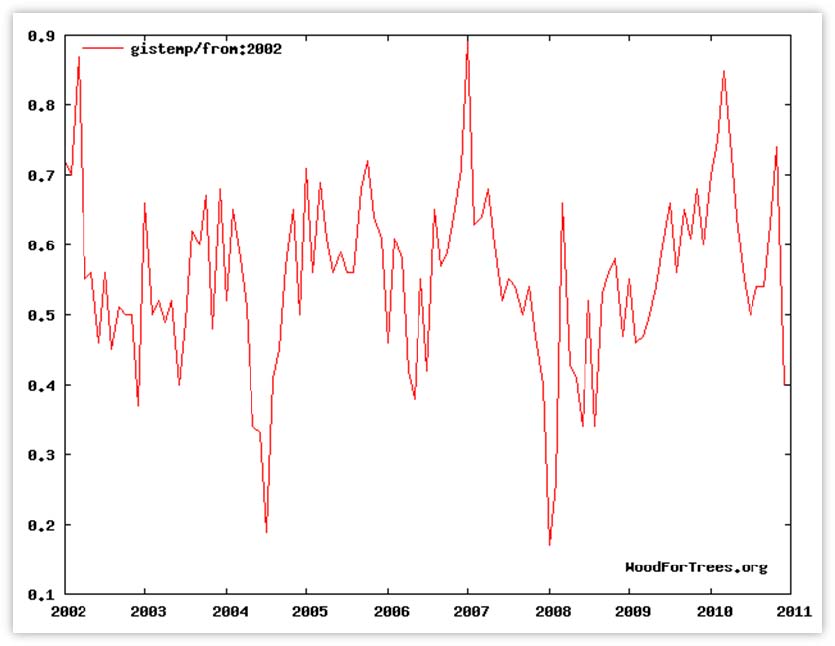
By contrast, Dr. Hansen claims that temperatures have increased steadily since the mid-1970s. “Global temperature is rising as fast in the past decade as in the prior two decades”
However, even his own data shows no significant trend since 1992, and chances are that the GISS January, 2011 anomaly will be one of the lowest of the past decade.
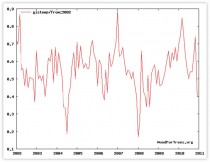
Enlarged.
The UK Met Office explicitly contradicts Dr. Hansen’s claim: “In the last 10 years the rate of warming has decreased.”
See reasons why Hansen is so hot and much more here.
Feb 14, 2011
EPA and APHA testimony to congress about global warming health threat - a critical review
Joseph D’Aleo, CCM, AMS Fellow
The EPA’s Lisa Jackson in her opening statement in front of congress this week said:
“Based on the best peer-reviewed science, EPA found in 2009 that manmade greenhouse gas emissions do threaten the health and welfare of the American people.” [THIS IS A REFERENCE TO the DECEMBER 2009 Endangerment Finding: see links BELOW to select comments submitted to the EPA]
Lynn Goldman of the APHA in testimony stated the following:
“Climate change is already dramatically affecting the health of people around the world especially in the developing world. According to the World Health Organization, an estimated 166,000 deaths and about 5.5 million disability-adjusted life years (DALYs, a measure of overall disease burden) were attributable to climate change in 2000.”
And concluded:
“Growing scientific consensus shows us that the climate is changing in ways that increasingly affect the health of people around the world. Because climate influences how people live, breathe and eat as well as the availability of water, populations everywhere, including the United States, may already be experiencing the health impacts of these changes. This is especially true among our most vulnerable populations, children, the elderly and the poor.
We cannot afford to delay or ignore addressing the health impacts of climate change.”
Reality Check:
Dr. Indur Goklany in Global public health: Global warming in perspective. Journal of American Physicians and Surgeons 14 (3): 69-75 (2009) responded to the quoted report.
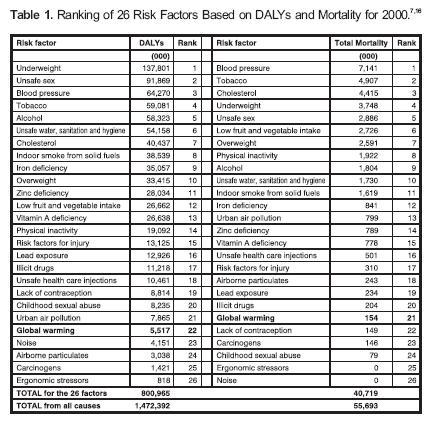
“The methodology used in the WHO reports (Table 1 below, enlarged) to estimate mortality (and burden of disease) from global warming essentially is to assign fractions of deaths occurring from real causes (e.g., diarrhea and malaria) to hypothesized underlying risk factors (e.g., global warming). Thus, malnutrition (hunger) accounted for 52% of the DALYs attributed to global warming; diarrhea (from food and waterborne disease), 26%; malaria, 18%; flooding, 3%. In addition to 154,000 deaths in 2000 from diarrhea, malaria, dengue, flooding, and malnutrition assumed to result from climate change (global warming), the study from which this estimate was obtained added 12,000 deaths from presumed climate-change-induced cardiovascular disease. This estimate of 166,000 deaths in 2000 attributable to global warming was also the basis for the estimate provided in a 2005 review article in, which was then picked up and repeated in various influential publications.
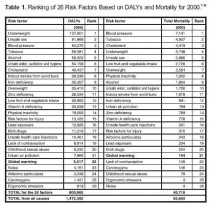
Enlarged.
But these estimates are inherently uncertain, not least because, as noted by the researchers who developed them: Climate change occurs against a background of substantial natural climate variability, and its health effects are confounded by simultaneous changes in many other influences on population health. Empirical observation of the health consequences of long-term climate change, followed by formulation, testing and then modification of hypotheses would therefore require long time-series (probably several decades) of careful monitoring. While this process may accord with the canons of empirical science, it would not provide the timely information needed to inform current policy decisions on GHG emission abatement, so as to offset possible health consequences in the future.
That is, the analysis was guided more by the need to satisfy a policy agenda than rigorous scientific methodology. As a result, as the above quotation implicitly acknowledges, the estimates for global warming are based on, at best, poorly validated models.”
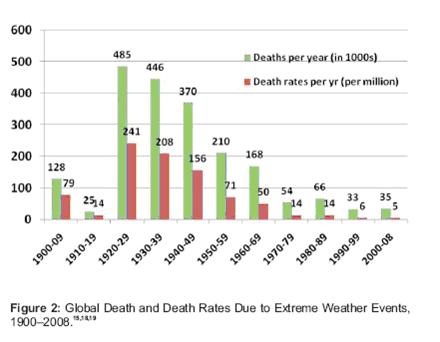
And in Deaths and Death Rates from Extreme Weather Events: 1900-2008. Journal of American Physicians and Surgeons 14 (4): 102-09 (2009), he shows global death and death rates declining (below, enlarged).
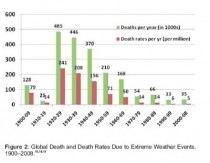
In the study he concludes: “Current deaths and death rates from extreme weather events for both the U.S. and the globe are, in general, lower than in previous decades. Predictably, annual death rates have declined more rapidly than annual deaths, confirming results from previous studies. This indicates that the total risk of death from such events has actually declined, notwithstanding any increases in the number or intensity of extreme weather events that some claim to have occurred. Globally as well as for the United States, the aggregate contribution of extreme weather events to the mortality burden is currently minor - on the order of 0.06%.”
Also see:
Discounting the Future, Regulation 32: 36-40 (Spring 2009).
Is Climate Change the “Defining Challenge of Our Age”? Energy & Environment 20(3): 279-302 (2009).
PDF
Here are some of the comments filed to the EPA on their endangerment finding. Here was a submission that combined many different comments I made to the EPA. Here also is a powerful letter to the EPA signed by 35 scientists that challenged the science used in making their endangerment finding on 18 major points.
|

