Jan 23, 2011
Commentary: Hansen Draft Paper: Paleoclimate Implications for Human-Made Climate Change
By Dr. Martin Hertzberg
As the saying goes:
“If all you have in your hand is a hammer, then everything looks like a nail”.
It is hopeless to expect that Hansen could possibly analyze data objectively - all he has in his head is “CO2 climate forcing” and everything else has to be “forced” into that ridiculous paradigm. It makes no difference to him that the predictions of his past half-baked computer models based on “CO2 climate forcing” were completely wrong.
It is not worth my time (or anyone else’s in my opinion) to try to critique the entire paper, but the final paragraph on his p. 11 stands our like a sore thumb. In it he states:
“Earth orbital (Milankovic) parameters have favored a cooling trend for the past several thousand years, which should be expected to start in the Northern Hemisphere (NH). For example, Earth is now closest to the sun in January, which favors warm winters and cool summers in the Northern Hemisphere.”
Those statements are typical of the misunderstanding in the popular literature of the Milankovic cycles. Since we are now further from the sun in the NH summer, he argues that the NH should get less solar insolation in the NH summer thus “favoring the growth of glaciers and ice-caps in the NH”. So why then we may ask are we now in an Interglacial Warming? What Hansen fails to realize is that when we are further from the Sun in NH summer we move more slowly in orbit, and are therefore exposed to the summer sun for a longer period of time.
From the graphs in the web-site, one can calculate that in 2010 the NH summer half of the earth’s orbit from the Spring Equinox to the fall Equinox lasts 186.1 days. The NH winter half of the orbit lasts 179.0 days. So the summer half gets 7.1 more days of solar insolation than the winter half. (Go to your calendar and count!)
Exposure time in this case is more significant that daily insolation caused by our further distance during the NH summer. And that is why we are in an Interglacial Warming and why Hansen is completely wrong in arguing that we should be “favoring the growth of glaciers and ice-caps in the Northern Hemisphere”.
Now some 10,000 years ago, because of the precession of the Equinoxes, summer and winter would have nearly flipped but with not much change in the earth’s orbital eccentricity. From the same web-site, in the year 8,000 BC, the NH summer half of the earth’s orbit lasted 178.5 days while the winter half lasted 186.6 days, so that the winter half exceeded the summer half by 8.1 days.
So 10,000 years ago the earth was further from the sun during NH winter and it spent a longer time on the winter half of the orbit, thus both effects re-enforced each other to give us a marked Glacial Cooling. (Actually the peak in that Glacial Cooling occurred several thousand years earlier than 8,000 BC.) Today, while we spend a longer time during the NH summer half of our orbit, we are further away in the summer, so the effects tend to cancel, but the longer time exposure is more important than the further distance.
The following discussion from my Chapter 12 of our recently published book “Slaying the Sky Dragon - Death of the Greenhouse Gas Theory” is a more general critique of the Hansen paper. Simply substitute “Hansen” for “Gore”.
The Legend of the Sky Dragon and Its Mythmakers
There is a simple way to tell the difference between propagandists and scientists. If scientists have a theory they search diligently for data that might actually contradict the theory so that they can fully test its validity or refine it. Propagandists, on the other hand, carefully select only the data that might agree with their theory and dutifully ignore any data that disagrees with it.
One of the best examples of the contrast between propagandists and scientists comes from the way the human caused global warming advocates handle the Vostok ice core data from Antarctica (6). The data span the last 420,000 years, and they show some four Glacial Coolings with average temperatures some 6 to 8 C below current values and five Interglacial Warming periods with temperatures some 2 to 4 C above current values. The last warming period in the data is the current one that started some 15,000 to 20,000 years ago. The data show a remarkably good correlation between long term variations in temperature and atmospheric CO2 concentrations. Atmospheric CO2 concentrations are at a minimum during the end of Glacial Coolings when temperatures are at a minimum. Atmospheric CO2 concentrations are at a maximum when temperatures are at a maximum at the end of Interglacial Warmings. Gore, in his movie and his book, “An Inconvenient Truth”, shows the Vostok data, and uses it to argue that the data prove that high atmospheric CO2 concentrations cause global warming.
Is that an objective evaluation of the Vostok data? Let’s look at what Gore failed to mention. First, the correlation between temperature and CO2 has been going on for about half a million years, long before any significant human production of CO2, which began only about 150 years ago. Thus, it is reasonable to argue that the current increase in CO2 during our current Interglacial Warming, which has been going on for the last 15,000 - 20,000 years, is merely the continuation of a natural process that has nothing whatever to do with human activity. Gore also fails to ask the most logical question: where did all that CO2 come from during those past warming periods when the human production of CO2 was virtually nonexistent? The answer is apparent to knowledgeable scientists: from the same place that the current increase is coming from, from the oceans. The amount of CO2 dissolved in the oceans is some 50 times greater than the amount in the atmosphere. As oceans warm for whatever reason, some of their dissolved CO2 is emitted into the atmosphere, just as your soda pop goes flat and loses its dissolved CO2 as it warms to room temperature even as you pour it into the warmer glass. As oceans cool, CO2 from the atmosphere dissolves back into the oceans, just as soda pop is made by injecting CO2 into cold water.
But the real “clincher” that separates the scientists from the propagandists comes from the most significant fact that Gore fails to mention. The same Vostok data show that changes in temperature always precede the changes in atmospheric CO2 by about 500-1500 years.
The temperature increases or decreases come first, and it is only after 500-1500 years that the CO2 follows. Fig 3 shows the data from the termination of the last Glacial Cooling (Major Glaciation) that ended some 15,000 - 20,000 years ago through the current Interglacial Warming of today. The four instances where the temperature changes precede the CO2 curve are clearly shown. All the Vostok data going back some 420,000 years show exactly the same behavior. Any objective scientist looking at that data would conclude that it is the warming that is causing the CO2 increases, not the other way around as Gore claimed. I am indebted to Guy Leblanc Smith for granting permission to use Fig. 3 as it was published in Viv Forbes’ web-site.
It is even more revealing to see how the advocates of the human-caused global warming theory handle this “clincher” of the argument. It is generally agreed that the Vostok cycles of Glacial Coolings and Interglacial Warmings are driven by changes in the parameters of the Earth’s orbital motion about the Sun and its orientation with respect to that orbit; namely, changes in the ellipticity of its orbit, changes in its obliquity (tilt relative to its orbital plane), and the precession of its axis of rotation. These changes are referred to as the Milankovitch cycles, and even the human caused global warming advocates agree that those cycles “trigger” the temperature variations. But the human caused global warming advocates present the following ad hoc contrivance to justify their greenhouse effect theory. The Milankovitch cycles, they say, are “weak” forcings that start the process of Interglacial Warming, but once the oceans begin to release some of their CO2 after 500-1500 years, then the “strong” forcing of “greenhouse warming” takes over to accelerate the warming. That argument is the best example of how propagandists carefully select data that agrees with their theory as they dutifully ignore data that disagrees with it. One need not go any further than to the next Glacial Cooling to expose that fraudulent argument for the artificial contrivance that it really is. Pray tell us then, we slayers of the Sky Dragon ask, what causes the next Glacial Cooling? How can it possibly begin when the CO2 concentration, their “strong” forcing, is at its maximum? How can the “weak” Milankovitch cooling effect possibly overcome that “strong” forcing of the greenhouse effect heating when the CO2 concentration is still at its maximum value at the peak of the Interglacial Warming? The global warmers thus find themselves stuck way out on a limb with that contrived argument. They are stuck there in an everlasting Glacial Warming, with no way to begin the next Glacial Cooling that the data show.
But one has to be sorry for Gore and his friends, for after all, they are in the global warming business. Global cooling is clearly someone else’s job!”
I can think of nothing more inappropriate and insulting to Milankovic than having Hansen speak at a Symposium in his honor.
See SPPI blog here.
Jan 23, 2011
‘Beijing Jim’ Hansen: Sea Level Rise of Many Metres This Century “Almost Dead Certain”
Haunting the Library
You gotta hand it to the guy, despite almost every single one of his prognostications turning out to be wrong, he doesn’t bat an eyelid but just right on going. And they keep letting him.
The latest escapade from Beijing Jim involves a paper he’s writing which says it’s “almost dead certain” that the sea will rise by a multiple number of metres this century. As Treehugger reports:
“[Business as usual] scenarios result in global warming on the order of 3-6C. It is this scenario for which we assert that multi-meter sea level rise on the century time scale are not only possible, but almost dead certain.”
Treehugger. Multi-Meter Sea Level Rise by 2100 Certain with Business As Usual Emissions: James Hansen.
Apparently, Beijing Jim reckons that something called “albedo flip” will speed the process of melting all the ice in the word (including the 90% of the world’s ice in Antarctica, currently chilling at around -40 degrees celsius). For more, you can read the draft paper here.
What’s so touching about the way Treehugger reports this latest paper is the level of doe-eyed trust they seem to still have in him:
James Hansen may be as much as a celebrity as one can be in the world of climate change science, so when he and colleague Makiko Sato say that we’re in for multi-meter sea level rise by 2100 you have to pay attention, even when that prediction falls well outside the range predicted by many other climate scientists.
Isn’t that nice? His predictions for temperature rises with “business as usual scenarios” from 1988 that kicked this whole thing off were miles out, yet still they believe in him, despite what those horrid sceptics say with their insistence on, y’know, verifiable evidence and empirical science rather than a simulation on a computer.

Copies of the draft paper being handed out. See post here.
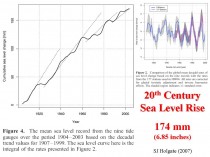
Icecap Note: Beijing Jim in the late 1980s, projected flooding of the West Side Highway and water lapping on the steps of GISS in New York City within 20 years (by 2010). Sea levels have increased a little over an inch over that period. See how sea level rises have diminished gradually the last century here.
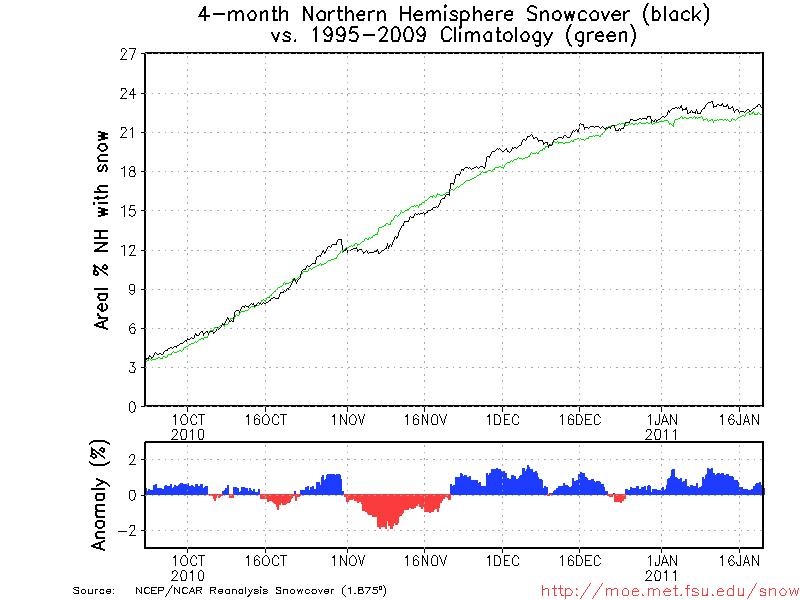
And as for an albedo flip, last year winter Northern hemispheric snowcover was second highest since records began in the 1960s. This winter is again (below, enlarged here) continuously above normal (higher albedo than normal, not lower). The last decade was the highest in the record, no albedo-flipping evident.

Jan 21, 2011
Comments On The AMS Draft Statement “Communicating Science - An Information Statement Of The AMS”
By Roger Pielke Sr.
The American Meteorological Society is soliciting input on their draft statement (h/t to Joe Daleo)
“Communicating Science” An Information Statement of the American Meteorological Society
They have sent out the following
The following draft statement is currently under review by the AMS Council:”Communicating Science”
If you have comment on this draft AMS Statement currently under consideration, you may transmit those comments to the AMS Council by sending a message to the following e-mail address: statement_comments@ametsoc.org before 2 February 2011.
Thanks!
Melissa S. Weston, Executive Officer
American Meteorological Society
45 Beacon Street
Boston, Massachusetts 02108-3693 USA
Phone: 617.226.3904
Web: http://www.ametsoc.org/
I urge readers of my weblog to send in comments. I have excepted a few statements from the draft text for my comments.
The first excerpt that I am commenting on is
“What Is Science?
Science is an enterprise that systematically acquires and organizes knowledge in the form of testable explanations and verifiable predictions about the natural world.”
This is an excellent succinct summary statement of what science is. This is clearly a requirement that multi-decadal climate predictions for the remainder of the 21st century cannot satisfy.
The second excerpt is
“A model is a physical, mathematical, or conceptual framework for describing reality. Most weather and climate models, for example, are sets of equations that represent the principles and conditions that govern the behavior of energy, mass, momentum, and moisture in the atmosphere.”
The statement needs to have added that only the dynamic core of these models (i.e. the pressure gradient force, advection, and gravity) represent basic physics. All other components of these models are parameterizations, which means they are not fundamental physics but engineering code with tunable parameters.
“Modeling will continue to be an essential tool used by scientists for investigation and prediction. Because models are solidly grounded in mathematics and physical observations, and represent a logical description of the system that they are designed to predict, they offer the best and most effective means for testing the consequence of a full range of inputs to a system, from subtle changes to shocks.”
This statement has an important error. Modeling DO NOT “offer the best and most effective means for testing the consequence of a full range of inputs to a system, from subtle changes to shocks”. Models are themselves hypotheses. They cannot be used as a “test” without comparing their predictions with actual observed data.
Real world observations, not models, therefore, are the appropriate means for testing the consequence of a full range of inputs to a system, from subtle changes to shocks! Models can assist in the interpretation of the behavior of the studied system, as well as to make forecasts ONCE the accuracy of their predictions are verified against observed data.
This is clearly a requirement that multi-decadal climate predictions decades from now cannot pass until those decades have occurred.
I discuss this issue in a number of my posts; e.g.
When Is A Model a Good Model?
Recommended Reading - ”What Can We Learn From Climate Models?” By Judy Curry
What Are Climate Models? What Do They Do?
Real Climate Misunderstanding Of Climate Models
The bottom line message is the weather and climate models are not basic physics, but are engineering codes with a core of fundamental physics but with much of the atmospheric, ocean, cryosphere and land represented by tunable engineering code (i.e. their parameterizations).
I urge the AMS statement be modified to correct this misunderstanding concerning models.
See more here.
Jan 19, 2011
NASA lowers cycle 24 predictions again - peak sunspot number now forecast at 59
NASA MSFC
Current prediction for the next sunspot cycle maximum gives a smoothed sunspot number maximum of about 59 in June/July of 2013. We are currently two years into Cycle 24 and the predicted size continues to fall (below, enlarged here).
Predicting the behavior of a sunspot cycle is fairly reliable once the cycle is well underway (about 3 years after the minimum in sunspot number occurs [see Hathaway, Wilson, and Reichmann Solar Physics; 151, 177 (1994)]). Prior to that time the predictions are less reliable but nonetheless equally as important. Planning for satellite orbits and space missions often require knowledge of solar activity levels years in advance.
A number of techniques are used to predict the amplitude of a cycle during the time near and before sunspot minimum. Relationships have been found between the size of the next cycle maximum and the length of the previous cycle, the level of activity at sunspot minimum, and the size of the previous cycle.
Among the most reliable techniques are those that use the measurements of changes in the Earth’s magnetic field at, and before, sunspot minimum. These changes in the Earth’s magnetic field are known to be caused by solar storms but the precise connections between them and future solar activity levels is still uncertain.
Of these “geomagnetic precursor” techniques three stand out. The earliest is from Ohl and Ohl [Solar-Terrestrial Predictions Proceedings, Vol. II. 258 (1979)] They found that the value of the geomagnetic aa index at its minimum was related to the sunspot number during the ensuing maximum. The primary disadvantage of this technique is that the minimum in the geomagnetic aa index often occurs slightly after sunspot minimum so the prediction isn’t available until the sunspot cycle has started.
An alternative method is due to a process suggested by Joan Feynman. She separates the geomagnetic aa index into two components: one in phase with and proportional to the sunspot number, the other component is then the remaining signal. This remaining signal has, in the past, given good estimates of the sunspot numbers several years in advance. The maximum in this signal occurs near sunspot minimum and is proportional to the sunspot number during the following maximum. This method does allow for a prediction of the next sunspot maximum at the time of sunspot minimum.
A third method is due to Richard Thompson [Solar Physics 148, 383 (1993)]. He found a relationship between the number of days during a sunspot cycle in which the geomagnetic field was “disturbed” and the amplitude of the next sunspot maximum. His method has the advantage of giving a prediction for the size of the next sunspot maximum well before sunspot minimum.
We have suggested using the average of the predictions given by the Feynman-based method and by Thompson’s method. [See Hathaway, Wilson, and Reichmann J. Geophys. Res. 104, 22,375 (1999)] However, both of these methods were impacted by the “Halloween Events” of October/November 2003 which were not reflected in the sunspot numbers. Both methods give larger than average amplitude to Cycle 24 while its delayed start and low minimum strongly suggest a much smaller cycle.
The smoothed aa index reached its minimum (a record low) of 8.4 in September of 2009. Using Ohl’s method now indicates a maximum sunspot number of 70 plus/minus 18 for cycle 24. We then use the shape of the sunspot cycle as described by Hathaway, Wilson, and Reichmann [Solar Physics 151, 177 (1994)] and determine a starting time for the cycle by fitting the data to produce a prediction of the monthly sunspot numbers through the next cycle. We find a starting time of May 2008 with minimum occurring in December 2008 and maximum of about 59 in June/July of 2013. The predicted numbers are available in a text file, as a GIF image, and as a pdf-file. As the cycle progresses, the prediction process switches over to giving more weight to the fitting of the monthly values to the cycle shape function. At this phase of cycle 24 we now give 40% weight to the curve-fitting technique of Hathaway, Wilson, and Reichmann Solar Physics 151, 177 (1994). That technique currently gives highly uncertain (but smaller) values.
Note: These predictions are for “smoothed” International Sunspot Numbers. The smoothing is usually over time periods of about a year or more so both the daily and the monthly values for the International Sunspot Number should fluctuate about our predicted numbers. The dotted lines on the prediction plots indicate the expected range of the monthly sunspot numbers. Also note that the “Boulder” numbers reported daily at www.spaceweather.com are typically about 35% higher than the International sunspot number.
Anthony Watts posted on this new forecast and shows how in this remarkable animation, NASA foreecasts have declined and the next peak moved further into the future as the solar minimum lingered.
Previous NASA predictions below:
2010 October: Predicted peak 60-70
2009 May 29: predicted peak: 80-90 range
2009 Jan 5: predicted peak: 100-110 range
2008 Mar 28: predicted peak: 130-140 range
Jan 16, 2011
MetSul: Is the Brazilian catastrophe evidence of another global warming era extreme ?
By Alexandre Aguiar, METSUL, Brazil
See the very detailed flood coverage and commentary on how the media there too claims that the Brazil and Queensland floods and the cold and snow in the Northern Hemisphere are all a product of climate change/disruption from greenhouse gases on the METSUL blog here. Scroll down to see a long story with images and newspaper stories with English commentary.
These days have been complete madness for us. Brazil is facing the worst natural disaster in its history and here in our state we are under a severe drought in some parts and under nearly daily t-storms and flash flooding in the capital city Porto Alegre, where MetSul is based. We manage the city official weather warning system, so these summer heavy downpours became a source of daily concern.
Regarding the catastrophic events in Rio de Janeiro, first of all, this part of Brazil is subject to heavy or extreme rainfall every year, but this time the amount of precipitation was very heavy and in a short period of time, creating an inland tsunami-like torrent. The tragedy happened in the Sierras of Rio de Janeiro and there was a major topographical forcing to the extreme rainfall. As you know so well, topography can induce extreme precipitation under moisture flow from the ocean. The most affected cities are located between mountains as high as 5 to 6 thousand feet and rivers cross these towns, so the only way the water can take is the valley and the rivers.
The major problem is landslide. For many decades Brazilian authorities allowed construction of homes and buildings in the slopes, so every single year landslides with deaths are recorded in the states of Rio, Sao Paulo and Minas Gerais. In the state of Rio de Janeiro, there is massive occupation of the slopes and the hills, so landslides tend to be much more tragic and tragedies much more frequent.

There are anecdotal and historic accounts of extreme rainfall in the state of Rio de Janeiro since Brazil was a Portuguese colony in the 1600’s and 1700’s, but meteorological records are not available for that period. Great tragedies caused by rain and landslides in Rio de Janeiro began mainly in the second half of the 20th century coinciding with the demographical explosion and the massive and unorganized occupation of the hills. The risky areas of today, where the tragedies of the modern times use to happen almost every year, were not occupied 100 years ago, and for that reason the vast majority of the tragic events concentrate in the last 50 years.
DISASTERS IN RIO DE JANEIRO
April 1756 - Three days of heavy rainfall caused flooding, home collapses and “lots of victims” all over the town - still small - of Rio de Janeiro.
February 1811 - Between February 10th and 17th heavy rains caused a “catastrophe” in the city of Rio de Janeiro. Hills collapsed, the city was flooded and landslides were widespread with a torrent of water and mud invading town. Historical accounts tell of many victims, but there is no official number. The regent prince - designated by Portugal - ordered the churches to be open to serve as shelters.
April 1924 - Heavy flooding and landslided with fatalities.
January 1940 - Flooding and landslides in the city of Rio de Janeiro. Santo Cristo district was the most affected.
January 1942 - Flooding and landslides in the city of Rio de Janeiro. The Salgueiro Hill was the the main disaster area.
January 1962 - Heavy flooding and several landslides in the city of Rio de Janeiro after 242 mm of precipitation during a storm.
January 1966 - The storm of January 2nd, 1966, brought record rainfall to the city of Rio de Janeiro. Flooding and massive landslides caused 250 deaths. Other 70 people died after the storm due to diseases.
January 1967 - Heavy rain and landslides provoked the collapses of buildings in the city of Rio. 200 people died and 300 were injured. 300 people died in the states of Rio de Janeiro and Guanabara (today Guanabara and Rio form the state of Rio de Janeiro).
November 1981 - Landslides in the Sierras of Rio kill 20 people in the city of Teresopolis.
February 1987 - Flooding and landslides kill 292 people. The city of Rio de Janeiro and the Sierras of the state concentrate the damages and the victims.
February 1988 - 277 people died in flooding and landslides in the Baixada Fluminense region and in the city of Petropolis in the Sierras. In the rest of the month hundreds more died in new landslides and flooding. A hospital collapsed, killing 18 people. Damages topped 1 billion dollars.
Summer of 1996 - Dozens of deaths in floding and landslides.
Satellite pictures of the most affected areas by the disaster in Brazil taken in 1975 and 2006 show how land occupation changed in 30 years. This disaster would NEVER have this magnitude in the recent past as valleys and slopes were not occupied in the landslides regions 35 years ago. GO HERE. Roll the bar over the photo and click in thumbs below the main picture to see other comparisons. Read and see more on the METSUL blog here.
|

