A paper presented at the American Geophysical Union meeting this week finds that Ellesmere Island in the Canadian High Arctic experienced a “dramatic” Medieval Warming Period from 800-1200 AD with temperatures 2 to 3 degrees C higher than the mean temperature of the past 100 years. Ellesmere Island was also in the news this week due to a discovery of a mummified forest where “no trees now grow” due to its “current frigid state.”
A 5,000 year alkenone-based temperature record from Lower Murray Lake reveals a distinct Medieval Warm Period in the Canadian High Arctic
D’Andrea, W. J.; Bradley, R. S., American Geophysical Union, Fall Meeting 2010, abstract #PP43C-10
Lake-based paleotemperature reconstructions are of particular importance in the Arctic, where other useful archives (e.g., tree rings, speleothems) for developing dense networks of quantitative climate records are absent or limited. Lacustrine alkenone paleothermometry offers a new avenue for investigating the evolution and variability of Arctic temperatures during the Holocene. We have generated a ~5,000 year long, decadally-resolved record of summer water temperature from the annually-laminated sediments of Lower Murray Lake on Ellesmere Island in the Canadian High Arctic. The varved sediments of Lower Murray Lake allowed high-resolution sampling and excellent chronologic control of the sedimentary record. We calibrated the alkenone paleothermometer for Lower Murray Lake using previously published data as well as new data from lakes in Norway and Svalbard, providing a quantitative record of temperature variability for the past 5,000 years. The previously published mass accumulation rate from Lower Murray Lake has been interpreted as a paleotemperature record and provides complimentary information to the new alkenone record. Melt percentage measurements from the nearby Agassiz Ice Cap provide another independent summer temperature reconstruction for comparison. Most strikingly, the alkenone record reveals warm lake water temperatures beginning ~800 AD and persisting until ~1200 AD, with temperatures up to 2-3 deg C warmer than the mean temperature for the past 100 years. This dramatic medieval warm period on Ellesmere Island interrupted a distinct (neoglacial) cooling trend that had begun approximately 2000 years earlier. Furthermore, the three warmest intervals seen in the alkenone record during the past 5,000 years correspond to the periods during which the area was occupied by Paleo-Eskimo groups, providing evidence that local climate conditions played a significant role in determining migration patterns of people of the Arctic Small Tools tradition.
----------
Mummified forest provides climate change clues By Alicia Chang, AP Science Writer
AP Dec 16, 2010: “On a remote island in the Canadian Arctic where no trees now grow, a newly unearthed mummified forest is giving researchers a peek into how plants reacted to ancient climate change.
That knowledge will be key as scientists begin to tease out the impacts of global warming in the Arctic.
The ancient forest found on Ellesmere Island, which lies north of the Arctic Circle in Canada, contained dried out birch, larch, spruce and pine trees. Research scientist Joel Barker of Ohio State University discovered it by chance while camping in 2009.
“At one point I crested a small ridge and the cliff face below me was just riddled with wood,” he recalled.
Armed with a research grant, Barker returned this past summer to explore the site, which was buried by an avalanche 2 million to 8 million years ago. Melting snow recently exposed the preserved remains of tree trunks, leaves and needles.
About a dozen such frozen forests exist in the Canadian Arctic, but the newest site is farthest north.
The forest existed during a time when the Arctic climate shifted from being warmer than it is today to its current frigid state. Judging by the lack of diverse wood species and the trees’ small leaves, the team suspected that plants at the site struggled to survive the rapid change from deciduous forest to evergreen.
“This community was just hanging on,” said Barker, who presented his findings Thursday at the American Geophysical Union meeting in San Francisco.
The next step is to examine tree rings to better understand how past climate conditions stressed plant life and how the Arctic tundra ecosystem will respond to global warming.
Since 1970, temperatures have climbed more than 4.5 degrees in much of the Arctic, much faster than the global average.”
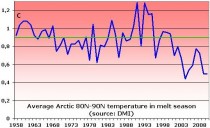
Note: the alarmist claim in the last sentence above from James Hansen/GISS is based upon extrapolated temperatures from sites up to 1000 miles south and is contradicted by data from the Danish Meteorology Institute, which has direct measurements from multiple sites in the high Arctic:
Science Daily 1999 - as posted on Real Science by Steve Goddard
Northern Climes, Buffeted By Stronger Winds, 7 To 10F Hotter
A team of scientists from Columbia University has shown that warm winters in the northern hemisphere likely can be explained by the action of upper-atmosphere winds that are closely linked to global warming.
Global mean surface temperatures have increased in the range of 0.6 to 1.2F since the late 19th century. But far more severe warming has taken place over wide regions of northern Eurasia, Canada and Alaska, with temperatures averaging 7 to 10F warmer in the last 35 years, according to data previously compiled by the NASA Goddard Institute for Space Studies in New York City.
The research, which appears in the June 3, 1999 issue of the British journal Nature, offers no predictions on what temperatures future winters will bring, but suggests a continuation of the current trend for three to four more decades.
If warming trends continue, said Drew Shindell, associate research scientist at Columbia’s Center for Climate Systems Research and lead author of the report, northern regions of Europe and Asia and, to a lesser extent, North America, can expect winters that are both warmer and wetter, with increased rain and snow.
“Based on this research, it’s quite likely that the warmer winters over the continents are indeed a result of the increasing amount of greenhouse gases in the atmosphere,” Dr. Shindell said. “This research offers both a plausible physical mechanism for how this takes place, and reproduces the observed trends both qualitatively and even quantitatively.”
Other authors of the Nature paper were Gavin A. Schmidt, associate research scientist at Columbia’s Center for Climate Systems Research; Ron L. Miller, associate research scientist in the Department of Applied Physics and Applied Mathematics at Columbia, and Lionel Pandolfo, assistant professor in the Department of Earth and Ocean Sciences at the University of British Columbia. Drs. Shindell, Schmidt and Miller also maintain an affiliation with the NASA Goddard Institute.
The physical mechanism the authors suggest is a redistribution of heat closely related to recent changes in atmospheric wind patterns, an indirect consequence of greenhouse warming. Greenhouse gases trap heat at the Earth’s surface, while cooling the stratosphere, a region of the atmosphere that extends from about seven to about 30 miles above the planet’s surface. This cooling has increased the speed of the stratospheric jet stream and has strengthened a lower atmosphere vortex of west-to-east, counterclockwise winds that naturally forms over the polar region each winter.
During the winter, the ocean retains heat better than the land. So when the dominant west-to-east winds increase, they carry warmer air from the oceans to the continents, and colder continental air to the oceans. In North America, the Rockies intercept the warmer winds, so the effect is stronger west of the mountains and is mitigated in central and eastern portions.
The Columbia team used several versions of the NASA Goddard Institute’s general circulation model, a computer construct that predicts the Earth’s climate when certain inputs are varied. Model simulations suggest that much of the increase in surface winds and in continental surface temperatures during the winter months is induced by the buildup of greenhouse gases in the atmosphere. In the model, increasing greenhouse gas emissions lead to a warmer surface and, at the same time, a colder stratosphere. The large wintertime continental temperature increases produced in the model correspond quite well with what scientists actually observe. But when the researchers used a version of the climate model that did not adequately represent the stratosphere, the results did not jibe as well with reality.
Colder polar temperatures in winter, and warmer temperatures in the middle latitudes, are actually part of a natural cycle of climate variability, which made the warming trend more difficult for the scientists to isolate. The temperature differences are reflected in sea-level pressure, which decreases in the Arctic region and increases at the middle latitudes; this cycle is called the Arctic Oscillation and is second only to El Niño in its effects on global weather. In the NASA Goddard Institute simulations, increasing greenhouse gases caused a preference for one phase of this cycle over another, with stronger west-to-east surface winds at the Northern Hemisphere middle latitudes, leading to the increased surface temperatures over land.
“Despite appearing as part of a natural climate oscillation, the large increases in wintertime surface temperatures over the continents may therefore be attributable in large part to human activities,” Dr. Shindell said. “The impact of greenhouse gases on climate through surface wind changes may be as large as, or in some areas larger than, the more direct impact of global warming.”
The research was supported by the National Oceanic and Atmospheric Administration and by the National Aeronautics and Space Administration.
Now alarmists claim that cold winters are caused by the greenhouse effect. The mark of a truly dishonest religion. See Steve’s post here. H/T Marc Morano.
Also see on Watts Up with That here how Climate Central Climate Central confuses weather and climate in spinning the extremes of the last year as very likely the result of greenhouse gas induced climate disruption. Anthony and responders show how these are weather extremes that are not unprecedented and can be explain usually by natural variability.
Millions of people hoping to make an early getaway faced travel misery as the big freeze brought renewed chaos.
All planes were grounded at London’s Heathrow and Gatwick airports.
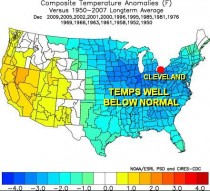
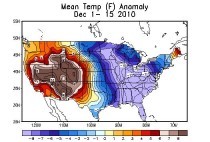
Forecasters warned that Britain was heading for the coldest December on record, with a current average temperature of minus 0.7C - five degrees C (9F) below the long-term average.
Blizzards and plummeting temperatures on Friday night, coupled with heavy snow on Saturday, crippled a huge section of the nation’s road, air and rail networks, with little sign of the situation improving.
The North West of England was hit with deluges of up to 10in of snow causing widespread disruption and accidents on major roads and motorways. Hundreds of motorists found themselves stranded on the M6 in Manchester.
Parts of the south were also blanketed by snow overnight, with fresh falls predicted to dump as much as a foot of snow on parts the South East and the Midlands.
Temperatures dropped as low as minus 13C in Chesham, Buckinghamshire, overnight with thermometers at Gatwick falling to minus 11C. Forecasters say temperatures will struggle to rise above freezing over the course of the day.
Mark Seltzer, a forecaster for the Met Office, said widespread snow would cause treacherous travel conditions. “A lot of snow has fallen across the North West of England overnight but it should ease off during the day,” he said. “A lot of snow also fell in the South West overnight and it will progressively move into the South East and parts of the Midlands and East Anglia throughout the day. “There could be local accumulations of 20-25cm. Temperatures will struggle to get over freezing and although the snow should ease off tonight, it will return to eastern areas on Sunday.”
This weekend had been expected to be the busiest for retailers and commuters in the run-up to Christmas Day, but many people were struggling to leave home in the face of the weather.
Heathrow closed its runways after failing to keep them clear of ice and snow. Earlier thousands of passengers had found themselves trapped on-board their planes on the Tarmac as the airport ran out of parking spaces. Long delays were caused as every plane had to be de-iced before take-off, meaning that there were not enough stands for incoming aircraft and leaving thousands of passengers waiting for up to four hours.
Meanwhile there were claims of “chaos” inside terminals as travellers whose flights were cancelled were told to go home and file lost baggage reports rather than wait for their luggage to be returned from planes. The disruption came during one of the busiest times for the airport, when it handles more than 200,000 passengers a day. British Airways grounded all its flights out of Heathrow until at least 5pm on Saturday. Shortly after both the airport’s runways were closed until 4pm to allow them to be cleared of snow snow clearing.
35,000 Deaths Feared in New Arctic Blizzards By Sarah Westcott, Daily Express
DEATH rates are set to soar “scandalously” this winter as a new Arctic blast batters Britain with temperatures on a par with Siberia.
Experts predict a dramatic increase in cold-related fatalities as we suffer the bitterest winter in a century, causing 12 deaths every hour. Britons face spiralling energy bills while the death toll this winter could reach 35,000.
There are also fears some mail may not reach its destination by Christmas Day because of the freeze. Forecasters said temperatures could plummet to record lows in the run-up to Christmas, putting tens of thousands of vulnerable people at risk.
Charities warned of pensioners suffering “Dickensian” conditions, resorting to riding on buses or huddling in shopping centres just to keep warm. Millions of Britons are being forced to turn down their thermostats as gas and electricity prices spiral.
Jonathan Powell, senior forecaster with Positive Weather Solutions, said icy conditions were on the way back by the middle of next week after a brief weekend thaw. He said plummeting temperatures could even surpass the -27.2C (-17F) recorded in Braemar in 1982 - the coldest temperature in Britain.
Studies show a drop in temperature of just one degree is followed by 200 heart attacks. People aged between 75 and 84 and those with a history of heart disease appear to be most vulnerable. Last year the number of deaths linked to the cold weather reached nearly 28,000 in four months, sparking claims that the UK has the highest winter death rate in northern Europe.
Neil Duncan-Jordan, of the National Pensioners Convention, said: “Rising bills and severe weather are going to put tremendous pressure on older people and we believe last year’s death rate of nine pensioners an hour could go up to 12 every single hour. “It is a scandal that winter deaths are on the increase.”
Jonathan Powell said the prolonged cold snap would leave Britain “the coldest country in the northern hemisphere” and “on a par with Siberia”. Read much more here.
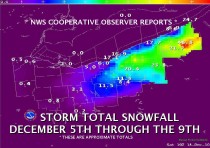
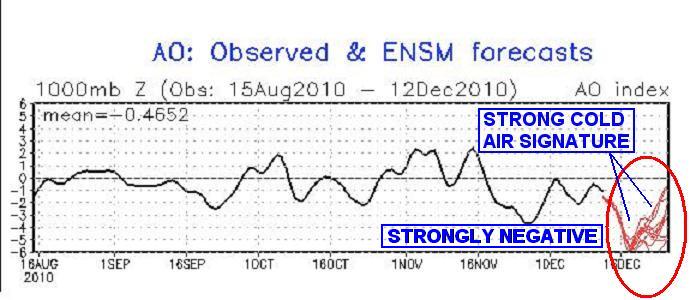
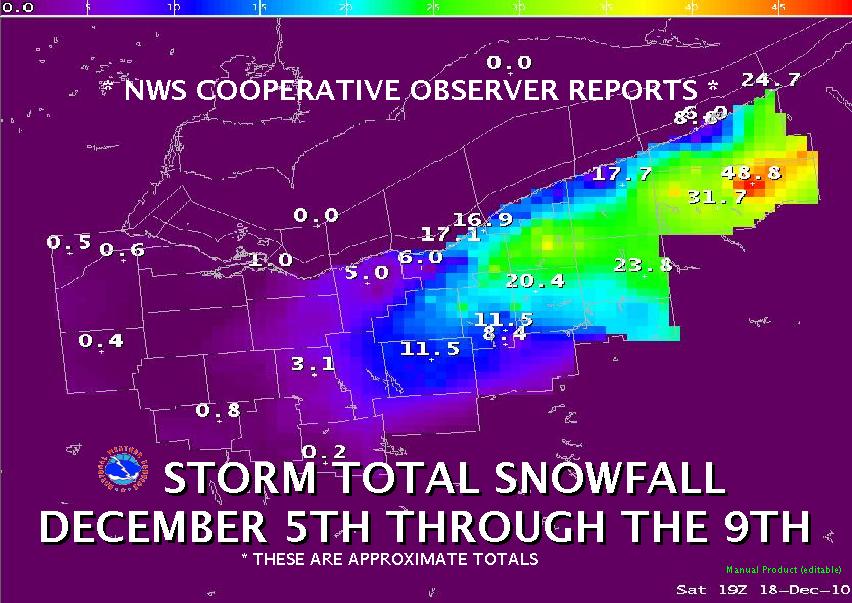
Now that the AO has gone negative this month so far, I check the -AOs below -1 since 1950 and plotted the temperature anomoly for each year. Here is what I found.
Some things are beyond a joke and one of them is our energy secretary Chris Huhne “the Eco Loon”. Short of Osama Bin Laden as Minister of Transport, Caroline Lucas as Business Secretary, and Marcus Brigstocke as Minister for Comedy, it’s really quite hard to think of an appointment that could be less conducive to the welfare of Britain and her people.
But today, the Eco Loon has truly surpassed himself. Today is the day he attempts to persuade parliament that it is somehow in British interests to:
1. Destroy our economy.
2. Send our average annual utility bills soaring to around 2500 pounds per household.
3. Despoil our countryside.
4. Wipe out the free market.
5. Entrench the power of Big Government.
And in this, of course, he has the full support of the Eco Loon In Chief, prime minister David Cameron. In today’s Telegraph Huhne writes:
So on Thursday the Coalition begins a consultation on a reform that would reshape this market more fundamentally than at any time since the 1980s, when the Lawson reforms were the pioneer of Europe’s deregulation. Since then, we have acquired an overlay of instruments - notably the renewables obligation - that has provided a piecemeal response to the need for more secure, low-carbon electricity. By forging a comprehensive response, we can unlock investment in a broader range of low-carbon electricity generation. By providing greater certainty, we can encourage new market entrants and investors, reduce the cost of capital, and provide low-carbon electricity at lower cost than under present policies. Our mix of four inter-locking policies should give greater assurance of decarbonisation and lower bills.
What this achingly dull business-speak drivel means is that the Cameron administration intends to undo some of the fine work achieved by Margaret Thatcher. As Benny Peiser of the Global Warming Policy Foundation puts it:
Thatcher created Europe’s most competitive electricity and gas markets, privatizing state-owned businesses including British Gas, British Energy, National Power and PowerGen. By 1997, the change had driven down consumer prices by as much as 20 percent, compared with pre-privatization costs, according to former British Energy Plc Chief Executive Officer Robert Hawley.
Cameron - true Heir to Blair that he is - thus intends to offer us less choice, more constrained markets and higher prices. Nice one, Dave.
This would be a lot funnier, of course, if it weren’t so serious.
Part of Huhne’s plan calls for the creation of an artificial carbon market in which - following advice from the Committee on Climate Change - the government sets a CO2 floor price which will rise to 27 pounds a ton by 2020. If Britain lived in a bubble this might not be such a problem. Unfortunately the world markets do not believe that CO2 - aka volcano farts; aka plant food; aka Huhne’s breath - is worth anything like as much, or indeed that there is any prospect of it ever acquiring such value without the kind of global agreement which post- the Copenhagen and Cancun debacles is just never going to happen. Two years ago, C02 was trading on the Chicago exchange (CCX)at $7 a tonne. Earlier this year it was down to 7 cents a tonne. Then the exchange - founder investors: A Gore; Goldman Sachs; etc - stopped trading this worthless entity altogether.
In other words, what Chris Huhne and David Cameron are asking British business to accept is a swingeing impost which fines companies at 27 pounds a tonne for an (almost inescapable) by-product for which our global competitors are charged nothing at all. I don’t think any of us have much objection to Chris Huhne’s insatiable urge to be the first lemming over the cliff. What is of concern is the fact that currently he has been granted the power to drag us all over with him.
Every week, every day almost, I post in these pages about the economic and ecological disaster which awaits Britain if it goes ahead with Huhne’s and Cameron’s insane proposals to “decarbonise” the British economy at a cost conservatively estimated at 18 billion pounds a year. What depresses me almost as much as the sheer bloody uselessness of the Coalition is the bloody uselessness of my colleagues in the Fourth Estate (even the notionally “conservative” or free market ones) in opposing its wilder idiocies.
Huhne’s energy plans are absurd and destructive and wrong on so many levels it almost beggars belief that they are not regularly the butt of TV comedy sketches, outraged newspaper Op Eds and furious protests everywhere from the City to all those parts of the British countryside about to be ruined by Huhne’s 500 foot high bird choppers (aka Hoo Sticks). I shan’t rehearse them all again here. But just to show you how barmy the whole business is, here is Matt Ridley in the Times explaining why solar and wind power don’t even make sense on Huhne’s own terms of “energy security” and eco-friendliness:
For a glimpse of a truly scary future dependent on volatile suppliers look no farther than Mr Huhne’s favoured approach, the dash for wind. Every wind turbine has a magnet made of a metal called neodymium. There are 2.5 tonnes of it in each of the behemoths that have just gone up to spoil my view in Northumberland. The mining and refining of neodymium is so dirty (involving repeated boiling in acid, with radioactive thorium as a waste product), that only one country does it: China. This year it flexed its trade muscles and briefly stopped exporting neodymium from its inner Mongolian mines. How’s that for dangerous reliance on a volatile foreign supply?
Besides, wind does nothing to reduce carbon emissions. As Robert Bryce shows in his book Power Hungry, even Denmark, which can switch off imported Norwegian hydro power when the wind spins its many turbines, has failed to save any significant net carbon emissions through wind. The intermittent nature of the wind means that fossil-fuel power stations have to be kept going, or inefficiently powered up and down. Besides, the total power produced from even the biggest wind farms is so small that, as a strategy for reducing carbon emissions significantly, wind power is a failure.
Yes, gas has carbon in it, but half as much as coal for each unit of energy. So a dash for gas to replace coal would dramatically and rapidly reduce carbon emissions. Given Mr Huhne’s nuclear allergy, it is probably by far the most effective and low-cost way to do so. Solar is expensive (and strangely inefficient at night); tidal destroys ecosystems; wave is an engineering nightmare; there is no room for more hydro; and biofuels use just as much fossil fuel in their production as they produce in “green” fuel.
Shale gas has environmental risks - the water and chemicals used in the hydraulic “fracking” process must be safely disposed of - but environmental benefits too. Unlike renewables it is not land-hungry, taking up remarkably little space. A typical shale gas well has a footprint one 3,000th of the size of woodland producing the same amount of energy in firewood. Unlike coal and biofuels, it does not require transport by road and rail as it can be piped. Unlike oil, it cannot spill (and though it can explode, it rarely does). Unlike coal, its turbines work at small scale almost as efficiently as at large scale, so power stations can be many and local, supplying heat as well as electricity. It can be burnt near where people need power, requiring less investment in ugly pylons and transmission lines. Unlike coal it does not emit sulphur, mercury or other pollutants.
I can think of one consolation and one consolation only about the presence of a dangerous zealot like Chris Huhne in Cameron’s cabinet. Even more so than our useless justice minister Ken Clarke, his presence in government is such an affront to reason, so blatant an upraised middle finger to all those decent people who just want Britain to get back on its feet economically and begin undoing all the damage that was done to Britain by Cameron’s hero Tony Blair, that I suspect he may prove the undoing of the entire Coalition.
In Cameron’s cosy circle of spoiled toffs it of course matters not one jot whether your electricity bill is 250 or 2500 or, frankly, 25,000. It doesn’t matter if your view is ruined by a field of ruddy great wind turbines (not if say your father in law is Sir Reginald Sheffield who stands to make large sums of money from “farming” that intermittent wind). It doesn’t even seem to matter what happens to all those businesses, small ones especially, which are going to be crippled by these artificially-induced energy price increases: not when in Cameron’s circles the only people who really matter are either in-the-loop corporate fat cats whose larger companies can more easily wear the extra costs or City bankers heavily exposed to “green energy” interests.
To the rest of us, though, these things are going to start mattering more and more.


