Oct 13, 2010
Roger Cohen Responds to APS response to Hal Lewis Resignation
APS response to Hal Lewis with responses from Dr. Roger Cohen to APS
Dr. Hal Lewis resigned from the American Physical Society (APS) in a strong letter in response to the APS’s intransigent position on climate change, most notably their position that it “The evidence is incontrovertible”. Over 1,920,000 google stories were linked to this letter as of this morning. The APS responded with a strongly worded press release (below), which Dr. Roger Cohen of the APS has added his comments (below each APS comment in italics).
October 12, 2010 FOR IMMEDIATE RELEASE
Contact: Tawanda W. Johnson
Press Secretary
American Physical Society
529 14th St. NW, Suite 1050
Washington, DC 20045-2065
202-662-8702
tjohnson@aps.org
APS Comments on Harold Lewis’ Resignation of his Society Membership
WASHINGTON, D.C. - In a recent letter to American Physical Society (APS) President Curtis A. Callan, chair of the Princeton University Physics Department, Harold Lewis, emeritus physics professor at the University of California, Santa Barbara, announced that he was resigning his APS membership.
In response to numerous accusations in the letter, APS issues the following statement:
There is no truth to Dr. Lewis’ assertion that APS policy statements are driven by financial gain. To the contrary, as a membership organization of more than 48,000 physicists, APS adheres to rigorous ethical standards in developing its statements. We know that the existing 2007 APS Statement on Climate Change was developed literally over lunch by a few people, after the duly constituted Committee had signed off on a more moderate Statement.
The Society is open to review of its statements if members petition the APS Council - the Society’s democratically elected governing body - to do so.
We have yet to receive a response to our Petition, delivered last spring and signed by 260+ members and former members, including nearly 100 Fellows, 17 members of national academies and 2 Nobels. Driven largely by the ClimateGate revelations, the Petition asks that the Society conduct an independent study and assessment.
As for democratic membership participation in matters of science, consider the reaction to a grass roots outpouring of APS member opinion on the 2007 APS Statement . “[APS Councilor] was uncomfortable with the idea of a membership-wide referendum on statements. He said that he was concerned that having a membership wide vote on controversial issues could lead to the adoption of scientifically unsound statements.” Evidently physicists should be excluded from inputting on a question of physics; only “physics monks” are entitled to do so ex cathedra.
Dr. Lewis’ specific charge that APS as an organization is benefitting financially from climate change funding is equally false. Neither the operating officers nor the elected leaders of the Society have a monetary stake in such funding. The chair of the Panel on Public Affairs (POPA) that re-endorsed the 2007 APS Statement on Climate Change sits on the science advisory board of a large international bank
The bank has a $60+ billion Green portfolio, which it wishes to assure investors is safe...not to mention their income from carbon trading. Other members of this board include current IPCC chief Pachauri and Lord Oxburgh, of Climategate exoneration fame. The viability of these banks activities depends on continued concern over CO2 emissions . Then there is the member of the Kleppner Committee (that reviewed the APS 2007 Statement prior to POPA) who served on that committee while under consideration for the position of Chief Scientist at BP. The position had been vacated when Steve Koonin left to take a post in the administration at DOE. Soon after the Kleppner Committee report in late 2009, this committee member took the BP job. BP had
previously funded the new Energy Laboratory at Berkeley, which was headed by current Energy Secretary Steve Chu. Moreover, relatively few APS members conduct climate change research, and therefore the vast majority of the Society’s members derive no personal benefit from such research support.
This does not mention the firm expectation by federal government agencies such as the NAS and the Presidential Science Advisor’s office that the APS will continue to support the huge funding machine that diverts billions of taxpayer dollars into research that must support the alarmist credo. APS has been silent on the documented practice by some climate scientists aimed at preventing opposing research from being published.
On the matter of global climate change, APS notes that virtually all reputable scientists agree with the following observations:
· Carbon dioxide is increasing in the atmosphere due to human activity;
· Carbon dioxide is an excellent infrared absorber, and therefore, its increasing presence in the atmosphere contributes to global warming; and this passes over the fact that carbon dioxide absorption lines are nearly saturated.
· The dwell time of carbon dioxide in the atmosphere is hundreds of years.
Well, it depends on what you mean by “dwell time.” If it is the conventional half life of an impulse loading of carbon dioxide, the statement is wrong - by a lot.. The IPCC’s Bern carbon cycle model gets a 16 year half life. If it is the time for the last molecule to get picked up by a sink, the statement is meaningless. At the very least, the statement is sloppy and hardly befitting a world class scientific society.
On these matters, APS judges the science to be quite clear. However, APS continues to recognize that climate models are far from adequate, and the extent of global warming and climatic disruptions produced by sustained increases in atmospheric carbon loading remain uncertain.
This is much better than the 2007 APS Statement itself. However, the phrase “climate disruptions” is noteworthy because it is the new buzzword recently introduced by Science Advisor John Holdren is-dead-long-live-er-global-climate-disruption/, evidently enabling advocates to assign any unusual weather event to human causes. It is curious that that the APS press release happens to echo this new phrase.
In light of the significant settled aspects of the science, APS totally rejects Dr. Lewis’s claim that global warming is a “scam” and a “pseudoscientific fraud.”
What we have here is a bait and switch. No one is saying that the greenhouse effect itself is a scam. This passage seeks to transfer the ‘scam’ charge from its real target to the trivial. The fraud/scam is to be found in the continual drumbeat that the science is settled; that the effects will be catastrophic; that it requires draconian economic sacrifices to avoid; and that mandates and subsidies for rent-seeking corporations are justified. Additionally, APS notes that it has taken extraordinary steps to solicit opinions from its membership on climate change. After receiving significant commentary from APS members, the
Society’s Panel on Public Affairs finalized an addendum to the APS climate change statement reaffirming the significance of the issue. The APS Council overwhelmingly endorsed the reaffirmation.
Never mind that the Panel on Public Affairs is chaired by an individual whose research funding stream (from BP) depends on continued global warming alarm. And you have to keep your eye on the pea. The dispute was not over the “significance” of the issue; it was over the alarmist nature of the statement. The addendum used more than five times the number of words to try to explain what the original statement meant. Not a good sign that they got it right the first time.
Lastly, in response to widespread interest expressed by its members, the APS is in the process of organizing a Topical Group to feature forefront research and to encourage exchange of information on the physics of climate.
Never mind that the Topical Group was proposed in a petition organized by a group of five members that included Dr. Lewis. Also, the Council has not yet approved a TG; therefore it is not in the process of being “organized.” It is being considered. No formal charter or bylaws have been set down. What we have here is the first attempt to co-opt the TG for PR purposes. This before it has even been approved by the APS Council.
Read the APS Climate Change Statement and Commentary here.
APS should be very reluctant to draw public attention to this Statement, with its infamous phrase, “The evidence is incontrovertible,” despite the fact that nothing in science is ever incontrovertible.
About APS: The American Physical Society (www.aps.org) is the leading physics organization, representing 48,000 members, including physicists in academia, national laboratories, and industry in the United States and internationally. APS has offices in College Park, MD (Headquarters), Ridge, NY, and Washington, DC.
Oct 13, 2010
Drilling go-ahead in Gulf criticized
By Kara Rowland, Washington times
The Obama administration on Tuesday said it would lift the deep-water drilling moratorium it imposed after the massive BP oil spill, but Gulf of Mexico region lawmakers and industry advocates said the stiffer new rules that the government is imposing will leave rigs idle and workers out of jobs for months longer.
While government officials billed the new policy as a cautious yet pragmatic response to the worst oil spill in the nation’s history, environmental groups accused the White House of caving to political pressure three weeks before the midterm elections.
Interior Department Secretary Ken Salazar said a slate of new government rules on drilling and spill containment has reduced the risks of another spill, enabling him to lift the moratorium, which local leaders say has ravaged the region’s economy and sent jobs overseas. The ban was originally scheduled to end Nov. 30, weeks after the election.
“At this point, we believe the strengthened safety measures we have implemented, along with improved spill-response and blowout-containment capabilities, have reduced risks to a point where operators who play by the rules and clear the higher bar can be allowed to resume,” Mr. Salazar said.
Under the new government rules, drill-rig operators must submit to extensive physical inspections, provide detailed projections of a worst-case spill scenario and certify that rig workers are properly trained. Drilling companies’ top executives also must certify they have complied with the new rules - a way of imposing personal responsibility for their companies’ activities.
Mr. Salazar predicted he would draw criticism from both sides of the issue. He was right.
“Today’s decision is a good start, but it must be accompanied by an action plan to get the entire industry in the Gulf of Mexico back to work,” said Sen. Mary L. Landrieu, Louisiana Democrat, a fierce critic of the moratorium. “This means that the administration must continue to accelerate the granting of permits in shallow and deep water, and provide greater certainty about the rules and regulations industry must meet.”
Mrs. Landrieu said the announcement does not go far enough for her to release her legislative hold on Jacob Lew, President Obama’s nominee to be the new White House budget director. Likewise, Gulf State Republicans warned the new rules could create a bureaucratic bottleneck by being too onerous for drilling operators to comply with, saying it could be several months before their new applications are approved.
“It’s clear that President Obama is going to preside over a continuing de facto moratorium for months or years, with new drilling held back to a fraction of previous levels,” Louisiana’s other senator, David Vitter, said.
The pro-industry Institute for Energy Research said the move amounted to a “permitorium” on deep-water drilling.
“Today’s announcement is about politics and headlines, not getting folks back to work and increasing domestic energy exploration and production in the United States,” IER President Thomas J. Pyle said. “What was announced today will result in no change in domestic energy production in the Gulf of Mexico until Interior Secretary Salazar begins to issue permits once again. In the meantime, thousands of Gulf Coast families will continue to be out of work. It can’t be explained any other way.”
Mr. Salazar said he based his decision on a report by Michael Bromwich, director of the Bureau of Ocean Energy Management, Regulation and Enforcement, which laid out a series of recommendations on how to improve the safety of drilling in the wake of the April 20 explosion of the Deepwater Horizon oil rig off the coast of Louisiana.
Asked by reporters how long it will take the 36 oil rigs that were affected by the moratorium to come back online, Mr. Bromwich said it’s anybody’s guess, but that the timeline depends mostly on how long it takes firms to ensure they are in compliance with the new rules.
“It will clearly not be tomorrow, and it is not going to be next week,” he said, adding that it’s “my sense that we will have permits approved by the end of the year.”
Greenpeace USA criticized the administration as capitulating to “big oil.”
“This is pure politics of the most cynical kind. It is all about the election season, not safety and environmental concerns. The White House wants us to believe that they have solved all the dangers of offshore drilling and we can return to business as usual. It is a false promise, if not a big lie,” Executive Director Philip Radford wrote in an article on Huffington Post on Tuesday.
But White House press secretary Robert Gibbs insisted that political pressure had nothing to do with Mr. Salazar’s announcement, calling it “part of the natural policy process” that resulted from the government’s months-long review of deep-water drilling safety.
The ban drew a series of legal challenges from drilling companies and state governments, with varying degrees of success.
A judge blocked Mr. Salazar’s first attempt, announced in May, to halt drilling in waters deeper than 500 feet. Judge Martin L.C. Feldman said the ban was unjustified and that it appeared to have been prompted more by politics than science.
Mr. Salazar withdrew that first moratorium and replaced it with another one, which he said was tailored specifically to high-risk drilling rigs. But drillers challenged the new ban, too, arguing it applied to exact the same number of rigs, suggesting the second ban was purely meant to sidestep the court’s ruling.
On Tuesday, Mr. Salazar submitted a request telling Judge Feldman the moratorium has been lifted and asking him to keep that in mind as he considers what to do with the case.
Stephen Dinan contributed to this article.
Oct 09, 2010
Dangerous Carbon Pollution: Propaganda from Climatism
by Steve Goreham
In an address to Green Mountain College on May 15, Carol Browner, Director of Energy and Climate Change Policy, stated “The sooner the U.S. puts a cap on our dangerous carbon pollution, the sooner we can create a new generation of clean energy jobs here in America...” In July, 2009, President Obama lauded the “Cash for Clunkers” program, stating that the initiative “gives consumers a break, reduces dangerous carbon pollution, and our dependence on foreign oil....” Unfortunately, our President is misinformed about carbon pollution.
The phrase “dangerous carbon pollution” has become standard propaganda from environmental groups. An example is a May, 2010 press release from the World Wildlife Fund that called for “a science-based limit on dangerous carbon pollution that will send a strong signal to the private sector.”
Environmentalists have successfully painted a picture of black particle emissions into the atmosphere. This misconception is being used to drive efforts for Cap & Trade legislation, renewable energy, and every sort of restriction on our light bulbs, vehicles, and houses. All in the misguided attempt to stop climate change.
Carbon is integral to our skin, our muscles, our bones, and throughout the body of each person. Carbon forms more than 20% of the human body by weight. We are full of this “dangerous carbon pollution” by natural metabolic processes.
It’s true that incomplete combustion emits carbon particles that can cause smoke and smog. But this particulate carbon pollution is well controlled by the Clean Air Act of 1970 and many other federal and state statutes.
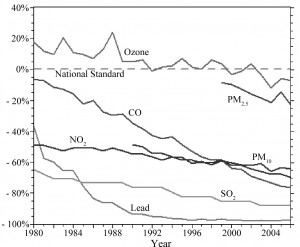
According to Environmental Protection Agency data, U.S. air quality today is significantly better than it was in 1980. Since 1980, airborne concentration of carbon monoxide is down 79%, lead is down 92%, nitrogen dioxide is down 46%, ozone is down 25%, and sulfur dioxide is down 71%. Carbon particulates have been tracked for fewer years, but PM10 particulates are down 31% since 1990 and PM2.5 particulates are down 19% since 2000. Over the same period, electricity consumption from coal-fired power plants rose 72% and vehicle miles driven are up 91%. We do not need Cap & Trade, Renewable Portfolio Standards, or the California Global Warming Solutions Act (AB32), to reduce carbon particulates. Graph below, enlarged here.
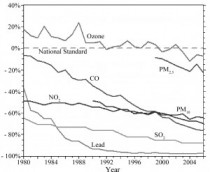
Climatism! Science, Common Sense, and the 21st Century’s Hottest Topic, Figure 78, data from EPA, 2006
The target of “dirty carbon pollution” propaganda is carbon dioxide. Carbon dioxide is an invisible, odorless, harmless gas. It does not cause smog or smoke. Humans breathe out 100 times the CO2 we breathe in, created as our body uses sugars. But since it’s tough to call an invisible gas “dirty,” Climatists use “carbon” instead. It’s as wrong as calling water “hydrogen” or salt “chlorine.” Compounds have totally different properties than their composing elements.
Not only is carbon dioxide not a pollutant, it’s essential for life. As pointed out by geologist Leighton Steward, carbon dioxide is green! Carbon dioxide is plant food. Increased atmospheric CO2 causes plants and trees to grow faster and larger, increase their root systems, and improve their resistance to drought, as documented by hundreds of peer-reviewed scientific papers. Carbon dioxide is the best compound that mankind could put into the atmosphere to grow the biosphere.
This “carbon pollution” nonsense is driven by Climatism, the belief that man-made greenhouse gases are destroying Earth’s climate. In a debate at the Global Warming Forum at Purdue University on September 27, Dr. Susan Avery, President of the Woods Hole Oceanographic Institution, was asked “What is the strongest empirical evidence that global warming is caused by man-made greenhouse gas emissions rather than natural causes?” Neither Dr. Avery nor Dr. Robert Socolow of Princeton, who also presented, could provide an answer, except the ambiguous “There is lots of evidence.” In fact, Climatism is based largely on computer model projections. There is no empirical evidence that man-made greenhouse gases are the primary cause of global warming. According to Dr. Frederick Seitz, past President of the National Academy of Sciences, “Research data on climate change do not show that human use of hydrocarbons is harmful. To the contrary, there is good evidence that increased atmospheric carbon dioxide is environmentally helpful.”
As Joanne Nova, Australian author, points out: “Everything on your dinner table - the meat, cheese, salad, bread, and soft drink - requires carbon dioxide to be there. For those of you who believe carbon dioxide is a pollutant, we have a special diet: water and salt.” So the next time you drink a beer or eat a meal, beware of that “dangerous carbon pollution.”
Steve Goreham is Executive Director of the Climate Science Coalition of America and author of Climatism! Science, Common Sense, and the 21st Century’s Hottest Topic.
Oct 08, 2010
Dr. Ryan N. Maue’s 2010 Global Tropical Cyclone Activity Update
By Dr. Ryan Maue, Florida State University on SPPI
Update: Current Year-to-Date analysis of Northern Hemisphere and Global Tropical Cyclone Accumulated Cyclone Energy (ACE) AND Power Dissipation Index (PDI) has fallen even further than during the previous 3-years. The global activity is at 33-year lows and at a historical record low where Typhoons form in the Western Pacific.
While the North Atlantic has seen 15 tropical storms / hurricanes of various intensity, the Pacific basin as a whole is at historical lows! In the Western North Pacific stretching from Guam to Japan and the Philippines and China, the current ACE value of 48 is the lowest seen since reliable records became available (1945) and is 78% below normal*. The next lowest was an ACE of 78 in 1998. See figure below for visual evidence of the past 40-years of tropical cyclone activity.
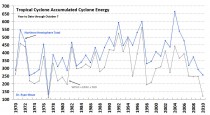
Figure: Year-to-Date (October 7) Accumulated Cyclone Energy (ACE; units: 104 knots2) (enlarged here) for the Northern Hemisphere as a whole (top blue time series) and for the combination of the Western North Pacific (WPAC), Eastern Northe Pacific (EPAC), and Northern Indian (NIO) basins (bottom gray time series). The difference between the two lines is therefore the contribution of the North Atlantic hurricane basin. Similar figure for Power Dissipation Index (units: 106 knots3)
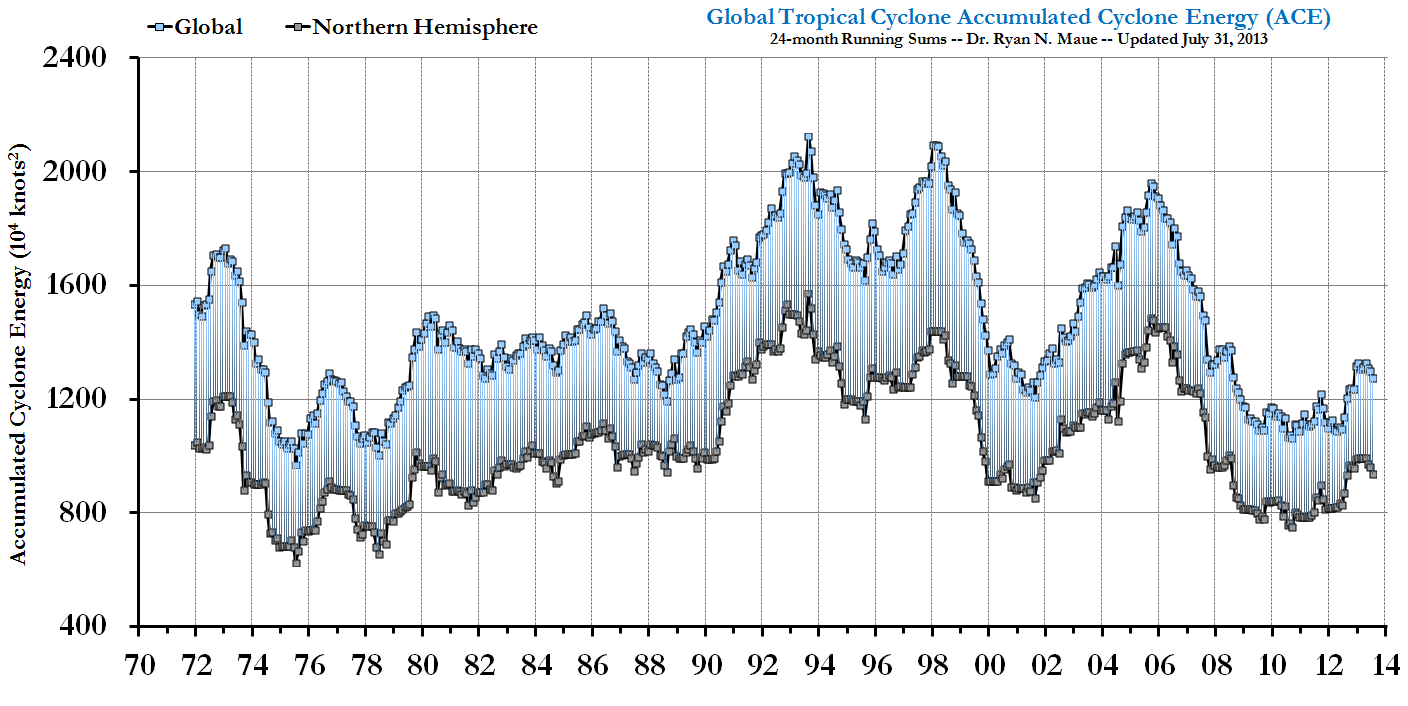
End of September update: The North Atlantic flurry dominates the Northern Hemisphere ACE contribution. But the lack of Pacific activity keeps the NH and global ACE still at 33-year lows. Basins with respect to previous 30-year-to-date averages: Western Pacific 25% Eastern Pacific 44% North Atlantic 164% Northern Hemisphere 63%
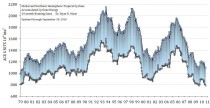
Figure: Global and Northern Hemisphere Accumulated Cyclone Energy: 24 month running sum (enlarged here) through September 30, 2010. Note that the year indicated represents the value of ACE through the previous 24-months for the Northern Hemisphere (bottom line/gray boxes) and the entire global (top line/light blue boxes). The area in between represents the Southern Hemisphere total ACE.
Read more here.
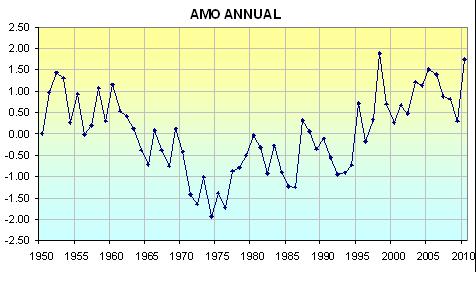
Icecap Note: The Atlantic as expected was more active than usual (164% as of end of September) thanks to the warm Atlantic and La Nina. The upper pattern though have prevented landfall although remnants of Nicole ran up the east coast with flooding rains and gusty winds. It was deemed by NHC extratropical at that time its tropical moisture contributed to the flooding rains.
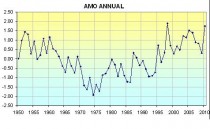
Figure: Annual average AMO (enlarged here)
Update:
“While the North Atlantic has seen 15 tropical storms / hurricanes of various intensity and duration, the Pacific basin as a whole is at historical lows! In the Western North Pacific stretching from Guam to Japan and the Philippines and China, the current ACE value of 48 is the lowest seen since reliable records became available (1945) and is 78% below normal. The next lowest was an ACE of 78 in 1998. The Northern Hemisphere overall (including zthe North Atlantic) has the lowest ACE since 1977, the year of the Great Climate Shift and flip in the phase of the Pacific Decadal Oscillation.”
Note on the EPAC: Typically EPAC activity begins to drop off considerably after the middle of October, and there is nothing currently on the horizon to suggest that a new EPAC TC is in the works. It is very possible that there will be no more named TCs in that basin this season. If so, this will be least active season in terms of number of named storms since 1964. Since 1971, the year in which the best track database is considered somewhat reliable, the lowest number of named storms has been 8, in 1977, a year famous for very low levels of TC activity across the entire Northern Hemisphere. The stats for this season so far are 7 NS, 3 H, and 2 IH.
Note on WPAC: Only 13 named storms so far, less than the Atlantic, and no super typhoons. This basin account for 30% of the annual TC activity. Normal for this basin is 32 named storms!
Oct 07, 2010
Kiwigate is a Carbon Copy of Climategate
John O’Sullivan for SPPIblog
New Zealand climate scientists embroil themselves in as much of a climate data fraud scandal as Climategate and with eerily similar methods and results.
The New Zealand Climate Science Coalition (NZCSC) in its article ‘NIWA Challenged to Show Why and How Temperature Records Were Adjusted’ (February 7, 2010) provides its readers with an insight into the climate scandal dubbed ‘Kiwigate.’
NIWA is New Zealand’s National Institute of Water and Atmospheric Research and is accused of repeatedly frustrating NZCSC in its attempts to get government climatologists to explain how they managed to create a warming trend for their nation’s climate that is not borne out by the actual temperature record.
According to NZCSC, climate scientists cooked the books by using the same alleged ‘trick’ employed by British and American doomsaying scientists. This involves subtly imposing a warming bias during what is known as the ‘homogenisation’ process that occurs when climate data needs to be adjusted.
Homogenisation Explained
When such data adjustments (homogenisations) are made, scientists must keep their working calculations so that other scientists can test the reasonableness of those adjustments. According to an article in Mathematical Geosciences (April 2009) homogenisation of climate data needs to be done because “non-climatic factors make data unrepresentative of the actual climate variation.”
The article tells us that if the raw data is not homogenised (or, in this case, “fudged” according to sceptics) the “conclusions of climatic and hydrological studies are potentially biased.”
According to the independent inquiry into Climategate chaired by Lord Oxburgh, it was found that it was the homogenisation process itself that became flawed because climatologists were overly guided by “subjective” bias.
Andrew Bolt, writing for Australia’s Herald Sun (November 26, 2009) commented that the Kiwigate scandal was not so much about “hide the decline” but “ramp up the rise.”
Jim Salinger: Another ‘Phil Jones’?
Bolt goes on to report, “Those adjustments were made by New Zealand climate scientist Jim Salinger, a lead author for the Intergovernmental Panel on Climate Change (IPCC).” Salinger was dismissed by NIWA this year for speaking without authorisation to the media.
Salinger once worked at Britain’s CRU, the institution at the centre of the Climategate scandal.
Salinger became part of the inner circle of climate scientists whose leaked emails precipitated the original climate controversy in November 2009. In an email (August 4, 2003) to fellow disgraced American climate professor, Michael Mann, Salinger stated he was “extremely concerned about academic standards” among climate sceptics.
Circling The Bandwagons?
NZCSC made a joint press release with the Climate Science Conversation Group (December 18, 2009) accusing NIWA of publishing, “misleading material.” The two organisations claim that NIWA had been “defensive and obstructive” in requests to see New Zealand climate scientists’ data.
NZCSC goes on to report, “The main objective of our temperature study was not to show that the raw data has been tampered with, even though that opinion was emphasised and cannot yet be excluded.”
On January 29, 2010, in what seemed like a reprise of the Phil Jones debacle at Britain’s Climate Research Unit, the Kiwi government finally owned up that “NIWA does not hold copies of the original worksheets.”
Kiwigate Mimics Climategate
Kiwigate appears to match Climategate in three essential characteristics. First, climate scientists declined to submit their data for independent analysis. Second, when backed into a corner the scientists claimed their adjustments had been ‘lost’. Third, the raw data itself proves no warming trend. Thus we may reasonably infer a ‘carbon copy’ of Climategate.
NZCSC explained their frustrations in trying to get to actual truth about what had happened with New Zealand’s climate history, “NIWA did everything they possibly could to help us, except hand over the adjustments. It has turned out that there was actually nothing more they could have done - because they never had the adjustments. None of the scientific papers that NIWA cited in their impressive-sounding press releases contained the actual adjustments.”
After a protracted delay NIWA was forced to admit it has no record of why and when any adjustments were made to the nation’s climate data. Independent auditors have shown that older data was fudged to make past temperature appear cooler, while modern data was inexplicably ramped up to portray a warming trend that is not backed up by the actual thermometer numbers.
Sceptics are asking how can it be that climate scientists in different countries at the opposite side of the world are facing extraordinarily similar data fraud allegations?
Unsatisfactory Outcome
The world is left with more questions than answers. Website,’Scoop’ echoed the sentiments of other climate sceptics by arguing that because New Zealand’s climate data adjustments cannot be verified (peer-reviewed) like CRU’s, then they are thus just as worthless.
With so many climatologists having ‘lost’ their calculations, no one can now replicate their methods and confidence in climate science has evaporated.
In addition, further scandalous revelations with Glaciergate and other ‘gates’ have mired the IPCC in an alleged international data fraud conspiracy that undermines the entire theory of man made climate change.
The knock-on effect worldwide is a fall away in voters’ concerns about ‘global warming’ issues so that international governments are losing their mandate for cap and trade taxes to reduce greenhouse gas emissions from fossil fuels.
References:
Bolt, A. ‘Climategate: Making New Zealand warmer,’ Herald Sun (November 26, 2009), accessed online April 26, 2010.
Costa, A.C. and A. Soares, ‘Homogenization of Climate Data: Review and New Perspectives Using Geostatistics,’ Mathematical Geoscience, Volume 41, Number 3 / April, 2009.
New Zealand Climate Science Coalition, ‘NIWA Challenged to Show Why and How Temperature Records Were Adjusted’ (February 7, 2010), accessed online April 26, 2010.
NZCSC & Climate Science Conversation Group; Press Statement of December 18, 2009; accessed online ( April 26, 2010).
Salinger, J. Climategate email Filename: 1060002347.txt. (August 4, 2003).
See SPPI blog here.
See this detailed report on KIWIGATE here.
|

