Sep 06, 2010
Why We Blink In Face Of Eco-Terror
Investors Business Daily
Extremism: An environmental activist inspired by Al Gore’s “An Inconvenient Truth” takes hostages at the Discovery Channel headquarters. This isn’t the latest example of eco-terrorism, just the latest to be ignored.
It got wide play when union boss Richard Trumka accused Sarah Palin of inciting violence every time she speaks. President Obama recently accused Fox News host Glenn Beck of “stirring up” a “certain portion” of the American people with his “Restore Honor” rally. Gender orientation and “sexual identity” were recently added to the hate crimes list.
Yet those who say man is a plague upon the earth, ravaging its resources, exterminating its endangered species and heating it into oblivion are never accused of inciting anything when those who hear their words respond by marching into an office building to save the earth at gunpoint.
The gunman who entered the Discovery Channel headquarters was killed after he entered with a handgun and what were believed to be explosive devices, took three hostages and pointed his gun at one of them. He identified himself as James J. Lee and said, “I have a gun and I have a bomb. ... I have several bombs strapped to my body ready to go off.”
In a rambling manifesto, Lee echoes the writings of President Obama’s science adviser, John Holdren, railing against “disgusting human babies” and “parasitic infants” and insisting people should “disassemble civilization.” His manifesto demanded that the Discovery Channel cease all programming about war, weapons or giving birth.
Court records show that Lee had been arrested on Feb. 21, 2008, on the sixth day of a protest at the Discovery building. Lee said at the time that he experienced an “awakening” when he watched former Vice President Al Gore’s environmental documentary ‘’An Inconvenient Truth.” Lee has said he was also inspired by “Ishmael,” a novel by environmentalist Daniel Quinn. “Nothing is more important than saving ... the Lions, Tigers, Giraffes, Elephants, Froggies, Turtles, Apes, Raccoons, Beetles, Ants, Sharks, Bears and, of course, the Squirrels. The humans? The planet does not need humans,” he wrote.
As scary as this sounds, it is scarier to consider that this sentiment can be found in various forms in the bibliography of what is considered mainstream environmentalism.
In a recently rediscovered book, “Ecoscience: Population, Resources, Environment,” co-authored with Malthus fans Paul and Anne Ehrlich, Holdren, who holds the post of presidential assistant for science technology, revealed his similar pessimistic and apocalyptic views on all three topics. They are disturbing.
Like Lee, Holdren hates people and views them as the root of all planetary evil. Big families are a target of Holdren and the Ehrlichs, who write that they “contribute to general social deterioration by overproducing children” and “can be required by law to exercise reproductive responsibility.”
Eco-terror groups such as the Earth Liberation Front and the Animal Liberation Front have long advocated violence, including arson and bombings, to save the earth and critters on it from the plague known as mankind. From firebombing ski resorts to torching medical labs, these environmental terrorists have been very active.
ELF’s Web site at one point offered pointers on “Setting Fires With Electric Timers.” The ALF posted commentary boasting that its “attacks on medical research continue today” and are aimed at producing “millions of dollars worth of damages and delays in the development of new treatments and cures.”
People must die, in their view, to save Bambi.
Of course, no one will blame Al Gore for inciting hate and violence. No one will worry about a vast left-wing conspiracy to save the planet at all costs or that James Lee’s extremist views are almost identical to those of the president’s science adviser.
Hate comes only from the right, and when you’re saving the earth, the end justifies the means. Neither human lives nor human freedom can stand in their way. H/T Climate Depot
-------------
Time for Rajendra Pachauri to go
New Scientist Opinion
THE Intergovernmental Panel on Climate Change (IPCC) is in need of fundamental reform. Its organisation is outdated, and it has failed to follow many of its own procedures, a high-level review of the panel’s activities reported this week (see “Climate panel must ‘fundamentally reform’ to survive").
A central recommendation is that to encourage new thinking, senior management should only be allowed to serve for a single term. That amounts to a call for the panel’s chair, Rajendra Pachauri, to step down.
He should go soon. Pachauri has spent too much effort defending the indefensible, in particular when it emerged that the IPCC’s last report contained serious mistakes.
Those who strive to cast doubt on the reality of climate change will doubtless be delighted by his departure. But keeping Pachauri in place would undermine efforts to rebuild the panel’s authority, even if other recommended reforms are implemented.
When the IPCC’s governing body meets in South Korea next month, it should seek a new chair - preferably a scientist of stature from outside the climate research establishment. That will give it the best chance of re-establishing the credibility it must have. See post here.
Sep 04, 2010
A cunning bid to shore up the ruins of the IPCC
By Christopher Booker, UK Telegraph
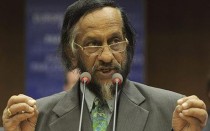
Dr Rajendra Pachauri, chairman of the Intergovernmental Panel on Climate Change Photo: EPA
A report on the UN’s Intergovernmental Panel on Climate Change, on behalf of the world’s leading scientific academies, last week provoked even some of the more committed believers in man-made global warming to demand the resignation of Dr Rajendra Pachauri as chairman of the IPCC. But is the report all that it seems?
Last winter, the progress of this belief - that the world faces catastrophe unless we spend trillions of dollars to halt global warming - suffered an unprecedented reverse. In Copenhagen, the world’s leaders failed to agree a treaty designed to reshape the future of civilisation. This coincided with a series of scandals that blew up around the IPCC’s 2007 report.
Budget 2009: Labour is desperate, and fighting to the endSince then several inquiries, including three into the leaked “Climategate” emails, have tried to hold the official line, all following a consistent pattern. Each has made a few peripheral criticisms, for plausibility, while deliberately avoiding the main issue. Each has then gone on to put over the required message: that the science of global warming remains unchallenged.
At first sight, last week’s Inter-Academy report on the “processes and procedures of the IPCC” seems to have played it more cleverly. It criticises the IPCC’s abuse of its own procedures in very trenchant terms, and suggests some radical reforms to them. Passages on “conflict of interest”, and a recommendation that top officials should serve only one term, seem to hint that Dr Pachauri, reappointed to serve until 2014 after presiding over the IPCC’s last controversial report, should step down. But, as with the reports that preceded it, this one also tiptoes round a mighty elephant in the room, in order to put over the familiar message: the IPCC has generally “served society well”, the science remains unchallenged. It is as one might expect of a report produced on behalf of bodies such as Britain’s Royal Society and the US National Academy of Sciences, which have long been leading advocates for the belief in global waming.
When, some years ago, I began the research for my book The Real Global Warming Disaster, nothing surprised me more than discovering how widely the nature of the IPCC is misunderstood. It is invariably portrayed as a body representing the top scientists in the world, objectively weighing the complex forces that shape Earth’s climate. In reality, it’s nothing of the kind.
The men who set up the panel - led by its first chairman Bert Bolin, a Swedish meteorologist, and John Houghton, then head of the UK Met Office and first chairman of the IPCC’s scientific working group - were already believers in what they called “human-induced climate change”. The IPCC was, from the start, essentially a political pressure group, producing evidence to support the view that global warming was the most serious crisis facing the planet. This guided the selection of all the key scientists chosen to compile the IPCC’s findings (such as those involved in the Climategate affair). And this explains all the searching questions that have built up around its hugely influential reports ever since.
The first major row over the IPCC came when it was revealed that the most widely publicised and alarmist claim in its second report, in 1995, was inserted after the text had been signed off by the other scientists involved - while 15 passages which countered alarm over climate change had been excised. This famously provoked Professor Fred Seitz, former president of the US National Academy of Sciences, to say that in 60 years as a scientist he had never seen a “more disturbing corruption” of scientific procedure.
Perhaps the most telling controversy arose over the notorious “hockey stick” graph, the centrepiece of the IPCC’s third report in 2001. It rewrote climate history to show a world that was now dramatically hotter than it had been for at least 1,000 years. Promoted by Houghton and others as the ultimate emblem of the cause, it was eventually shown to have been no more than the result of trickery with a computer programme. But even after it been exposed, the IPCC establishment made the most tortuous efforts to defend it for their fourth report in 2007.
This became the most comprehensively discredited IPCC report of all. It was the first produced under the chairmanship of Dr Pachauri, who was appointed in 2002. One after another, its scariest and most widely publicised predictions - such as that Himalayan glaciers would largely have vanished by 2035, that climate change would kill off 40 per cent of the Amazon rainforest, that African crop-yields would be halved by 2050 - were found to have been based not on science at all, but on the reckless claims of environmental activists.
Not the least indictment of the IPCC’s 2007 report was the revelation that, in clear breach of its own rules, more than 5,000 of its supposedly scientific claims were not peer-reviewed but came from advocacy groups, press releases, newspaper articles, even student theses. Yet Dr Pachauri himself has repeatedly insisted that everything in his report was based on “peer-reviewed” science.
Again and again the 2007 report has been found to be in flagrant breach of the IPCC’s own rules. For instance, it cited no fewer than 16 articles from a single issue of one climate journal - which had been published after the IPCC’s official cut-off date and should therefore have been disallowed. In each of the thousands of instances where the IPCC broke its rules, the claims it made were all in one direction: to hype up alarm over the extent and effects of climate change beyond anything science could justify. The most shameless instance was the claim about Himalayan glaciers, which two of the IPCC’s own expert reviewers had pointed out was ridiculous even before it was published. Dr Pachauri dismissed this criticism as “voodoo science” (having employed the author of the claim at his own Delhi research institute).
Through all this the IPCC has been exposed for what it truly is: not a proper scientific body but an advocacy group, ready to stop at nothing in hijacking the prestige of science for its cause. But little of this might be guessed from the Inter-Academy report (jointly commissioned by Dr Pachauri himself and Ban Ki-Moon, the UN’s Secretary General). Even if Dr Pachauri is forced to resign at a UN meeting in Korea next month, as seems possible, he will merely have been thrown off the sledge so that the all-important cause can survive.
Yet the IPCC is the body on whose authority our Parliament voted for the Climate Change Act, passed all but unanimously two years ago. This will land us, on the Government’s own figures, with by far the biggest bill we have ever faced: up to 18 billion pounds every year for the next 40 years - 734 billion pounds in all - in order to cut our CO2 emissions by 80 per cent, something impossible to achieve except by closing down virtually all our industrial economy.
On the same authority, the rest of the world is being told that it must take similar steps, to avert a catastrophe dreamed up and promoted by no one more than those joint winners of the 2007 Nobel Peace Prize, Al Gore and the IPCC. Does this not all add up to the most bizarre and outrageous scandal in the history of the world? Read post here.
Sep 04, 2010
Two Different Approaches to Academic Monkey Business
By Charles Battig, M.D., Virginia Scientists and Engineers for Energy and Environment
Regarding Eric Felten’s “Morality Check: When Fad Science Is Bad Science” (Taste, Aug. 27): Apparent differences in how “scientific misconduct” at Harvard University is handled, and how it has been handled at the University of Virginia in the matter of climatologist Michael Mann are illustrative.
Harvard professor of psychology Marc Hauser was found “solely responsible for eight instances of scientific misconduct” involving the “data acquisition, data analysis, data retention and the reporting of research methodologies and results” in the Aug. 20, statement by Harvard Dean Michael Smith. Three published papers by Mr. Hauser now need to be corrected or retracted, according to Mr. Smith. This finding was based on a faculty investigating commission study in response to “allegations of scientific misconduct” (and, I’d say, suspicions of monkey business in his research on monkey cognition).
An “inquiry phase,” similar to the Harvard protocol, was initiated by Virginia Attorney General Ken Cuccinelli into the possible misuse of public funds by Michael Mann in his pursuit of employment and his use of such funds in his research activities when he was at the University of Virginia. The university and its supporters met this request with claims of impingement on sacred academic freedom and chilling the environment for academic research. Rather than welcome the chance to dispel the suspicion of scientific misconduct and protect its academic reputation, the university enlisted a high-powered Washington, D.C. legal team to fight the AG’s request in court.
While this legal process proceeds, the court of public opinion wonders why the openness and direct dealing with such allegations exhibited by Harvard is not the Virginia way. Harvard demonstrated a scientifically open and self-policing protocol; Virginia offers claims of academic freedom and erects legal barricades. Whose research will the public more likely trust?
Sep 02, 2010
The Poisoned Chalice
Terence Caldwell
Australians are fortunate that they can freely choose whoever they wish to support them in the parliament and to govern this once great country.
This choice is usually made on the basis that the voter has studied his party’s choice and is WELL AWARE of their policies and what that party stands for. But I find it hard to believe that the people who voted for the Greens are aware of all their policies.
So why did you vote for the Greens ?
Was it as one voter said ‘I thought they were nice people.’ Another said it was ‘because they care about the environment.’ As if no one else does.!!!!
Perhaps you were disenchanted by the major parties and thought you would give your vote to the greens instead, without even knowing their policies or how dangerous they are. I find it impossible to believe that anyone in their right mind would vote for the Greens if they knew the truth. Instead of all the lies they have told and policies that would put the fear into the devil.
Did you know they want to introduce death duties. That horrible archaic tax from the past that has caused an overwhelming amount of misery and grief to so many families. Rich and poor, it makes no difference. Everything is frozen till the tax man gets his share. In the mean time families are torn apart.
They want to allow the boat people and other so called ‘environmental refugees’ free access to Australia without any limitations or health and security checks within two weeks of arrival. Allowing them to live freely in our country, and worse to give them financial aid and housing.
The flood of millions from Asia and everywhere else would totally devastate our country and terrorists would be free to attack us from within the country , tearing us apart from the inside. They want to increase taxes on large and small businesses by another 5%. As if small businesses are not already hanging on by their fingertips desperately trying to survive through a global financial crisis and the painfully slow recovery. This could be a possible death blow to many small businesses.
They will demand farmers “remove as far as possible” all genetically modified crops, which includes cotton worth $1.3 billion a year.
They want to end “the mining and export of uranium”, worth $900 billion a year.
They want to introduce a carbon tax on everything destroying whatever businesses that survive their other holocausts and force the cost of electricity (if we still have any) and other products through the roof.
They intend to lift foreign aid to a minimum of 0.7 per cent of GDP, which means an instant rise in handouts to their fanatics overseas of $4 billion a year. This is partly due to the fact that their Copenhagen handout of seven thousand million dollars a year, thankfully failed, and this is another way of getting that money
They want to close down all coal mines in Australia and wipe out an industry that brings to the Australian people over $64 billion a year to help pay for our hospitals, road, schools, family and child care, pensions, national defence, etc. etc.
Not only that but it would completely alienate our trade relationship with China, the backbone of our export economy. Without China purchasing our resources our economy would be in total collapse and so would this country.
They want to close down all coal fired power stations and replace them with “Renewable energy”. Which might be O.K. if it was at all feasible but it is TOTALLY IMPOSSIBLE to even achieve 5% renewable energy. Let alone 100% renewable energy.
It has been tried over the last thirty years or more in many countries with the resultant abject failure.
California has gone bankrupt trying with over 14000 wind generator failures and a return to thermal power generation. The total ‘renewable energy’ in California after 31 years is 2.3% and falling.
Spain is also bankrupt because of their renewable energy fiasco and are importing power. The cost of which has doubled and they now have an unemployment rate of over 20%.
Germany has over 7500 wind generators of which 2500 failed last year and they have returned to Thermal power which saved them last winter from total collapse.
With Denmark’s 5000 wind generators of which 2000 failed last year they are yet to reduce so called ‘CO2 emissions.’ By one gram and like the other countries rely on thermal power generation for backup.
The resultant failures in various countries are always the same from many countries but the Greens flatly refuse to see the failures because they want to bring Australia to its knees and under their communist globalisation control.
They have NO interest in our well being, only in their communist ideologies and are determined to destroy our economy.
Under that very thin cover of green is a very bright red of the communist, lead by the fanatical Bob Brown, who is a liar and one of the worst perpetrators of this world scam and he wants total control.
If the extremists called ‘greens’ should bring their policies to fruition it will destroy our economy and our country.
To the point it could bring about an extremely violent reaction from the Australian people when they finally realise that the Greens are deliberately trying to tear our country apart.
By that time it could be too late. The only consolation would be that every Green would pay severely for their treachery.
Now that you have read their policies, and this is not all of them. Are you still proud you voted for the greens. Will you stand up and accept the blame when this country is devastated for this communist agenda.
Or will you do the right thing by your country and help get rid of these destructive vandals and traitors.
When you voted for the greens you were given a Poison Chalice that we may never recover from. Remember that 173 people were burnt to death because of ‘greens’ policies forced on councils who were too weak to deny them.
Also the destruction of over 300 homes and the displacement of over 7000 people. The Greens have NOT been responsible for even one environmental improvement. They are a farce and liars.
If Australia could reduce its total CO2 emissions (a harmless gas essential to all life) by 20% as they want to, it would make a difference of .00000016% or 16 parts per ten millionth to the increase of CO2 in air per year. NOT even measurable.
Following are two similar reports and I urge you to read them and realise this is not some ‘Wild story’. Our future is now in your hands. You are the ones who MUST REJECT the greens and do everything to revoke your vote and stop the communist greens before it is too late.
Sep 01, 2010
Covering up for George Soros
By Ed Lasky
The sinister, omnipresent moneybags of the American left, George Soros, knows that distraction and misdirection make for a good defense. So do his many lackeys and sympathizers in the American media.

Recently, the left has built up two conservative billionaire brothers as their latest bogeymen. I am referring to the libertarians Charles and David Koch, who fund, among other groups, Americans for Prosperity. First Barack Obama lambasted them, and his minions in the media dutifully followed. Jane Mayer’s 10,000-word article in the New Yorker, titled “Covert Operations: the billionaire brothers who are waging a war against Obama,” has been widely cited in other liberal media.
In reality, the brothers have long funded a variety of causes years before anyone had ever heard of Obama. Regardless, Mayer’s article was criticized as shameful by others, including a trenchant bit of criticism by Mark Hemingway in the Washington Examiner. One of Hemingway’s points was right on target: Mayer’s barely visible coverage of George Soros, sugar daddy of the Democratic Party and an early, ardent and generous supporter of Barack Obama. Hemingway excerpts a paragraph from Mayer’s article and notes some omissions:
But this passage from Mayer’s piece is also worth noting, as a measure of the article’s bias:
Of course, Democrats give money, too. Their most prominent donor, the financier George Soros, runs a foundation, the Open Society Institute, that has spent as much as a hundred million dollars a year in America. Soros has also made generous private contributions to various Democratic campaigns, including Obama’s. But Michael Vachon, his spokesman, argued that Soros’s giving is transparent, and that “none of his contributions are in the service of his own economic interests.”
The idea that Soros’ giving is transparent is laughable—he’s given millions to the Tides Foundation, a byzantine organization notorious for obscuring finding sources on the left ... Further, Soros was very influential in setting up the Center for American Progress think tank and many other liberal organizations in the last decade. If any billionaire has waged war against a president recently, it’s Soros’ campaign against Bush. To dismiss any concerns about Soros’ political spending while saying that the Koch brothers are at the center of a dark conspiracy is absurd.
Mayer just let the claim that Soros has no monetary interest when he gives money stand unchallenged—and that was shameful. Where was the famed New Yorker fact-checking department? Did they get laid off?
Let me expand on Hemingway’s commentary, in light of the view that somehow Soros’s giving has zero to do with his financial interest—or, as his spokesman spins, “none of the contributions are in the service of his economic interests.” New York Times theatre critic turned frothing attack dog columnist of the left Frank Rich has started promoting this theme: Soros is Santa Claus or Mother Theresa. This Sunday, Rich had his typical invective-filled column—also railing against the Kochs—and then gave us this whopper:
Soros is a publicity hound who is transparent about where he shovels his money and “like many liberals—selflessly or foolishly, depending on your point of view—he supports causes that are unrelated to his business interests.”
What planet do Mayer and Rich live on? Soros obviously has his financial interests in mind when he gives, and he knows how to use his billions to make more billions by tapping his friends in high places in the Democratic Party.
For example, Soros has made a boatload of money off his huge investment in the Brazilian oil company, Petrobras, a company that has benefited mightily from its deep offshore oil reserves. Barack Obama had the U.S. Export-Import bank extend billions of dollars of loans to underwrite Petrobras’s offshore oil development. Soros positioned himself to reap big gains just days before his pal in the White House pushed for billions in loans to Petrobras—a company from a country that can certainly tap the financial markets on its own to raise funds to tap oil off its shores. The company did not need easy money from American taxpayers. Yet there was Soros, who somehow was prescient enough to roll the loaded dice in taking a major stake in Petorbras. He got a double-dip type of return when Barack ("never let a crisis go to waste") Obama shut down deep-water oil exploration off America’s own energy-rich coasts—further enriching the prospects for Petrobras and George Soros.
Strike one.
Soros’s pet think-tank, the Center for American Progress, constantly pushes green schemes. Democratic politicians are on board, as well. This group includes Barack Obama who, runs after one electric battery, solar power plant, and windmill after another (when he is not on the links or listening to live music at the club he created in the East Room of the White House). How generous have Obama and the Democrats been to the green schemers? The grand champion of budget-busting departments has been the “Energy Efficiency and Renewable Program,” which received $1.7 billion in 2008 and $16.8 billion in 2009, a 1,014% increase in just one year. Media reports over the past year or so have tied numerous Democratic donors to these “ventures.” They have been richly rewarded with taxpayer dollars.
What a great scheme! Give thousands to Obama and various Democrats and get billions back in our taxpayer dollars. Who is a big investor in “clean energy,” by the way? Why, none other than George Soros, who announced back in October 2009 that he would invest at least $1 billion in “clean energy.” The Center for American Progress is closely tied to the Obama administration (see “Soros-Funded Democratic Idea Factory Becomes Obama Policy Font") and serves as its hiring hall, not to mention as the fourth or fifth branch of government (or so it seems—I have the Center for American Progress as a Google search term, and the employees of that tank are all over the media landscape, as well as D.C.). Soros knows how to use leverage, and the millions he put into the Center for American Progress (and into the election of Barack Obama and other leftist Democrats) will reap big returns—at our expense—in the years ahead.
Strike two.
Whatever happened to all the hullaballoo regarding hedge funds? Back in 2008 and early 2009, Democrats were busy blaming Wall Street, hedge funds, and Republicans for the financial crisis. We were promised that hedge funds would be regulated to the point of harmlessness, that their investors would have to be disclosed, their positions monitored, their leverage controlled. What happened to those promises? Well, that did not suit hedge fund managers—not at all. So the promises went away.
And who was one of the biggest hedge fund titans out there? Why, it happens to be none other than George Soros, who made billions in 2008 from the financial and housing collapse and then made billions more in 2009 as the Democrats bailed out Wall Street. Who was the major beneficiary of hedge fund campaign money in 2008? Barack Obama, eclipsing the long-time champ in this area, Christopher Dodd, the Senator from Connecticut (Hedgefundland) who chaired the Senate Banking Committee. In 2008, I noted that Obama was “The Hedge Fund Candidate.”
Obama, Dodd, and fellow Democrats just forgot that crusade against hedge funds, and Soros continues to rake in billions. George Soros—who is the number-one funder of so-called 527 groups (such as MoveOn.Org)—gets his money’s worth whenever and wherever he puts it to work. He finds his best leverage in the Democratic Party.
Strike three.
And a bonus pitch.
I have written quite a bit about the riches we have in America in the form of shale gas. Soros has investments in the energy industry that would be harmed if our cheap and plentiful reserves were tapped to their full extent. Among his holdings are a huge one in InterOil that has big reserves of natural gas in New Guinea. Democrats are now trying to shut down our shale gas industry by attacking “fracking”—a method that is used to extract the gas from the shale rock that holds it. There is plenty of evidence that fracking is safe and sound—it has been used for many years. Nevertheless, the industry is under attack by Democrats in Congress such as Ed Markey, by Obama’s EPA, by the Center for American Progress, by Pro Publica—an outfit created and funded by Soros pals Herbert and Marion Sandler—and recently by MoveOn.org. Soros must be getting desperate, as Americans crave cheap natural gas, to bring in MoveOn.org, which has heretofore focused on the purely political sport of bashing Republicans and electing as many left-wingers as it could—including, of course, the biggest of them all, Barack Obama.
One could go on. Soros is an enterprising man and legendary investor. He figured out sooner and better than anyone else how to buy political power and bend politicians to his will. He is not a goody-two-shoes, as partisans on the left try to portray him. He has benefited hugely from leverage, and the best leverage he enjoys is when he “gives” money in ways that are really investments (payoffs, bribes?) in disguise. Shame on Mayer, Rich, and others who hide this history. They also are all but puppets in the hands of George Soros. Post is here.
Ed Lasky is news editor of American Thinker
|

