Aug 03, 2010
CO2 Molecules Fight Back
By Kirk Myers, Examiner
What if CO2 molecules went on strike? Would they talk like this?
Climate experts, politicians, environmentalists and assorted green organizations have been beating the daylight out of CO2 for decades, charging it with a litany of crimes against Mother Earth - heating the atmosphere, melting ice caps, raising sea levels, acidifying oceans, driving polar bears to extinction and generally making a mess of things on the planet.
As the hobgoblin of the green movement, CO2 has taken it on the atmospheric chin. But what if CO2 had its own atmospheric lobby and could fight back? Perhaps we might see a story like this one in the news.
-----------
ORLANDO, Fla. - Faced with growing criticism, the CO2-molecule lobby said today that it will no longer take the heat for earth’s climate change, and has launched a campaign to restore its blackened reputation.
“It’s time to clear the air about the benefits of CO2,” announced chairman Nate Carbo at today’s Alliance of CO2 Molecules (ACO2M) tropospheric conference held high above Walt Disney Resort. “CO2 molecules have been the climate fall guy for years. We’ve been unfairly charged with crimes against humanity. Now we’re going to fight back with all our molecular energy.”
Chairman Carbo said ACO2M’s executive panel has drawn up a list of grievances that it will send this week to CO2 critics at the White House, Intergovernmental Panel on Climate Change (IPCC), EPA, Climate Research Unit (CRU), NASA, Goddard Institute of Space Studies (GISS) and major environmental organizations. A copy of the preliminary draft, received earlier today, makes the following 10 demands:
1. Stop calling CO2 molecules a pollutant - Plants depend on CO2, and they’ve been CO2-undernourished since the Jurassic period (an era plants refer to as “photosynthesis heaven") when our molecular presence was nearly five times higher than current levels. Not surprisingly, the CO2-famished plants of today are green with envy. (Note: The world’s plant life is solidly behind our organization in backing this demand. They’ve given ACO2M the power of attorney to represent all earth vegetation in a lawsuit against Carol Browner and the scientists at the EPA, which recently declared CO2 a pollutant.)
2. Tell Michael Mann to shut up - There is no hockey stick-shaped warming in the atmosphere (in fact, the earth is cooling now), and if there was, it wouldn’t be CO2’s fault. Why don’t you blame the sun for a change? We CO2 molecules have been around this earth long enough to remember the gloriously comfortable days of the Roman Warm Era and Medieval Warm Period - a time when there were no cars, factories and power plants. Back then, humans were growing vineyards in England and raising crops in Greenland. Now their descendants want a one-way ticket to the beaches in Rio. We don’t deserve credit or blame for climate change.
3. End discrimination - CO2 is the whipping boy for every major climate disaster. We get blamed when it’s hot and screamed at when it’s cold. But the big yellow ball in the sky never takes the heat. Why? We CO2 molecules get our hind atoms scorched every time the sun spews another sunspot or solar flare. But, oh no, it’s always CO2 gas that gets fingered for imaginary global warming. Please look at the blast furnace overhead for a change.
4. Quit passing the buck - Frankly, we CO2 molecules feel betrayed. Not all of us emanate from cars, factories and burning wood piles. Many of us are sent on our tropospheric journey when humans breathe. Humans are breathing CO2 factories, but you never want to acknowledge your gaseous contribution. So if you’re truly serious about reducing the percentage of CO2 molecules, stop breathing and talking. (We’ve discovered, by the way, that CO2 emissions - and our molecular numbers - rise dramatically whenever Chicken Little eco-dummies like Al Gore take the microphone.)
5. Apologize to trees and other vegetation - Most of you spend lots of time and money tending your garden, caring for plants, trimming trees and manicuring your lawn. Your yard is a source of pride, and you brag about it to neighbors. So why in Heaven do you want to reduce its precious CO2 supply ‘ nature’s sustenance? Shame on you! If you discover a brown patch in your St. Augustine tomorrow, consider it payback.
6. Urge Al Gore to take an oath of silence - The former VP is a charlatan and disgrace. All his flashy multimedia presentations cast us as some sort of global warming satan. But our molecular membership has never been responsible for rising temperatures. Look carefully at CO2 and temperature charts. When you superimpose them, you’ll find CO2 shuffling along hundreds of years after temperatures have risen. No wonder the enemies of CO2 show the charts separately. Telling the truth is just too inconvenient. (Note: Some of our normally friendly gas molecules want to lock Gore in a greenhouse for 30 days. But we warned them it might trigger a plant protest.)
7. Stop ignoring water vapor - We hate to rain on your parade, but water vapor is by far the most abundant greenhouse gas. Yet it rarely gets mentioned in all the sky-is-falling rhetoric about global warming. At slightly less than four percent, CO2 is the small fry on the greenhouse-gas scale, along with methane, nitrous oxide, ozone and a few other trace gases. The big Kahuna, water vapor, is responsible for 95 percent of the greenhouse effect, and keeps your climate cozy and warm. Without its insulating effects, life on earth would be unbearably cold. We’d like to see you try to ban water vapor!
8. Stop fudging data - We’ve had to watch from afar as Professor Phil Jones, Dr. Michael Mann and other so-called climate scientists have manipulated temperature data to make CO2 look like the most harmful molecule on the planet. After reading a few of their CRU e-mails, we now know that they’ve warmed the earth more with their cooked research and phony models then we could ever do as a lowly CO2 gas. They’ve done a great disservice to plant life on earth with their incessant attacks on a blameless group of molecules whose atmospheric presence is a piddly 385 parts per million. If these hucksters truly desire redemption, they should shut up about climate change and exhale frequently for the good of the redwoods.
9. Protect earth’s food supply - When it comes to sustaining life, we CO2 molecules are high on the list of essential gases. If you succeed in carrying out your CO2 ethnic cleansing plan, you’ll hurt all vegetation. (Trees and plants don’t react well when deprived of their favorite atmospheric meal.) A CO2-depleted world will stunt plant growth, reduce crop yields and lead to famine and starvation. You want that on your tree-hugging green conscience?
10. Listen to honest scientists - Most of the climate experts predicting greenhouse doom are either on the government payroll, knee-deep in research grants or supplying the scientific rationale behind legislation designed to extort money from consumers in the form of carbon taxes. They have a vested interest in scaring the bejeebers out of people about the wickedness of the CO2 molecule - one of the most good-natured elements in the atmosphere. Their gloomy forecasts and high drama are full of hot air - pure junk science. They should be out on the street looking for work instead of receiving awards and more grant money.
The CO2 Alliance’s list of demands is not open to negotiation, said Greta Carbo, president of the League of Carbon Dioxide, a CO2-friendly lobby group with close ties to AC20M. In her opening speech last night, she called the anti-CO2 movement “dangerously extreme” and “a threat to all life on earth.” She said her group expects a White House response to its demands by early next week.
“We’ve stood by for decades while pseudo-scientists, self-serving politicians and the hysterical green movement bad-mouthed earth-friendly CO2 molecules for simply floating around and minding their own business. We’re tired of the fright-mongering. It’s time to set the record straight.”
ACO2M’s executive panel also announced today that it has scheduled talks next week with the Organization for the Protection of Plant Life on Earth (OPPLE) to discuss ways to counter the eco-alarmists’ anti-CO2 message and educate humans about the many benefits of carbon dioxide.
“This is serious business. We need to expose the lies, hysterics and rigged climate models driving the greenhouse scare campaign. Humans need to hear the truth about CO2. Their lives, and their children’s lives, depend on it,” Carbo said.
Aug 02, 2010
Poison Pill: The New Senate Energy Bill
By Brian Sussman
The latest Senate energy bill, quietly unveiled last week, looks like sweet compromise on radical measures like cap and trade, but buried within is a bitter poison pill that will could be swallowed in a vote that may come this week.
Unlike the 1,200-page House of Representatives energy bill, which passed last year, this scaled-down proposal does not call for an 83-percent reduction in greenhouse gases (or any reduction in greenhouse gases) and contains no mention of a cap-and-trade scheme. Also contrary to the House bill, this one does not provide a family of four earning up to $55,000 with a monthly stipend—deposited directly into their bank accounts—to offset higher energy costs. It also does not supply three years of unemployment benefits at 70 percent of former wages—plus job retraining and relocation—to those whose jobs are shipped overseas, as prescribed in the House bill.
Instead, at a glance (which is the way most in Congress ever seem to examine legislation), this bill appears rather easy to take. Most of its 357 pages are devoted to sections entitled “Oil Spill Response,” “Reducing Oil Consumption,” “Improving Energy Security,” and “Protecting the Environment.” There’s even a portion devoted to further grill BP via subpoena power. With sugar-coating like this, the sixty votes necessary to pass seem possible.
However, beneath the glaze, there’s a clot of overpowering government spending and social engineering.
For example, electric vehicles are pushed via the bill’s “Promoting Electric Vehicles Act of 2010.” No surprise here, particularly since the government has a 61% stake in General Motors and Chevy’s electro-mobile, the Volt. Besides this Act allowing the feds to spend $25 million on new electric cars for their official fleet, there’s an astounding electric car welfare program. Section 2116 explains that 400,000 such vehicles will be virtually given away at low cost—or perhaps no cost—to people living in “selected communities diverse in population” and “demographics.”
Additionally, pages 264-265 require that any new construction or remodel of an existing structure must include the installation of proper hookups for charging an electric vehicle. So even if you have no intention of owning such a car, adding that extra bedroom will require you to spend additional money to install battery-charging infrastructure in your garage.
The bill also heralds the coming of the “Batteries For Tomorrow Prize.” The first person to build a car battery that runs 500 miles on a single charge will win a taxpayer-funded reward of $10 million.
And there’s bait to entice truck owners to switch from traditional petroleum to natural gas. Section 2002 describes federal rebates, ranging from $8,000 for large pickups to $64,000 for heavy-duty Class 6 trucks weighing 26,000 pounds, available for those who install the equipment to make the fuel swap. And government grants (not loans) of up to $50,000 are available for gas stations to install natural gas refueling pumps.
And then there is the section of the Senate bill dedicated to the new federal building code. Originally rolled out in the House’s energy plan, the code—which supersedes all state and local measures and is thoroughly detailed in my book, Climategate—now has a name: “The Home Star Retrofit Act of 2010.” This Act places a hard squeeze on every property owner to spend thousands of dollars in environmental compliance upgrades in a time of economic stringency and falling home prices.
Federal dollars will be paid to those who decrease their energy usage. With the Smart Meters being installed across the country (mandated in the 2005 energy law and capable of recording your energy usage minute by minute), the government will be able to accurately determine your carbon footprint. To entice you to reduce your footprint, rewards of $3,000 will be given for a 25-percent reduction in energy consumption, and $1,000 more for each 5-percent reduction achieved—up to a maximum of $8,000. A similar plan is proposed for water consumption.
Additionally, federal rebates of up to another $8,000 per home are available for upgrading doors, windows, insulation, roofs, water heaters, air conditioners, etc.
Even with the government kickbacks, if you’re still unable to afford all of the upgrades, Section 3015 declares that Fannie Mae will be the official lender to rovide you with a “Home Star Efficiency Loan.” This means taxpayer sponsored Fannie will be taking on even more debt.
As one who has written extensively about the ideological machinations of the environmental movement and its leaders, I can tell you that this Senate bill is everything they wished could have been packed into the original House proposal.
If the Senate bites on this legislation, an airsickness bag will be required. The bill will go to committee, be conjoined with the massive House plan, and be presented to a lame duck Congress who will ram the bad medicine down our throats.
We need to hound the Senate now. Tell them to keep this poison pill away from their lips.
Brian Sussman is a former television meteorologist and the author of Climategate: a veteran meteorologist exposes the global warming scam. He hosts the morning show on KSFO, 560AM, in San Francisco.
Aug 01, 2010
Climate proposals threaten pursuit of happiness and justice
By Paul Driessen
Environmental justice demands that the United States address global warming, the gravest threat facing minority Americans, insist the EPA, Congressional Black Caucus and White House. Are they serious?
The alleged threat pales next to unwed teen motherhood, school dropouts, murder and other crime. But even assuming human carbon dioxide emissions will cause average global temperatures to rise a few degrees more than they have already since the Little Ice Age ended, it is absurd to suggest that any such warming would harm minorities more than policies imposed in the name of preventing climate change.
Human activities have not replaced the complex natural forces that drove climate change throughout Earth’s history. But even if manmade greenhouse gases do contribute to planetary warming, slashing US emissions to zero would bring no benefit, because steadily rising emissions from China, India, Brazil and other rapidly growing economies would almost instantly replace whatever gases we cease emitting.
Most important, fossil fuels power the economic engine that ensures justice and opportunity in America today. Policies that make energy less reliable and affordable reduce business revenues and profits, shrink investment and innovation, imperil economic recovery, and hobble job creation, civil rights, and the pursuit of happiness and the American dream.
Whether they take the form of cap-and-trade, carbon taxes, restrictions on drilling and coal mining, or EPA rules under its claim that carbon dioxide “endangers” human health and welfare, anti-energy policies frustrate the natural desire of poor and minority Americans to improve their lives.
As to coping with higher temperatures, restrictive energy policies send electricity prices skyrocketing, making it harder for low-income households to afford air conditioning, and putting lives at risk. They send poor families back to pre-AC misery of bygone eras, like the 1896 heat wave that killed 1,300 people in New York City’s sweltering tenements. In wintertime, they make heating less affordable, again putting lives at risk.
I recently documented the connection between energy policies and civil rights. My “Justice through Affordable Energy for Wisconsin” report focuses on the Dairy State, where I grew up. However, its lessons apply to every state, especially the 26 that get 48-98% of their electricity from coal or have a strong manufacturing base. (The full report can be found at www.CFACT.org)
Energy is the foundation for America’s jobs, living standards, and everything we make, grow, eat, wear, transport and do. Climate change bills, energy taxes and renewable energy mandates deliberately restrict supplies of reliable, affordable hydrocarbon energy - sending shockwaves through the economy.
Fossil fuels generate three-fourths of Wisconsin’s electricity, keeping costs low and enabling its $45-billion-a-year manufacturing sector to compete in a tough global marketplace. Hydrocarbons sustain thousands of jobs in agriculture, tourism and other sectors of the state’s economy. They ensure that hospitals and clinics can offer high-tech diagnostic, surgical and treatment services.
They enable school districts, families, churches, shops and government offices to operate in the black. Soaring fuel and electricity prices would force schools to spend millions more for buses, heating and lighting. That would mean higher taxes - or reduced music, sports, language and special education programs. Poor and minority neighborhoods would be impacted worst. Small and minority businesses are often young and undercapitalized. Increasing their operating costs, while decreasing the disposable income of their customers, puts them on the verge of bankruptcy.
“A single worker in our Rhinelander fabrication plant can do the work of ten who do not have access to cranes, welding machines, plasma burners and all other machinery that allows us to cut, bend and fabricate steel up to six inches thick, and make all kinds of heavy equipment,” says Oldenburg Group executive vice president Tim Nerenz. But the machinery and facilities are energy-intensive. If energy costs rise, the company would have to cut wages and benefits or lay off workers, as contract prices are fixed and overseas competition is fierce.
Indoor pools and other facilities make tourism a year-round industry, sustaining local economies during frigid Wisconsin winters, making resorts like the Chula Vista Resort in Wisconsin Dells popular jumping-off points for cross country skiing, snowmobiling and dining. Rising energy costs would reduce family vacations, hammer bottom lines, force layoffs, and cause foreclosures throughout these communities. In every case, it is blue-collar workers, low and moderate income families, minorities and the elderly that are affected most severely.
Nor are these impacts likely to be offset by “green” jobs. As Spain, Germany and other countries have discovered, wind and solar power require constant infusions of money from increasingly strapped taxpayers and energy consumers. When the economy sours, the subsidies disappear, and so do the jobs.
Wind and solar electricity is expensive, intermittent and unreliable - necessitating expensive gas-powered backup generators, and further damaging family and business budgets. Plus, most of the jobs will be in China and India, where low energy and labor costs, and access to rare earths and other raw materials that America refuses to mine, supply wind turbine and solar panel factories that easily under-price US firms.
The entire cap-tax-and-trade, renewable energy and green-jobs edifice is a house of cards, propped up by claims that humans are affecting the Earth’s climate. As EPA and EPA Administrator Lisa Jackson repeatedly assert, “Climate change is already happening, and human activity is a contributor.” However, that is not the issue. The issue is whether our use of fossil fuels is now the dominant factor in global warming and cooling, and whether future manmade climate change will be catastrophic. There is no replicable or credible evidence to support that proposition.
Headline-grabbing disaster scenarios forecast for 50 or 100 years in the future are the product of speculation, assumptions, unreliable computer models, and articles by climate activists falsely presented as peer-reviewed scientific papers in IPCC reports, news stories and political speeches. As my Wisconsin study explains, they are not supported by actual data and observations regarding historic and current global temperatures, ice caps, glaciers, sea levels, rainforests or cyclical weather patterns.
Energy taxes and subsidies, renewable energy mandates, soaring prices for everything we need - and severe impacts on families, businesses, jobs, opportunities, living standards and basic civil rights - might be justified if we did indeed face a manmade climate disaster. But even then we should carefully examine the costs and benefits of any proposed actions.
We should determine whether slashing fossil fuel use will stabilize our planet’s ever-turbulent climate, and whether our limited resources might be better spent on adapting to future changes, natural and manmade, just as our ancestors did.
If global warming science is inaccurate, dishonest, slanted or fraudulent, there is even less justification.
We cannot have justice without opportunity, or opportunity without energy. We cannot have justice by sharing scarcity, poverty and skyrocketing energy prices more equally - especially on the basis of erroneous, speculative or manipulated climate science.
We must therefore be forever vigilant, to ensure that Congress does not slip cap-tax-and-trade proposals through during a post-election lame-duck session - and EPA does not shackle our economy and civil rights progress with its job-killing “endangerment” rules.
Paul Driessen is senior policy advisor for the Committee For A Constructive Tomorrow (CFACT) and Congress of Racial Equality (CORE), and author of Eco-Imperialism: Green power - Black death.
Jul 31, 2010
Arctic Sea Ice Melt This July Slowest On Record - “Death Spiral” Is Dead
P Gosselin, No Trick Zone
Today I’m coming out a day early and declaring July 2010 as the slowest melting July since the AMSR-E satellite record has been kept. The once ballyhooed “death spiral” is dead.
Reminds me of that line in Tarantino’s cult film Pulp Fiction:
“Who’s Zed?”
“Zed? Zed is dead.”
At the end of June I recall seeing lots of headlines in the newspapers about a record Arctic sea ice melt occurring. Words like “alarming” and “unprecedented” were used liberally. The reports were splashed with pictures of polar bears for added effect.
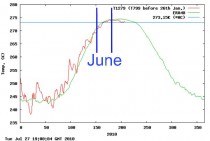
One month later the media are completely silent. As the following graphic shows, this July’s Arctic sea ice melt was the slowest since this dataset has been kept. Click Here.
July 2010 melt was the slowest July in the last 9 years.
Here are the numbers for the amount of July-melt in million square kilometers:
Year 6/30 to 7/30
2003 2.25
2004 2.08
2005 2.52
2006 2.11
2007 3.00
2008 2.45
2009 2.81
2010 1.85
It was the first time that July failed to reach 2 million sq. km. Now 2010 is on track to reach last year’s low. So far the Arctic has been cold this summer, one of the coldest summers north of 80N on record, Click Here.
Temperature above 80N from the Danish Meteorological Institute.
What’s the forecast?
Meteorologist Joe Bastardi projects a significant Arctic sea ice recovery in the couple of years ahead, flying in the face of predictions made by climate “scientists”. Bastardi’s claim is in line with the latest NOAA seasonal forecasts.

NWS/NCEP forecasts a cold Arctic in the months ahead.
La Nina is strengthening and global temperatures, dare I say, are beginning a death-spiral of their own.
----------------
GISS Polar Interpolation
By Steve Goddard, Watts Up With That
There has been an active discussion going on about the validity of GISS interpolations. This post compares GISS Arctic interpolation vs. DMI measured/modeled data.
All data uses a baseline of 1958-2002.
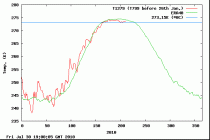
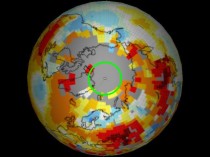
The first map shows GISS June 2010 anomalies smoothed to 1200 km. The green line marks 80N latitude. Note that GISS shows essentially the entire region north of 80N up to four degrees above normal.
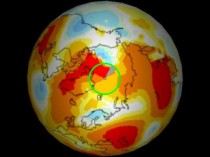

The next map is the same, but with 250 km smoothing. As you can see, GISS has little or no data north of 80N.
Now let’s compare the GISS 1200 km interpolation with the DMI data for June 2010.
Daily mean temperatures for the Arctic area north of the 80th northern parallel, plotted with daily climate values calculated from the period 1958-2002.
DMI shows essentially the entire month of June below the 1958-2002 mean. GISS shows it far above the the 1958-2002 mean. Yet GISS has no data north of 80N.
Conclusion : GISS Arctic interpolations are way off the mark. If they report a record global temperature by 0.01 degrees this year, this ↑↑↑↑↑↑↑ is why.
Jul 30, 2010
Research says climate change undeniable
By Fiona Harvey, Financial Times
International scientists have injected fresh evidence into the debate over global warming, saying that climate change is “undeniable” and shows clear signs of “human fingerprints” in the first major piece of research since the “Climategate” controversy.
The research, headed by the US National Oceans and Atmospheric Administration, is based on new data not available for the UN’s Intergovernmental Panel on Climate Change report of 2007, the target of attacks by sceptics in recent years. The NOAA study drew on up to 11 different indicators of climate, and found that each one pointed to a world that was warming owing to the influence of greenhouse gases, said Peter Stott, head of climate monitoring at the UK’s Met Office, one of the agencies participating.
Seven indicators were rising, he said. These were: air temperature over land, sea-surface temperature, marine air temperature, sea level, ocean heat, humidity, and tropospheric temperature in the “activeweather” layer of the atmosphere closest to the earth’s surface. Four indicators were declining: Arctic sea ice, glaciers, spring snow cover in the northern hemisphere, and stratospheric temperatures.
Mr Stott said: “The whole of the climate system is acting in a way consistent with the effects of greenhouse gases.” “The fingerprints are clear,” he said. “The glaringly obvious explanation for this is warming from greenhouse gases.”
Some scientists hailed the study as a refutation of the claims made by climate sceptics during the “Climategate” saga. Those scandals involved accusations -some since proven correct - of flaws in the IPCC’s landmark 2007 report, and the release of hundreds of emails from climate scientists that appeared to show them distorting certain data. “This confirms that while all of this [Climategate] was going on, the earth was continuing to warm. It shows that Climategate was a distraction, because it took the focus off what the science actually says,” said Bob Ward, policy director of the Grantham Institute at the London School of Economics.
But the report nonetheless remained the target of scorn for sceptics. Myron Ebell, of the Competitive Enterprise Institute in the US, said the new report would not change people’s minds. “It’s clear that the scientific case for global warming alarmism is weak. The scientific case for [many of the claims] is unsound and we are finding out all the time how unsound it is.”
Pat Michaels, a prominent climate sceptic, ex-professor of environmental sciences and fellow of the Cato Institute in the US, said the NOAA study and other evidence suggested that the computerised climate models had overestimated the sensitivity of the earth’s temperature to carbon dioxide. This would mean
that the earth could warm a little under the influence of greenhouse gases, but not by as much as the IPCC and others have predicted.
“I think it is the lack of frankness about this that emerged with Climategate, and that seems to continue [that make people doubt the findings],” he said.
Steve Goddard, a blogger, said the conclusion that the first half of 2010 showed a record high temperature was “based on incorrect, fabricated data” because the researchers involved did not have access to much information on Arctic temperatures.
David Herro, the financier, who follows climate science as a hobby, said NOAA also “lacks credibility”.
But Jane Lubchenco, the administrator of NOAA, said the study found that the average temperature in the world had increased by 0.56C (1F) over the past 50 years. The rise “may seem small, but it has already altered our planet ... Glaciers and sea ice are melting, heavy rainfall is intensifying, and heat waves are more common.”
|

