Jul 20, 2010
Premature chill in the Arctic?
By Anthony Watts
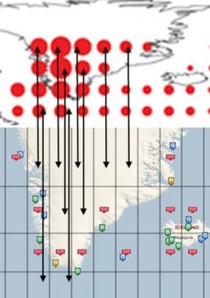
It is still quite cold in the Arctic, with below normal air temperatures and sea surface temperatures surrounding the ice pack between around 2-4C. Much of that has to do with meltwater. I’ve added this image to our new WUWT Sea Ice Page tonight.
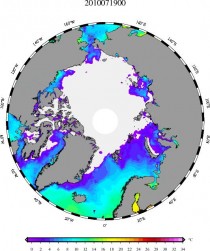
Source here.
But looking at another product from the Danish Meteorological Institute (DMI) there’s an indication of even colder temperatures, now hitting the freezing line in the middle of the Arctic summer.
While this most certainly could be a temporary blip, it seems the temperature in the arctic above 80N as calculated by DMI has steadily declined and hit 0C a bit early (just past midway) in the Arctic melt season.
See the graph below:
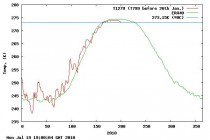
Source here.
Here’s the 3x magnified view of the top of the graph:
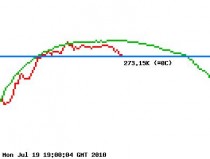
Much of the melt season so far has been below the green “normal climate” line. While it is just another data point (i.e. weather) , it is a curious and interesting development worth watching. The past few days melt has been accelerating, a bit, but with a dropping Arctic core temperature it would seem to suggest perhaps this is limited to some traditional melt zones for this time of year, such as near the Chukchi sea.
Look for more in WUWT Sea Ice News #15 this weekend.
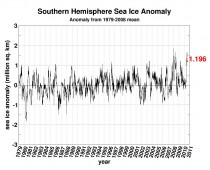
See WUWT’s new sea ice page here. See Antarctic come close to 2007 record high below. Enlarged here.
Jul 20, 2010
Does New Scientist foresee Paradigm Shift on Climate Theory?
By John O’Sullivan
With its frank ‘thumbs down’ to ‘whitewash’ inquiry into the Climategate scandal is international science magazine sensing a climate paradigm shift?
Popular international science magazine, New Scientist has appeared to give support to the claim that a recent official inquiry into the Climategate scandal may rightly be dismissed as a ‘whitewash.’ The change in tone from the usually emollient journal has some commentators foretelling a growing loss of faith in the science behind the global warming scandal.
Climategate caught media attention as it appeared to show damning revelations of alleged misconduct by a clique of researchers at the UK’s University of East Anglia’s Climate Research Unit (CRU) indicated by leaked emails in November 2009.
The clique were accused of fudging international temperature data to make the late 20th century appear to be an era of dangerous human-induced global warming. Subsequently, three official British inquiries have each exonerated the CRU of any wrongdoing.
Under the heading, ‘Without candour, we can’t trust climate science,’ (July 14, 2010), the weekly science magazine that reports on science and technology news for an international English-speaking audience, rebukes the most recent of those three official Climategate inquiries, that of Sir Muir Russell.
Most pointedly, New Scientist (NS) accuses the Muir Russell Inquiry of failing to answer the question: “How can we know whether CRU researchers were properly exercising their judgment?”
‘Hardcore Doubt’ About Climategate Inquiry Outcome
The London-based publication accuses Sir Muir Russell of a “failure to investigate whether emails were deleted to prevent their release under freedom of information laws.” Such a failure, they argue “makes it harder to accept Russel’s conclusion that the “rigour and honesty” of the scientists concerned “are not in doubt."”
Aussie Skeptic Attacks Climate Data Fraud
Climate skeptic, Malcolm Roberts, mounts a lucid rebuttal of the man-made global warming theory in his publication, ‘Two Dead Elephants in Parliament.’ Quick to pick up on the significance of New Scientist’s apparent move away from a posture sympathetic to established views, climate science blog, WattsUpwithThat ( WUWT), publishes its own take (July 19, 2010) commenting, “...we have the New Scientist, shocking warmists and skeptics alike with some hardcore doubt about the outcome of the Muir-Russell and other Climategate inquiries.”
The London-based publication is regarded as the most widely read news journal for scientists with seperate U.S. and Australian editions as well as a British version that has weekly sales of 170,000.
In its anonymous editorial NS adds, “But what happened to intellectual candour - especially in conceding the shortcomings of these inquiries and discussing the way that science is done. Without candour, public trust in climate science cannot be restored, nor should it be.”
Russell Inquiry ‘Left Stones Unturned’
The editorial accuses Sir Muir Russell’s team of leaving “stones unturned.”
The inquiry is also scolded for deciding against any detailed analysis of all the 1,000+ emails leaked onto the blogosphere in November 2009. Indeed, NS points out the Russell Inquiry examined only “three instances of possible abuse of peer review, and just two cases when CRU researchers may have abused their roles as authors of IPCC reports.”
In pulling no punches the inquiry is condemned for not having studied any of the hundreds of thousands more unpublished emails not leaked from the CRU Internet servers. The NS laments, “Surely openness would require their release.”
New Scientist: the ‘Ideas Magazine’
When accused in 2006 by science fiction writer Greg Egan of possessing “a sensationalist bent and a lack of basic knowledge by its writers” the magazine’s then editor, Jeremy Webb, was quickly on the defensive describing NS as “an ideas magazine - that means writing about hypotheses as well as theories.”
As may be seen by the reaction to the editorial, some observers perceive a ‘first step’ towards a paradigm shift away the global warming theory by the staff of NS. The greenhouse gas theory has been the subject of several high profile refutations in recent months by self-proclaimed ‘denier,’ Alan Siddons and other eminent international climate researchers.
Aside from the commentary of former meterologist and climate analyst, Anthony Watts at WUWT, other climate skeptic blogs have given a curt reaction. Bishop Hill appending the following NS quote, “Without candour, public trust in climate science cannot be restored, nor should it be,” with a solitary: “Yup.”
While another respected climate analyst, Canadian professor, Ross McKitrick of the Department of Economics, University of Guelph, Ontario, in the National Post (July 17, 2010), points to the dubious claims that the Russell Inquiry panel was ‘independent.’
McKitrick cites the fact that of the five panellists, one had to resign after giving a radio interview exonerating the scientists before the investigation began. Another is the vice-president of BP, formerly in charge of Gulf of Mexico drilling, who could not possibly have devoted his attention to the CRU investigation and “The panellist who guided the inquiry was Geoffrey Boulton, who spent 18 years at the University in the department under investigation.”
With evident cynicism McKitrick also points out that the inquiry held no hearings, only interviewed the clique of accused scientists and declined to consult any critics.
References:
Bishop Hill.com ,’New Scientist on Russell,’ (July 18, 2010), accessed: July 20, 2010.
McKitrick, R., ‘Global warming skepticism well justified,’ (July 17, 2010), National Post, (accessed online: July 20, 2010).
New Scientist, ‘Without candour, we can’t trust climate science,’ (July 14, 2010), Magazine issue 2769, (accessed online July 20, 2010).
WattsUpWithThat.com, ‘Bonus Quote of the Week: The New Scientist rocks our world,’ ( July, 19, 2010), accessed: July 20, 2010.
Read more at Suite101: Does New Scientist foresee Paradigm Shift on Climate Theory?
Jul 17, 2010
NOAA’s Jan-Jun 2010 Warmest Ever: Missing Data, False Impressions
By Anthony Watts
From Alan at Appinsys, who emails that he was inspired by this story on WUWT: A spot check on NOAA’s “hottest so far” presser
“NOAA: June, April to June, and Year-to-Date Global Temperatures are Warmest on Record”
The following figure from NOAA shows the temperature anomaly of January - June 2010 compared to the 1971-2000 base period for 5x5 degree grids.
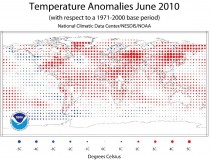
The problem with the above map: data quality and data manipulation.
The following sections provide some spot checks on the areas of the world exhibiting the most warming according to NOAA. The gridded historical data graphs shown in these sections are from the Hadley CRUTEM3 database for January - June. (CRUTEM3 uses a 1961-1990 base period whereas the NOAA data above is for a 1971-2000 base period. This simply shifts the anomalies on the vertical scale, but does not affect the relative trends.)
It is clear from the following sections that NOAA performs manipulations to create false impressions from the data, including assigning temperature increases were there is zero data.
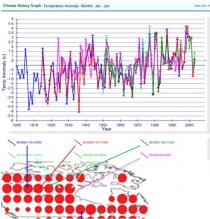
Spot Check - Northern Africa
It is apparently much hotter than usual in the Sahara. But where is the data? Several of the 5x5 degree grids have zero stations (indicated by the black arrows). Many of the others have one station with very limited historical data. There seems to be an inverse correlation between the number of stations and warming - more stations in a 5x5 degree grid and less warming is observed.
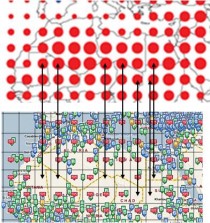
The map figure above shows the location of stations in the NOAA GHCN database (blue G or green B icons) and the red 5x5 icon indicates whether data exists in the Hadley CRUTEM3 database - a 5x5 degree gridded database used by IPCC (plotted here). The grid lines are 5×5 degree grids.
In many of the 5x5 degree grids showing 4 degrees warming according to the NOAA map, there are only one or two stations. The figure below shows some of the “hot-spots” in the NOAA map displaying January - June average temperature anomaly from the Hadley CRUTEM3 database for 1900 - 2009. In no cases is the warming close to what NOAA indicates.
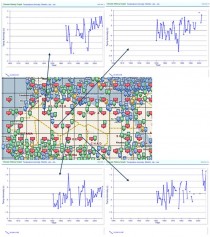
There is a severe problem with lack of historical data in Africa as well as lack of coverage and gaps in the data. NOAA’s algorithms spread the low quality data across areas that have no data as well as showing warming that isn’t really there.
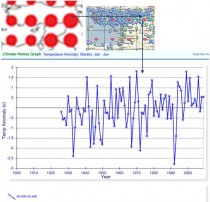
One must really question the NOAA data when even the areas with many stations seem misrepresented. The following figure shows the area of eastern Turkey which has many stations and shows no warming in Jan-Jun through 2009, but suddenly according to NOAA has 4 degrees in 2010.
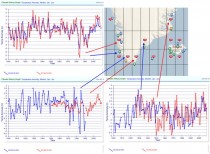
Spot Check - Greenland
It is apparently much hotter than usual in Greenland. But where is the data? Most of the 5x5 degree grids have zero stations (only some of which are indicated by the black arrows). Most of the grids with data have one station. The two hottest spots on the NOAA Greenland area show 5 degrees warming and have no data.
Some of the Greenland stations have long-term data. The figure below shows some of the “hot-spots” (that actually have data) in the NOAA map displaying January - June average temperature anomaly from the Hadley CRUTEM3 database for 1900 - 2009.
Spot Check - Canada
It is apparently much hotter than usual in Greenland. But where is the data? Most of the 5x5 degree grids have zero stations (only some of which are indicated by the black arrows). Most of the grids with data
Read more and see full size images here.
-----------------
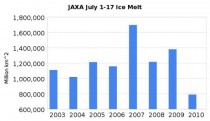
See Watts Up with that’s new sea ice tracking page here. See where the first part of July has seen the lowest ice melt of the last 8 years in the JAXA record here.
Jul 16, 2010
Science Behind Climate Change Under Fire - Again
Brian Lilley, Toronto Sun
The scientific accuracy of the United Nations’ climate change reports are coming under fire again. In a scandal that dates back to January and was dubbed Amazongate at the time, it has been confirmed that claims of the Amazon burning up due to climate change were sexed-up and pulled from activist literature.
The 2007 UN report on climate change, the one that has helped guide government efforts to spend billions of dollars to combat global warming, claimed that “Up to 40% of the Amazonian forests could react drastically to even a slight reduction in precipitation.” The real report, drawn from a website and paid for by pressure group the World Wildlife Fund, says something quite different.
While the UN reports are often described as scientific and peer-reviewed, this claim of the Amazon being at high risk originated on a website of a Brazilian advocacy group. The original claim read that “Probably 30 to 40% of the forests of the Brazilian Amazon are sensitive to small reductions in the amount of rainfall.”
The World Wildlife Fund says it cannot be held responsible for how the UN climate change group used its data.
So far no one seems to be able to say how a report that claimed parts of the Brazilian rainforest “probably” are “sensitive” was hyped to make things sound more dire.
Professor Ross McKintrick says no one should be surprised that such mistakes end up in these massive reports.
“The IPCC (Intergovernmental Panel on Climate Change) doesn’t have the internal rigour that one would expect of it,” said McKintrick from his office at the University of Guelph. “Nothing is in the process to prevent activist rhetoric from appearing.” McKintrick, who teaches environmental economics and has had his own battles with the accuracy of climate change reports, says the calculations used in the UN reports are often not checked for accuracy and even the much-vaunted peer-review process does not guarantee that the information used is correct.
Amazongate is not the only claim that relies on information from activist groups.
Toronto author Donna Lafamboise recently led a team of citizen auditors through the 2007 climate change report and found heavy use of reports from Greenpeace and the World Wildlife Fund. That report is published at noconsensus.org.
Laframboise says Greenpeace was cited at least eight times and the WWF at least nine times, despite both groups having clearly stated activist goals when it comes to climate change.
“This is shocking in a report that the public has been told relies solely on peer-reviewed research published in scientific journals,” said Laframboise.
The UN has appointed a team of academic experts to give advice on how to avoid these mistakes in the future, but McKintrick says the UN isn’t really serious about changing anything.
He points out that the authors for the next massive climate change report have already been chosen and many were part of the last error-riddled effort.
Work has also already begun on the follow-up to Copenhagen; climate experts will try to hash out a new climate deal in Cancun, Mexico, in November. Read more here.
-----------
Carbon Cycle Data Casts Doubt On Climate Models
By Dr. David Whitehouse
Many factors and feedback mechanisms are involved in the climatic response to increasing carbon dioxide levels. The uncertainties in these effects, and our general ignorance, make it almost impossible to predict what will happen to the Earth’s ecosystems as temperature increases. This has not stopped some predicting on the basis of climate models that the world will get drier as the temperature increases and for example, as a consequence, the Amazon rain forest will die and be replaced by savannah or bare earth.
For years, there has been debate about the effect of air temperature on global respiration - or the accumulated metabolic processes of organisms that return carbon dioxide to the atmosphere from Earth’s surface. It’s vital to understand this process if we are to have any ability to predict what may happen if the global temperature rises in the future. But how does the global carbon cycle react to global warming?
Most studies suggest that ecosystem respiration around the world is highly sensitive to increasing temperatures, while the majority of computer climate models suggest otherwise. Studies just published may throw some light on this problem as they suggest that the temperature sensitivity of the natural exhalation of carbon dioxide from ecosystems has been overestimated and needs to be reevaluated.
Scientists from the Max Planck Institute for Biogeochemistry pooled large amounts of data from FLUXNET - an international initiative established more than 10 years ago to monitor exchanges of carbon dioxide between Earth’s ecosystems and the atmosphere - with remote sensing and climate data from around the world to investigate the spatial distribution of mean annual Earth’s Gross Primary Production (GPP) - which is the total amount of carbon dioxide that terrestrial plants produce each year via photosynthesis - between 1998 and 2006.
FLUXNET involves data from 250 sites around the world. Scientists have strung sensors on high towers above grasslands and forests to record water and carbon dioxide concentrations in the air as well as meteorological data. This enables them to calculate how much carbon dioxide is taken up and released by a certain ecosystem. Satellites provide data about how much light vegetated surfaces absorb. Until such data was available scientists had to use estimates.
The researchers found that the rate at which plants and microorganisms release carbon dioxide changes little with temperature variations. This is in contrast to earlier investigations that suggested a three or fourfold increase in carbon dioxide production at quite modest temperature changes. According to one of the researchers, Markus Reichstein, “Particularly alarmist scenarios for the feedback between global warming and ecosystem respiration thus prove to be unrealistic.”
The measurements also contradict another assumption used in climate models: that the respiration of the ecosystems in the tropics and temperate latitudes is not as temperature sensitive as higher latitudes. This does not seem to be borne out by these FLUXNET observations. “We were very surprised that different ecosystems react relatively uniformly to temperature variations.”
These findings will have implications for predicting the relationship between carbon dioxide balance and global warming. It is currently not possible to predict whether the response between these two factors. According to Reichstein, “The study shows very clearly that we do not yet have a good understanding of the global biogeochemical cycles and their importance for long-term developments.”
A parallel study by Christian Beer from the Max Planck Institute for Biogeochemistry in Jena, Germany, and colleagues looked at the GPP. They estimate that the world’s plant life inhales 123 billion metric tons of carbon dioxide every year.
The study showed that uptake of carbon dioxide is most pronounced in tropical forests, which are responsible for 34 percent of the inhalation of carbon dioxide from the atmosphere. Savannas account for 26 percent of the global uptake, although they occupy about twice as much surface area as tropical forests.
The study suggests that water is the most important factor that influences photosynthesis. Over 40 per cent of the Earth’s vegetated surface plants photosynthesise more when the supply of water increases. This is a potentially important finding as some climate models appear to overestimate the influence of rainfall on global carbon dioxide uptake.
A curious finding is that it is the temperate grasslands and shrublands that are most affected by water variation and not tropical rain forests. According to Reichstein, “Here too, we need to therefore critically scrutinize the forecasts of some climate models which predict the Amazon will die as the world gets drier.” See more here.
H/T Benny Peiser here.
Jul 16, 2010
Lorne Gunter: Don’t forget Climategate just yet
By Lorne Gunter, National Post
Last week, the third of three allegedly independent inquiries into last fall’s Climategate scandal at Britain’s Climate Research Unit (CRU) was concluded. Like the other two, it found troubling behaviour by the scientists at the CRU or by the University of East Anglia, of which the CRU is a part - most notably attempts to hide data from critics and from government investigators. Yet in the end, all three conclude no real wrongdoing occurred and that the basic premise of mainstream climate science - that our climate is changing for the worse and human activity is at least partly to blame - remains undamaged by the scandal.
Whew! Thank goodness for that.
The trouble is, while green groups have trumpeted this trio of reports as vindication of their climate alarmism, it would be hard to conclude any of the reports was truly independent. Indeed, in a recent posting on the website of the the Atlantic magazine (hardly a hotbed for climate-change skepticism), the magazine’s senior editor Clive Crook says that at best the three are “mealy-mouthed apologies; at worst they are patently incompetent and even wilfully wrong.”
Geoffrey Boulton, for instance, one of the five panellists on the most recent inquiry into the leaking last November of damaging emails among many of the world’s leading climate scientists, was for 18 years a member of the University of East Anglia’s School of Environmental Sciences, the department in which the CRU is housed. In other words, far from being an independent investigator, he was a former colleague of the scientists involved.
Early last December, just days after the Climategate emails were exposed, Mr. Boulton even signed a petition vouching that the scientists involved “adhere to the highest levels of professional integrity.” Talk about going into an investigation with one’s mind already made up.
And consider Ronald Oxburgh, chairman of the second investigation released on behalf of East Anglia in April. He is honorary president of the Carbon Capture and Storage Association; chairman of Falck Renewables, a wind-energy company seeking to set up wind farms all across Europe; and an advisor to Climate Change Capital, an investment firm specializing in start-up funding for low-carbon energy and manufacturing companies. Lord Oxburgh is also a former chairman of a biodiesel firm, a director of the Global Legislators Organisation for a Balanced Environment and a past U.K. chairman of Shell Oil.
During his tenure at British Shell in the mid-2000s, Lord Oxburgh told the BBC he saw “little hope for the world” unless carbon dioxide emissions could be “dealt with.” Climate change, he admitted, made him “very worried for the planet.”
Not for a second do I doubt that Lord Oxburgh is one of the world’s leading geologists, as claimed. Still his past stance on climate change (and the very real, current possibility of him personally profiting from it) make him an odd choice as chairman of a supposedly objective review into a scandal that threatens to shatter the scientific basis for concern about global warming.
The Atlantic’s Mr. Crook says of the first of the Climategate investigations - one concluded last March by Pennsylvania State University into the involvement of one of its professors, Michael Mann - that it “would be difficult to parody.” Penn State found no evidence of wrongdoing by Mr. Mann because, it argued, he was a very successful fundraiser for research projects, he got published in lots of academic journals and he won lots of awards.
As Mr. Crook points out, the university said there was no chance anything was untoward about Mr. Mann’s activities because “Dr. Mann’s reporting of his research has been successful and judged to be outstanding by his peers. This would have been impossible had his activities in reporting his work been outside of accepted practices in his field.”
I am not saying Mr. Mann is a fraudster, or even trying to imply it. But the above statement is about as meaningful as the U.S. Securities and Exchange Commission concluding there was no need to investigate Bernie Madoff simply because he had convinced so many smart, successful people to give him their money.
Does any of this prove the Climategate investigations were wrong? Not directly. But it should call into question investigators’ motivations and cause the public to question their findings. See post here.
|

