Jul 08, 2010
Climategate: reinstating Phil Jones is good news - the CRU brand remains toxic
By Gerald Warner
"Move along now, please… Nothing to see here...” was the predictable burden of Sir Muir Russell’s investigation into Climategate. Are we surprised? Any other conclusion would have made world headlines as a first for the climate change establishment. This is the third Climategate whitewash job and it would be tempting to see it as just as futile as its predecessors. That, however, would be to underrate its value to the sceptic cause, which is considerable.
This is because Russell’s “Not Guilty” verdict has been seized upon as an excuse to reinstate Phil Jones at the University of East Anglia CRU, this time as Director of Research. That is very good news. It spells out to the world that the climate clique looks after its own; that there is no more a culture of accountability and job forfeiture for controversial conduct in AGW circles than there is in parliamentary ones; that it is business as usual for Phil and his merry men. Or, to put it more bluntly, the brand remains toxic.

Apart from Michael “Hockeystick” Mann, there is no name more calculated to provoke cynical smiles in every inhabited quarter of the globe than that of Phil Jones. The dogs in the street in Ulan Bator know that he and his cronies defied FOI requests and asked for e-mails to be deleted and that people only do that if they have something to hide. Every time some UN-compliant government or carbon trading interest group tries to scare the populace witless with scorched-earth predictions of imminent climate disaster and cites research from the East Anglia CRU - of which Phil Jones is Director of Research - it will provoke instant scepticism.
As I pointed out earlier this week, the AGW lobby has recently shown signs of belatedly getting its PR act together, of assuming a false humility, of being less dogmatic, in an effort to win round public opinion. It is an attempt to turn over a new leaf - on the Dave Cameron model, to detoxify the brand. It is, of course, a ploy to recover lost credibility and impose upon the public more effectively. Putting Phil Jones back at the centre of the picture completely wrecks that rehabilitation scheme. It is as if Dave appointed Lady Thatcher to oversee his “compassionate Conservatism” agenda.
The problem for the more sophisticated warmist propagandists is that, on this occasion, the attempt to construct a Cameron-style “modernised” climate scare party collided with the primeval instinct of the British academic and public-sector establishment to protect its own. It shares with the Spanish Legion the principle of never abandoning its wounded. None of our boys will ever be taken out by the sceptics, is the rule, no matter how badly they goof up.
So, this is an important and encouraging development for everybody dedicated to blowing the AGW scam out of the water. It means one of the principal pillars of the IPCC that might have been cosmetically repaired now remains irretrievably compromised. The next few years will be critical for the survival of the AGW superstition: it is now, partly due to Climategate and partly to the global recession, fighting for survival. This latest blunder significantly lessens its prospects of pulling through. A big thank you to Professor Edward Acton and the climate establishment at the University of East Anglia and elsewhere, without whose purblind sense of entitlement the eventual overthrow of this false orthodoxy might not have been possible.
See post here.
Jul 08, 2010
What’s It Mean For The Bloke On The Bus?
By Andrew Orlowski, the Register
The University of East Anglia’s enquiry into the conduct of its own staff at its Climatic Research Unit has highlighted criticisms of the department and staff conduct - but clears the path for the individuals concerned to carry on.
The CRU played an important role in writing the UN’s IPCC summaries on climate science, so the issue is far from a parochial one. The most serious charge is poor communication; Sir Muir Russell even calls for “a concerted and sustained campaign to win hearts and minds” to restore confidence in the team’s work.
Russell was appointed by the institution to investigate an archive of source code and emails that leaked onto the internet last November. The source code is not addressed at all. His report suggests that the problems were of the academics’ own making, stating that they were “united in defence against criticism”. Yet the enquiry found that despite emails promising to “redefine” the peer review publication process, and put pressure on journal editors, staff were not guilty of subverting the IPCC process, and their “rigour” and “honesty” were beyond question.
Leading academics were called for written and oral evidence before the Russell enquiry, and in many cases the report accepts their account of events. For example, wearing their IPCC hats, the academics are cleared of excluding critical evidence, and yet bending the rules to include supporting studies. To reach this particular conclusion, for example, the report finds a criterion: a “consistence of view” with earlier work… by the academics in question.
Despite the gentlemanly and clubbable tone, the report nevertheless has deep systemic criticism of the institution and the team’s processes. UEA “fell badly short of its scientific and public obligations”, according to one review panel member, Lancet editor Richard Horton.
It criticises the team’s decision to curtail a temperature reconstruction at 1960, and splice on an instrumental temperature record, without explanation, noting:
“The figure supplied for the WMO Report was misleading in not describing that one of the series was truncated post 1960 for the figure, and in not being clear on the fact that proxy and instrumental data were spliced together. We do not find that it is misleading to curtail reconstructions at some point per se, or to splice data.”
There’s a selective approach to criticism of scientific techniques - officially, Muir Russell says it doesn’t examine the validity of scientific arguments. But as you can see, in places, it does. On the issue of the Yamal reconstruction, CRU is cleared but the related issues of basing the reconstruction on a limited sample of proxies, and using techniques which exaggerate and validate outliers (basically, one tree) is not addressed.
FOIA
On compliance with Freedom of Information requests, the enquiry found the CRU team evasive, and “found a tendency to answer the wrong question or to give a partial answer”. They also found “a clear incitement to delete e-mails, although we have seen no evidence of any attempt to delete information in respect of a request already made”. (Jones had told a US academic that “I think I’ll delete the file rather than send to anyone” and requesting deletions from other staff.)
The defensiveness “set the stage”, says Russell, for the barrage of FOIA requests last year, but “clear and early action would likely have prevented much subsequent grief”. It adds that “CRU helped create the conditions for this campaign by being unhelpful in its earlier responses”.
The institution itself had failed to anticipate the new FOIA regime, and let the academics run amok. Strangely it calls for “a concerted and sustained campaign to win hearts and minds” to restore confidence.
On information handling, the report “highlighted significant problems in the areas of: imbalance of authority; lack of effective challenge at appeal; over dependence on single individuals; inadequate escalation processes and limited strategic oversight.”
The panel avoided examining the scientific work of the CRU Team - as have the two other reviews of the leaked archive by Lord Oxburgh, and the Commons Select Committee on science. If the academics had used bats’ wings or tea leaves to create temperature reconstructions, that wasn’t a matter for any of the panels to judge. And this is undoubtedly a shortcoming. The voter is entitled to see the evidence and understand the arguments that may answer the question: “Is this climate thing anything to worry about?”
It’s worth taking a step back from the details of Climategate to understand the background to the enquiries. By understanding what the CRU academics do, we can judge how important the criticism of them may be - or not.
What did the CRU crew do?
The Climatic Research Unit is one part of the picture, an important one, but not at the heart of climate theory. They’re not physicists, and they don’t do the physics upon which competing explanations of how the climate works stand or fall, once measured against observation. So in that sense, ‘Climategate’ isn’t a ‘Climategate’ - it isn’t a Scopes Trial of the global warming theory.
But CRU does two important things that shape our understanding of the present and the past. CRU is one of a small number of bodies that calculates global temperature readings (of where we are today), and is probably the pre-eminent body that performs historical temperature reconstructions, quite literally writing or re-writing history. And its importance is magnified since the leading academics are also lead authors of the UN’s IPCC reports - the vast volumes policy makers like to cite as their scientific justification, but rarely read.
In the absence of a strong physics story, this temperature work became hotly contested. The biggest bone of contention is whether modern, post-1850 warming is anomalous. If it is, then the likelihood that we were in strange and uncharted territory is much greater. If it isn’t, then consequently, the need for “urgent political action” - involving sweeping changes to industrial policy and social policy - became weaker.
The father of modern climatology, HH Lamb, founded CRU in 1972, and the building the academics work in takes his name. When Lamb contributed to the first IPCC report in 1990 the historical temperature record looked like this (enlarged here).
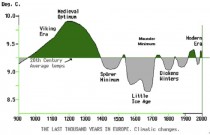
Lamb’s temperature graph, featured in the first IPCC report in 1990
By 2001, it looked like this (enlarged here).
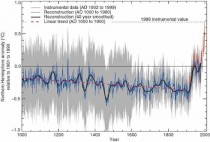
Without the error bars (grey), the Medieval Warm Period disappears Source: IPCC TAR 2001
What Climategate is largely about, then, is whether the academics were justified in making that Medieval Warm Period disappear.
Unfortunately, none of the three ‘independent’ reviews have grappled with this. The absence of anomalous warming doesn’t, as some skeptics say, make the problem go away. But it takes the issue back onto the blackboard, back into realms of the potential threats. It certainly removes much of the impetus for a sweeping and urgent political program of mitigation.
Yet in the academics’ own words, we learn that the recent burst of warming, while real, is far from unusual.
One of the leading CRU academics, Keith Briffa, wrote that:
“I know there is pressure to present a nice tidy story as regards ‘apparent unprecedented warming in a thousand years or more in the proxy data’ but in reality the situation is not quite so simple. We don’t have a lot of proxies that come right up to date and those that do (at least a significant number of tree proxies ) some unexpected changes in response that do not match the recent warming. I do not think it wise that this issue be ignored in the chapter…
“For the record, I do believe that the proxy data do show unusually warm conditions in recent decades. I am not sure that this unusual warming is so clear in the summer responsive data. I believe that the recent warmth was probably matched about 1000 years ago.”
In an interview in February, CRU director Phil Jones agrees that recent warming isn’t statistically significant, and is matched by previous periods in the instrumental record - such as 1860 to 1880.
The sensible end of the climate debate hinges on how much of a lasting consequence an increase in CO2 has on the climate system. Some prominent scientists who as recently as 2001 were lead authors for the IPCC don’t dispute there’s an effect, but maintain that once it’s worked itself out, the effect is small.
Proponents of large positive CO2 feedbacks have pointed to various ‘fingerprints’ which are absent, or refuse to manifest themselves. Greenhouse gas warming was supposed to create a telltale warming of the troposphere, but instrumental readings show no such evidence. More recently, they have posited that CO2 must have caused warming, but this is still trapped in the oceans. This “missing heat” has yet to be found, and in the Climategate archive we find US scientist Kevin Trenberth expressing frustration: “The fact is that we can’t account for the lack of warming at the moment and it is a travesty that we can’t,” adding that “we can’t definitively explain why surface temperatures have gone down in the last few years. That’s a travesty!”
For Trenberth, if we had better instruments, we’d find the heat. For skeptics, the heat might not be there.
By the mid-2000s the issue had become so politicised the academics were acting like a “priesthood”, in the words of environmental writer Fred Pearce, no friend of the skeptics. As Jones wrote in an email: “Many of us in the paleo field get requests from skeptics (mainly a guy called Steve McIntyre in Canada) asking us for series. Mike and I are not sending anything, partly because we don’t have some of the series he wants, also partly as we’ve got the data through contacts like you, but mostly because he’ll distort and misuse them.”
In a sense the CRU team are carrying the can for the physicists’ failure to do the science. See full post here.
Jul 07, 2010
The Muir Russell CRU Apologia is out
By Anthony Watts
The Muir Russell Report is out. Read here in PDF. Unfortunately Russell is another apologist who doesn’t ask relevant questions of both sides, only one side. Even BBC now thinks the CRU wears a halo: click for full screencap Compare that to:
CRU’s Dr. Phil Jones’s response of 21/02/2005 to Warwick Hughes’s request for Jones’s raw climate data:
“Even if WMO agrees, I will still not pass on the data. We have 25 or so years invested in the work. Why should I make the data available to you, when your aim is to try and find something wrong with it.”
Here’s some comments around the web, link to the report follows:
Steve McIntyre:
I guess the main question coming out of the Muir Russell report is when is he going to be appointed to the House of Lords and his choice of appelation. Lord Muir of Holyrood?
They adopted a unique inquiry process in which they interviewed only one side - CRU. As a result, the report is heavily weighted towards CRU apologia - a not unexpected result given that the writing team came from Geoffrey Boulton’s Royal Society of Edinburgh.
The issue here is whether Wahl and Briffa violated IPCC rules. Asking Overpeck about this is not very helpful since Overpeck is hardly impartial. Muir Russell had to examine what Wahl and Briffa actually did and then examine the conduct against actual IPCC rules, not after-the-fact opinions by parties to the conduct.
The findings of the Fred Pearce Inquiry on this point stand:
These back channel communications between the paper’s authors [Wahl] and IPCC authors [Briffa], including early versions of the paper, seemed a direct subversion of the spirit of openness intended when the IPCC decided to put its internal reviews online.
More from Steve:
Muir Russell said that it wasn’t the scientists weren’t to blame for defamatory language in emails, e.g. calling “frauds”, “fraudit”, “bozos”, “morons” and so on. It was Microsoft’s fault.
They asked:
Indeed, some submissions have characterised them as ‘unprofessional’, or as evidence of CRU’s contribution to a ‘poisoned atmosphere’ in climate science.
Muir Russell blamed email itself for the language:
14. Finding: The extreme modes of expression used in many e-mails are characteristic of the medium. Crucially, the e-mails cannot always be relied upon as evidence of what actually occurred, nor indicative of actual behaviour that is extreme, exceptional or unprofessional.
They observe:
Extreme forms of language are frequently applied to quite normal situations by people who would never use it in other communication channels.
But defamatory language by CRU scientists in emails is still defamatory language. That the scientists wouldn’t use such language face-to-face with the targets of their abuse is no justification. Ask Tiger Woods about email.
------------
UPDATE from Anthony:
Yes, I’m sure Sir Muir didn’t think this was unprofessional...nooo. Pictures are worth a thousand words, but I doubt Sir Muir ever looked at this one:
From: “thomas.c.peterson” To: Phil Jones Subject: [Fwd: Marooned?] Date: Mon, 19 Feb 2007 11:10:02 -0500
Hi Phil,
I thought you might enjoy the forwarded picture and related commentary below.
I read some of the USHCN/GISS/CRU brouhaha on web site you sent us. It is both interesting and sad. It reminds me of a talk that Fred Singer gave in which he impugned the climate record by saying he didn’t know how different parts were put together. During the question part, Bob Livzey said, if you don’t know how it is done you should read the papers that describe it in detail. So many of the comments on that web page could be completely addressed by pointing people to different papers. Ah well, you can lead a horse to water but you can’t make it think.
Warm regards,
Tom
Nature 445, 567 (8 February 2007) | doi:10.1038/445567a
Editorial
“The IPCC report has served a useful purpose in removing the last ground from under the sceptics’ feet, leaving them looking marooned and ridiculous.”
- Thomas C. Peterson, Ph.D. NOAA’s National Climatic Data Center 151 Patton Avenue Asheville, NC 28801 Voice: +1-828-271-4287 Fax: +1-828-271-4328
Here’s NCDC Tom Peterson’s (GHCN lead investigator) cartoon diddle:
See much more here.
Jul 06, 2010
Greenhouse Protection Racket
by Marlo Lewis
Climate policymaking in our Nation’s capital often resembles the heavy-handed dialogue of old-time mobster films.
“Are you gonna come along quietly, or do I have let the California Air Resources Board (CARB) muss ya up?” That was pretty much the line White House Environment Czarina Carol Browner took to obtain the auto industry’s support for the joint EPA/National Highway Traffic Safety Administration (NTSHA) greenhouse gas (GHG) emission/fuel economy standards rule. EPA is now in a position both to determine the stringency of fuel economy standards for the auto industry and to set climate policy for the nation. Yet the Clean Air Act provides no authority to regulate fuel economy and says nothing about greenhouse gases or global climate change. “Badges? We don’t need no stinking badges.”
Modus Operandi: Threaten in Order to Remove the Threat - for a Price
Here’s how the regulatory mugging went down.
In February 2009, EPA Administrator Lisa Jackson commenced a rulemaking to reconsider Bush EPA Administrator Stephen Johnson’s denial of California’s request for a waiver to establish its own greenhouse gas emission standards program. Because the waiver would also allow other states to adopt the California program, because GHG emission standards are mainly fuel economy standards by another name, and because automakers would have to reshuffle the mix of vehicles delivered for sale in each “California” state to achieve the same average fuel economy in those states, Jackson’s proceeding threatened to subject automakers to inefficient, consumer-thwarting, regulatory patchwork.
In May 2009, Czarina Browner conducted secret negotiations with automakers, CARB Chairman Mary Nichols, and major environmental groups. Browner required participants to take a vow of silence and forbade anyone to take notes, violating the Presidential Records Act. The closed-door negotiations produced an “historic agreement” whereby automakers would support the EPA/NHTSA GHG/fuel economy standards rule and California and other states would deem compliance with the federal standards as compliance with their own.
In addition, observes Rep. Darrel Issa (R-Calif.), at the same time the Browner-led negotiations were taking place, “the government was also engaged in bailout talks with General Motors (GM) and Chrysler,” resulting in “an ownership stake for the federal government of 61% of GM and 8% of Chrysler, respectively.” Whether Browner literally made the auto industry an offer it could not refuse, with the sweetener of financial assistance also contingent on the industry’s embrace of GHG regulation, we may never know.
This much is clear. By granting California’s request for a waiver, EPA created the threat of a regulatory patchwork, enabling the White House to offer “protection” in the form of the joint GHG/fuel economy standards rule. The protection “fee” was the auto industry’s unquestioning support for the joint rule and its prerequisite, EPA’s endangerment rule.
Thus, the Auto Alliance became the key industry lobby opposing Sen. Lisa Murkowski’s resolution to overturn EPA’s endangerment rule. The Alliance warned that if the endangerment finding were overturned, the “historic agreement” would unravel, confronting automakers with “the alarming possibility of having to comply with multiple sets of conflicting fuel economy standards.”
That is correct, but only because EPA Administrator Jackson, reversing her predecessor’s decision, granted California a waiver to establish GHG emission standards for new motor vehicles. An obvious solution would be to overturn the waiver. After all, the Energy Policy and Conservation Act clearly prohibits states from adopting laws or regulations “related to fuel economy,” and the California motor vehicle emissions program is basically a de facto fuel economy program. The waiver effectively repeals federal law, violating the separation of powers. Not that you’ll ever hear about that from Government Motors. Mum’s da woid.
Mirage of Regulatory Certainty
The auto industry is not the only target of the greenhouse protection racket. For years, the greenhouse gang has been saying that only cap-and-trade can end the intolerable “regulatory uncertainty” facing the electric power sector, energy-intensive manufacture, and other CO2 emitters. But who created the uncertainty in first place if not the self-same advocates of cap-and-trade? If they were serious about relieving uncertainty, they would disavow the regulatory schemes for which they have been campaigning.
Businesses lobbying for cap-and-trade in the name of certainty should read the fine print. The Waxman-Markey and Kerry-Boxer bills, for example, have multiple escalater clauses setting the stage for dramatic increases in regulatory stringency well beyond the bills’ explicit emission reduction targets. Similarly, the bills’ “findings” presenting the “scientific” rationale for cap-and-trade are not mere rhetorical fluff but precedents for litigation targeting emission sources considerably smaller than those explicitly identified as “covered entities.” Enact such legislation, and the only certainty is that regulatory burdens will grow unpredictably.
Too Clever by Half
Last but not least, cap-and-taxers sell their policy as protection from litigation-driven greenhouse gas regulation under the Clean Air Act. The sales pitch goes something like this: “Pretty nice company you got deah, shame if sumpin’ bad waz to happen to it. Everybody needs protection. You need protection. It’s called Kerry-Lieberman.” Note the familiar pattern. The gang pushing cap-and-trade as protection from EPA are the same folks who sued EPA to regulate greenhouse gases and who vilified Sen. Murkowski and others for attempting to stop EPA.
This is all too clever by half. If cap-and-trade dies in the 111th Congress, which seems increasingly likely, the Obama administration and its allies on the Hill will take sole ownership of the compliance costs, job and GDP losses, and “absurd results” arising from EPA regulation of greenhouse gases under the Clean Air Act.
Democratic leaders may not recognize it yet, but they have painted themselves into a corner. They have become the Party of Endangerment - the party endangering the U.S. economy by championing the endangerment rule, with all its cascading regulatory effects. See post here.
Jul 06, 2010
Solar Influences
By Dr. David Whitehouse
In the early 1990’s a paper by Christensen was published that showed a striking correlation between the length of the sun’s sunspot cycle and the global average annual temperature, Fig 1. The shorter the cycle (short cycles are more intense) the higher was the earth’s annual temperature. It seemed to indicate that the sun was the dominant influence on the earth’s temperature variations. Click here to enlarge.
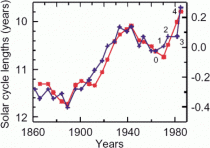
It is certainly striking that since the later part of the 19th century and throughout the 20th century there has been a general increase in the Earth’s global average temperature at the same time that the strength of the solar cycle was increasing in intensity as measured by the number of sunspots. In the last half of the 20th century four out of the five most intense solar cycles occurred (the second largest cycle was around 1780) including the strongest ever which was in the 1950’s.
Christensen linked these two together in what appeared to be a pleasing way. However, a few years after the work was published others found flaws in the way the final four (out of 24) data points were plotted. In Christensen’s paper the length of the solar cycle decreased between 1950 - 1990 with the last data point showing that the cycle length shortened at the same time that the recent global warming period started (post 1980). When this was corrected the concordance between the solar cycle length and the earth’s rising temperature broke down as it became apparent that the length of the solar cycle showed no trend as the earth’s temperature rose post-1980. Fig 2. Click here to enlarge.
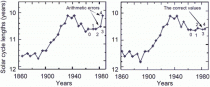
It was heralded as proof of the hypothesis that the recent, post-1980 warming spell could not be due to the sun. Whereas many argued that the sun was the dominant factor prior to this period, the rate of warming was recently too great to be accounted for without a human influence. See here and here.
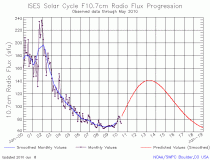
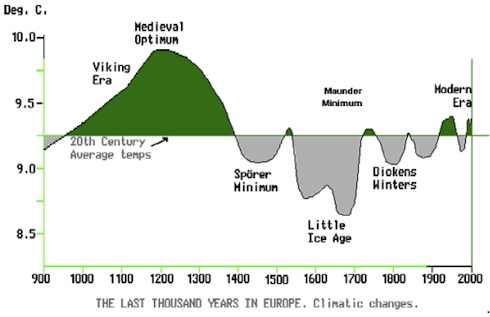
It is now clear that in the past decade or so our sun has been behaving differently from the way it did during the 20th century. The current sunspot minimum has gone on for far longer than was expected. It did begin to show signs of an upturn in activity earlier this year, but has since faltered again. See solar flux below and it and other indices enlarged here. Some have suggested that this is a sign of the start of a new Dalton-like minimum - a period of low solar activity that occurred about 1800.
Since the invention of the telescope and with it the ability to monitor the frequency of sunspots there has been two periods when sunspots were lacking. They are the Dalton Minima, which lasted about 20 years and the much longer Maunder Minimum of approx 1640 -1710. Both periods are coincident with cooler conditions on earth though we do not have a satisfactory explanation for how this occurs. Some believe that the Maunder Minimum can be explained by a combination of a reduction in solar radiation combined with volcanic effects, other are not so sure.
It is interesting to see that as time goes by more and more solar scientists are expressing the possibility that it might be the start of a period similar to the Maunder Minimum. Only time will tell.
The important point is that in previous periods of relatively low solar activity the solar cycle behaved differently than it did when solar activity was stronger.
In broad agreement with the Christensen relationship, during the Dalton Minimum the period of the solar cycle increased. The longest cycle ever recorded was during the Dalton period. Also as sunspot numbers declined at the start of the period the solar cycle became more symmetrical and cycle rise and fall times converged at about 6 years.
The last complete solar cycle, number 23 lasted 12.6 years (May 1996 - Dec 2008). Only four solar cycles have lasted longer than 12 years. Two of them, cycle 4 (1784 - 1798: 13.7 years) and cycle 5 (1798 - 1810: 12.6 years) occurred just before and during the Dalton Minimum.
What’s more cycle 22 was unusually short (Sept 86 - May 1996: 9.7 years). There have been only two other solar cycles that have been shorter, Cycle 2 and cycle 3 which occurred immediately prior to the lengthy cycles of the Dalton Minimum.
Scrutinising the gradient of sunspot cycle rise and falls it is obvious that usually the cycle rise is more rapid than the fall. During the Dalton Minima however they became equal. Then they resumed their normal relationship only to move once more to equality around 1910 when there were a few relatively weaker sunspot cycles. It is possible that the same thing is happening again. If so this would imply an approx 100 year periodicity, though this is only am impression, as we only have reliable sunspot records since about 1750.
It is possible that changes in solar cycle lengths take place before periods of low solar activity, like the one we may be entering at present, and that might influence the later part of figure 1. If this is the case then the breakdown in the Christensen relationship post 1980 cannot be said with certainty to be due to the rise of human influences on the climate above solar ones.
See more here.
|

