UPDATE: Read here why Barbara Boxer needs to be ousted in te next election after this bit of demogoguery and more here.
See also how Auto Dealers Demolish White House Rationale for Opposing Murkowski Resolution in letter to senators here.
Today (June 10, 2010), the Senate will vote on Alaska Sen. Lisa Murkowski’s resolution of disapproval (S.J.Res.26) to overturn the U.S. Environmental Protection Agency’s finding that greenhouse gas emissions endanger public health and welfare.
The endangerment finding is both trigger and precedent for sweeping policy changes Congress never approved. Wednesday, I will speak in support of S.J.Res.26 at an 11:00 a.m. Capitol Hill press conference hosted by Americans for Prosperity. My prepared statement follows.
Prepared Statement of Marlo Lewis
Sen. Murkowski’s resolution would stop EPA from ‘enacting’ controversial global warming policies through the regulatory back door. The endangerment finding is a classic case of bureaucratic self dealing. EPA has positioned itself to determine the stringency of fuel economy standards, set climate policy for the nation, and even amend provisions of the Clean Air act - powers Congress never delegated to the agency.
Worse, America could end up with a pile of greenhouse gas regulations more costly than any climate bill or treaty the Senate has declined to pass or ratify, yet without the people’s representatives ever voting on it. The Murkowski resolution puts a simple question before the Senate: Who shall make climate policy - lawmakers who must answer to the people at the ballot box or politically unaccountable bureaucrats, trial lawyers, and activist judges appointed for life? Because the endangerment finding dramatically expands EPA’s power, the agency fiercely opposes S.J.Res.26, depicting it as an attack on science.
That is nonsense. Although a strong case can be made that the endangerment finding is scientifically flawed, the Murkowski resolution neither takes nor implies a position on climate science.
The resolution would overturn the “legal force and effect” of the endangerment finding, not its reasoning or conclusions. It is a referendum not on climate science but on who should make climate policy. Climate policy is too important to be made by non-elected bureaucrats. That ought to be a proposition on which all Senators can agree.
The importance of Thursday’s vote is difficult to exaggerate. Nothing less than the integrity of our constitutional system of separated powers and democratic accountability hangs in the balance.
----------------
PRESS RELEASE NCPPR
National Center for Public Policy Research
Washington, D.C. - Senators will soon consider a resolution to pare back an Environmental Protection Agency plan to regulate greenhouse gases - a plan that would raise energy costs.
On June 10, the U.S. Senate will consider a “resolution of disapproval” regarding a 2009 ruling made by the EPA in late 2009 claiming six greenhouse gases are a threat to public health. This makes these gases—carbon dioxide, methane, nitrous oxide, hydrofluorocarbons, perfluorocarbons, and sulfur hexafluoride—subject to regulation under the Clean Air Act.
“The EPA’s endangerment finding endangers our economy and our liberty,” said Deneen Borelli, full-time fellow with the Project 21 black leadership network. “The EPA’s effort to regulate greenhouse gases will affect virtually every aspect of our economy and our lives. In expert opinion, this will result in higher energy costs and job losses while having—by their own admission—virtually no effect on cooling global climate.”
Senate Joint Resolution 26, introduced by Senator Lisa Murkowski (R-AK), would use the Congressional Review Act to overturn the administrative ruling. This would allow elected representatives to deliberate and pass their own regulations as Congress sees fit.
“I don’t want an unelected bureaucrat imposing rules and regulations on businesses that are essentially a tax on energy and will be passed along to consumers—many of whom are just getting by as it is,” said Tom Borelli, director of the Free Enterprise Project of the National Center for Public Policy Research.
“Opposition to the cap-and-trade bill that was jammed through the House of Representatives is one of the key positions of the tea parties, and this endangerment finding is cap-and-trade by other means,” noted Deneen Borelli. “Americans are already skeptical enough of lawmakers these days. Watching them pass up an opportunity to do what they were sent to Washington for will restore no lost faith in the government.”
“This resolution is a major indicator of where our republic is headed. Senators will determine if they are going to cede their authority as an elected representative of the people to largely unaccountable bureaucrats,” added Tom Borelli. “While the White House is eager for the EPA to seize regulatory authority, rank-and-file Americans such as those found in the tea party movement are troubled and will be watching to see who will be for and who will be against this massive federal power grab.” See release here.
The National Center for Public Policy Research is a non-profit, free-market think-tank established in 1982 and funded primarily by the gifts of over 100,000 recent individual contributors. Less than one percent of funding is received from corporations.
-----------------
The EPA Runs Amuck By Alan Caruba
On Thursday, the Senate will vote on S.J. Resolution 26. It is an effort to stop the Environmental Protection Agency from regulating “greenhouse gas emissions” without any legislative accountability. If the vote fails, the EPA will be free to continue its assault on the nation’s economy and every aspect of your personal life.
Here’s what my friend, Dr. Kenneth P. Green, a scholar with the American Enterprise Institute, had to say about the energy and environment “advisor” to President Barack Obama:
“Carol Browner’s selection as ‘energy coordinator’ (sometimes called energy czar) virtually guarantees that the Obama administration’s energy and environmental policies will be anything but moderate.”
“Her two terms as Environmental Protection Agency boss were marked by adversarialism, punitive enforcement actions, draconian tightening of environmental regulations and the message that business is destructive of the environment and dishonest about the cost of environmental regulations.”
And that was just the nice things he had to say about Browner. It is worth noting that Browner has been the lead spokesman about the BP oil spill for the Obama administration after it became obvious that Ken Salazar, the Secretary of the Interior, was generating negative public reaction to his ‘get tough’ approach and there have been few public statements issued by Dr. Steven Chu, the Secretary of Energy.
The current administrator of the EPA is Lisa Jackson who learned her trade working under Browner until she was picked to head the New Jersey Department of Environmental Protection. A Browner acolyte, Jackson has presided over an EPA run amuck.
Jackson will be remembered for leading the EPA fight to get carbon dioxide declared a “pollutant” that can then be regulated under the Clean Air Act. This is the same reasoning put forth by the constantly renamed Cap-and-Trade Act that is was a “climate” bill and has now become something else. It is based on the same totally bogus “science” that gave us “global warming” until Mother Nature decided that the Earth should begin to cool about a decade ago.
President Obama just announced that, just like the much-hated healthcare reform bill, he is going to devote himself to getting Cap-and-Trade passed by Congress. Combined, they should be called The Destroying America’s Economy Act.
Suffice to say that, other than oxygen, carbon dioxide is the other gas on which all life on Earth depends. It’s what all vegetation “breaths” and, coincidently, it is what all humans and other animals exhale. It has nothing to do with the climate.
Dr. Green points out that, “When it comes to climate change, she is a disciple of Al Gore for whom she worked from 1988 to 1991,” adding that “Browner believes that ‘climate change is the greatest challenge ever faced’ and that the EPA is the agency to face it.”
I have been watching the EPA in action since it was created in the 1970s by Mr. Watergate himself, Richard Nixon. It has since expanded like a cancer cell, doing a lot of damage along the way. There must be a sign on the wall of EPA headquarters that says, “If it’s a chemical, we will ban it.” On May 24, the EPA announced it was discussing the perils of oil dispersants in the Gulf of Mexico. Please, let’s do nothing to disperse the oil!
From its earliest days, the EPA set out to ban or limit the use of any and all pesticides nationwide. They have never stopped. It is essential to understand that what passes for EPA “science” is merely a charade to advance their agenda.
It can cost up to $15 million or more for a company to get a pesticide registered for use. If you take away the pesticides, all that’s left is the pests, but this simple truth is lost on the EPA. They have come up with a proposed new “permit requirement that would decrease the amount of pesticides discharged to our nation’s waters and protect human health and the environment.” If you really want to protect human health, you have to kill the billions of insect and rodent pests that have always spread disease.
So far in the last month, the EPA has announced they will release “a draft health assessment for formaldehyde that focuses on evaluating the potential toxicity of inhalation exposures to this chemical.”
Also announced was news that the EPA “is initiating a rulemaking to better protect the environment and public health from the harmful effects of sanitary sewer overflows and basement backups.” They are “reviewing” Florida’s coastal water quality standards, a move that will wreak havoc on its agricultural and tourist industries.
Another EPA announcement noted that “It just got harder for a TV to earn the U.S. Environmental Protection Agency’s Energy Star. Starting May 1, 2010, TV’s that carry the government’s Energy Star label are, on average, 40 percent more efficient than conventional models.” This is all done in the name of reducing “greenhouse gas emissions” when, in fact, this is the baseless justification for the global warming hoax.
If at this point, you are beginning to think the EPA is just a tad intrusive regarding your basement backup problems, the kind of television set you should purchase, and other previous decisions such as how much water your toilet can use or the banning of incandescent light bulbs nationwide, you will be happy to know that in May the EPA took the time to “encourage ways to travel green by checking into an Energy Star labeled hotel.”
While in the hotel, you are advised to “turn off the lights and TV when leaving the hotel room”, “adjust the thermostat to an energy-saving setting so it doesn’t heat or cool the room while empty”, “to open curtains to take advantage of daylight when possible”, and “re-use linens to save both water and energy.”
If, by now, you’re getting the feeling that the EPA is more intrusive into the most mundane aspects of your life than any other government agency or combination of agencies, you’re right.
And very little of it has anything to do with protecting your health or the environment. It has everything to do with advancing a fanatical green agenda intended to threaten every form of energy production, manufacturing process, property rights, and your right to make a wide range of personal lifestyle decisions. See post here.
RADIO INTERVIEW
Shannon Goessler, the executive director of the Southeastern Legal Foundation will be discussing SLF’s lawsuit against the EPA over CO2 regulation on Global Cooling Radio. The interview will take place this Saturday at 10:00 AM CDST here.
By Dr. Patrick Michaels, Senior Fellow of the CATO Institute
In today’s odd academic culture, including the world of climate science, academic freedom applies selectively. People use their positions and their email for politicking and electioneering and have no trouble retaining their jobs. But using your email to send out some inconvenient, apolitical weather data that says something your boss or your governor may not like can get you fired.
I can’t count the number of emails I received in my thirty years at University of Virginia where this faculty member or that administrator urged me to support some piece of legislation. But the latest email kerfluffle, involving Phil Mote, director of the Oregaon Climate Change Research Institute at Oregon State University, goes a bit further.
Mote was upset that Art Robinson, a physician from Cave Junction, Oregon, won the Republican primary for Oregon’s fourth congressional district. That’s because Robinson was behind the “Oregon Petition Project,” in which over 31,000 people, largely science professionals (including over 9,000 with doctorates), signed on to a document stating that there was “no scientific evidence” that greenhouse gas emissions could cause ‘catastrophic heating” in the foreseeable future.
Robinson did not harp on this issue in the campaign. Instead he ran against the general politics of 12-term incumbent Pete deFazio, including his March vote for President Obama’s health care bill. With that one, deFazio probably voted himself out of Congress.
In response to Robinson’s Republican primary win, Mote wrote to his colleagues at Oregon State University emphasizing that Robinson was the force behind the Petition Project and that, if he were elected, OSU would be put in the “tragic ranks of our climate colleagues at University of Oklahoma...and University of Alaska,” where elected officials have the temerity to disagree with Mote about global warming. He signed his missive as “Director, Oregon Climate Change Research Institute and Oregon Climate Services.” Eventually he emailed his colleagues, calling his initial message a “mistake.”
Hardly. Consider the shady track record of climatology in the Pacific Northwest and elsewhere. Mote’s previous position was Washington State Climatologist at the University of Washington, where he repeatedly pointed to a 50% decline in mountain snows between 1950 and the mid-1990s. But there are data available after 1995 and before 1950, and when all the data are taken together - thanks in part to the fact that it has snowed plenty there in the last 15 years- the strong decline is erased.
Mote’s then Associate State Climatologist, Mark Albright, emailed this information to several people. When he refused to stop telling the whole truth, Mote terminated his position. Across the Columbia River at Oregon State University, the previous head of the Oregon Climate Services, George Taylor, put all of the Cascade snowfall data online for anyone to see. The long-term records clearly showed no decline at all. Ted Kulongoski, Oregon’s “green” governor, told Taylor he could no longer refer to himself as Oregon State Climatologist. Oregon State University showed little support, too (although Taylor was twice elected as President of the American Association of State Climatologists). Taylor quit rather than continue in such an environment.
George Taylor got into trouble for simply for telling the truth about the lack of a big decline in mountain snowfall, and his university seemed to not care. Mark Albright lost his position for the exact same offense. Phil Mote, who terminated Albright, replaced George Taylor.
Two things are very disturbing. Where was the hue and cry over “academic freedom” over the Albright and Taylor incidents? And how could Mote originally think it was just perfectly fine to use his official position concerning a local race for Congress?
Intolerance appears to be endemic in academic climatology. In Climategate, the University of East Anglia found nothing wrong with a culture of climate bullies blatantly attempting to bend the canon of knowledge, which is the peer reviewed scientific literature. Penn State did the same in its investigation of Michael Mann’s vituperative emails found in the East Anglia package.
The overarching issue is that political correctness has so infected the academy that academic freedom with regard to global warming is now a figment, while electioneering on the public’s dime results in no punishment whatsoever. See more and comments here.
See recent ICECAP story on this situation with Mote here with link backs to prior stories on the snowpack.
The calmest sun in a century may rustle up more hurricanes, as the season officially begins. Research by Robert Hodges and Jim Elsner of Florida State University found the probability of three or more hurricanes hitting the United States goes up drastically during low points of the 11-year sunspot cycle, such as we’re in now.
Our star is just beginning to eke out of the lowest period for sunspots in a century. Years with few sunspots and above-normal ocean temperatures spawn a less stable atmosphere and, consequently, more hurricanes, according to the researchers.
Years with more sunspots and above-normal ocean temperatures yield a more stable atmosphere and thus fewer hurricanes. “The effect is actually amplified under certain conditions,” said James Elsner, a geography professor at Florida State University. Hodges is his graduate student. “With fewer sunspots, there’s less energy at the top of the atmosphere,” Elsner explained, therefore the atmosphere above the hurricane is cooler.
When that happens, the differential creates more atmospheric instability and stronger storms, energizing what might otherwise remain tropical storms into hurricanes. Chances of three or more hurricanes hitting the U.S. increase from 20 to 40 percent in years when sunspots are in the lowest 25 percent, compared with years when they’re in the highest 25 percent, the researchers found.
There’s only a 25 percent chance of at least one hurricane hitting the United States in peak sunspot years. The chance spikes to 64 percent in the lowest sunspot years. The scientists studied the frequency of hurricanes and sunspots from 1851 to 2008, adjusting for other hurricane-influencing factors such as El Nino and changes in sea-surface temperature. They recently presented their findings in a poster at the American Meteorological Society’s conference in Arizona. Their work also was published this month in the scientific journal Geophysical Research Letters (Elsner, J. B., T. H. Jagger, and R. E. Hodges (2010), Daily tropical cyclone intensity response to solar ultraviolet radiation, Geophys. Res. Lett., 37, L09701, doi:10.1029/2010GL043091).
UV light’s effects
For hurricanes to form, the atmosphere must cool fast enough, at the right heights, to make it unstable enough for storm clouds to form. This thunderstorm activity enables heat stored in the ocean to be unleashed, developing into tropical cyclones. As the “heat-engine theory” of hurricanes goes, storm strength decreases when the layer near the hurricane’s top warms.
Although sunspots are cooler, darker blotches on the sun, more solar flares form near the increased magnetic activity within sunspots. “The spots are kind of an indication of the amount of energy,” Elsner explained. “The more sunspots, the more active the sun.” Sunspots ebb and flow on 11-year cycles. There can be anywhere from 200 to 300 sunspots a day at the cycle’s peak or as few as one to three dozen at the cycle’s low, as has been happening in recent months.
Solar radiation also varies as the spots pass across the sun’s surface while the star rotates on its axis about once a month. The sun’s yearly average radiance during its 11-year cycle only changes about one-tenth of one percent, according to NASA’s Earth Observatory. But the warming in the ozone layer can be much more profound, because ozone absorbs ultraviolet radiation. Between the high and low of the sunspot cycle, radiation can vary more than 10 percent in parts of the ultraviolet range, Elsner has found.
When there are more sunspots and therefore ultraviolet radiation, the warmer ozone layer heats the atmosphere below. Their latest paper shows evidence that increased UV light from solar activity can influence a hurricane’s power even on a daily basis.
Sunspots no factor
The researchers say their finding could help improve hurricane intensity forecasting. But because of the novelty of the research, the National Hurricane Center has yet to factor in sunspots in its forecast. Nor do hurricane seasonal forecasters such as Phil Klotzbach and William Gray’s team at Colorado State University. “Thus far we’ve not used sunspot information at all,” said Chris Landsea, science and operations officer at NOAA’s National Hurricane Center in Miami. “If it does prove to be a robust signal, we’ll certainly consider including it in the future. But Id’ need to see more evidence.” Read story and comments here.
See more on the solar cycle variances of ultraviolet effect on climate here.
ONE of the numerous artifices deployed by the now-retreating climate-extremist movement has been the careful avoidance of any debate with anyone on the skeptical side of the case who happens to know anything about climate science or economics.
As the extremists lose the argument and become more desperate, that is changing. John Abraham, a lecturer in fluid mechanics at a bible-college in Minnesota has recently issued - and widely disseminated - a hilariously mendacious 83-minute attempted rebuttal of a speech by me about the climate last October in St. Paul, Minn.
So unusual is this attempt actually to meet us in argument, and so venomously ad-hominem are Abraham’s artful puerilities, that climate-extremist bloggers everywhere have circulated them and praised them to the warming skies.
As usual, though, none of these silly bloggers makes any attempt actually to verify whether what poor Abraham is saying actually has the slightest contact with reality. One such is George Monbiot, a scribbler for the British Marxist daily propaganda sheet, The Guardian. What is Monbiot’s qualification to write about climate science? Well, like Abraham, he a “scientist”. Trouble is, he’s a fourteenth-rate zoologist, so his specialism has even less to do with climate science than that of Abraham, who nevertheless presents himself as having scientific knowledge relevant “in the area”.
Here’s the thing. All of the sciences are becoming increasingly specialized. So most scientists [ like Abraham and, a fortiori, the accident-prone Monbiot among them - have no more expertise in predicting or even understanding the strange behavior of the complex, non-linear, chaotic object that is the Earth’s climate than the man on the Clapham omnibus.
They pretend otherwise, of course. Almost four years ago, when I wrote a 2500-word article in the Sunday Telegraph pointing out that the notion of a very large climate warming attributable to future increases in CO2 concentration was scientifically ill-founded, Monbiot wrote a scathing 1800-word response in the Guardian, in which he made a dozen laughably elementary scientific errors. Monbiot made the mistake of pretending that he understood the fundamental equation of radiative transfer, of which he had plainly not previously heard.
Here it was I who had the advantage: before writing the article in the Telegraph I had spent three months tracking the equation down, because - though it converts changes in the flow of radiation at a planetary surface to changes in temperature, and is therefore essential to discovering how much warming a given increase in CO2 concentration will deliver - the IPCC’s 2001 and 2007 climate assessment reports do not mention it once.
And why not? Well, put simply, the equation shows that at the temperatures prevailing on Earth you need a very large increase in radiative flux to achieve a pathetically small increase in temperature. That’s not the sort of thing the climate-extremists want known, so they carefully don’t mention it, which is one reason why Monbiot hadn’t heard of it.
Ever since I compelled the Guardian to publish a letter from me correcting Monbiot’s invincible ignorance of elementary planetary physics and undergrad math, Monbiot has seized every chance to have a go at me whenever one of his climate-extremist Comrades asserted that I’d gotten something wrong. And how he crows at the news of Abraham’s “evisceration” of my Minnesota speech.
Abraham’s approach is novel. He’s saying not that I got one thing wrong but that I got just about everything wrong. And how plausible is that? A couple of pointers. First, it’s now June 2010, and I spoke in October 2009, almost eight months ago. I’ve made a lot of speeches since. Why has it taken Abraham so long to cobble together his ramblings?
The answer - and, as I shall show, it is the right one - is that his deliberately dishonest personal attack on my integrity and reputation is an ingenious fiction, he knows it, and he has therefore had to go to some elaborate and time-consuming lengths to do his inept and socially-inadequate best to conceal the steps he has taken to hide the truth and make his nonsense look plausible.
Secondly, during the eight months of “investigation” (Abraham’s word) that he carried out, at no single point did he ever contact me to ask me to clarify one of the numerous references which, he said over and over again, were not clear in my slides.
That failure on his part to check with me when he could not find the sources of my data was clearly deliberate. He didn’t want to give me any advance notice that he was planning to launch a widely-disseminated attack on me, because otherwise I might have pointed out his errors to him in advance, and that would have made it a great deal more difficult for him to get away with publishing them.
In a short space I won’t have time to cover more than a representative selection of Abraham’s errors. Let’s begin, though, with the question of sources.
“Monckton’s data don’t even agree with themselves”
Abraham says I displayed two graphs, both citing NOAA as the source, showing the downward global mean surface temperature trend since 2001, but ‘ by an elaborate point-by-point comparison - he shows that the two graphs are slightly different from one another. Why, he asks, can’t I even make sure that my own data agree with themselves? His implication is that presenting temperature data is something that laymen really can’t be expected to get right.
What Abraham has done, here as elsewhere, is to wrench my data deliberately out of the context in which I actually (and accurately) presented them, and then to lie about it. The truth is that the first graph, plainly labeled “scienceandpublicpolicy.org”, is the SPPI’s well-known global-temperature index, compiled monthly from four separate global-temperature datasets, as Abraham well knew because I explained in my talk. It was not a NOAA graph, and was not labeled as such. Naturally, therefore, it differed at some points from the NOAA graph.
Abraham went on and on about how a graph shouldn’t have been labeled with the name of an institution such as “scienceandpublicpolicy.org” unless it was that institution that had compiled the graph. That, of course, as he could have discovered if he had bothered - or, rather, dared - to check, was indeed the institution that had compiled the graph, taking the arithmetic mean of the global-temperature anomalies from the HadCRUt, NCDC, RSS, and UAH datasets.
But - and this was the point I made, though Abraham was remarkably careful not to say so - I had showed the SPPI’s four-sources graph in testimony before Congress, to show that there had been global cooling for seven or eight years, and Tom Karl, the director of NOAA’s National Climatic Data Center, who had been present, had failed to admit after questioning from a leading Congressman that global temperatures had indeed been falling for the best part of a decade. He had wriggled and waffled.
So the Congressman had asked me to write proving my result, and I had done so by preparing the second graph, from Tom Karl’s own NCDC (it was labeled as such), which had also showed a pronounced downtrend in global temperatures. Abraham knew this, because I had said so in my talk. But he also knew that practically no one watching his 83-minute presentation would go to the lengths of looking up what I had actually said. He believed that he could get away with flagrant and deliberate misrepresentations - provided that at all points he was careful never to consult me while planning and circulating his attack.
“Monckton’s data are not properly sourced”
Even when the source is in fact plainly stated on my slides, Abraham is prone to say I have not provided the source. I had shown a graph, which I had said was compiled by satellite, of temperatures at the summit of Mount Kilimanjaro, where there has been no warming for 30 years. The graph was plainly labeled “UAH”, which - as a mere Bible-College lecturer in fluid mechanics might not know, but anyone with any real knowledge of climate science would of course know - is the University of Alabama at Huntsville, one of only two organizations producing regularly-published satellite-based global temperature records.
Another instance: Abraham said I had done a search because I was bored, and had found that between the beginning of 2004 and the beginning of 2007 just 539 papers containing the search phrase “global climate change” had been published, and that not one of them had provided any evidence for any catastrophic consequence of any anthropogenic warming anywhere. However, he had searched Google Scholar and had found 628,000 references, a few of which, he said, showed catastrophic consequences of “global warming”.
The truth is entirely different. First, I am never bored when I am present. What I actually said in my talk - and Abraham knows this, because he spent eight months trying to take it apart - was that “I’m boring that way - I check things”. And I had checked the climate-extremists’ claims of catastrophe by consulting a paper by Klaus-Martin Schulte, published in 2008. The extract from the paper was labeled “Schulte, 2008” on my slide, in quite large letters.
It was not I but Schulte who had done the search, as I had said in my talk. It was not Google Scholar (most of whose sources are not peer-reviewed papers) but the ISI Web of Science database of peer-reviewed, learned journals that Schulte searched, as I had said in my talk. It was not the “containing all of the words” search option that Schulte had used, though that is the option Abraham used, but the “exact-phrase” option, which returned only 539 papers.
If Abraham had had the courtesy to check either with me or by looking up Mr. Schulte’s paper on the Web of Science database, to which his Bible College subscribes, he would have found that Mr. Schulte used this phrase because Naomi Oreskes, a science historian, had previously used the same phrase in researching climate papers up to the end of 2003. Schulte had carried her research forward to mid-February 2007, and his paper had been published in 2008.
Abraham then trots out various papers he found in his Google Scholar search, one of which says that the world is warming because of human activities: but that was not the point made in my slide. My point was that not a single one of the 539 papers searched by Schulte had provided evidence for catastrophe. Abraham also mentions a paper he found that talks about extinctions that are predicted as a result of “global warming”. But though he may perhaps not have understood this, for many of his political stamp do not - prediction is not the same thing as evidence. The fact is that most of the predictions of the climate-extremists and their overworked X-Box 360s and Playstation Vs have proven to be spectacular exaggerations.
Gore was right and Monckton wrong about sea level
The first slide of mine that Abraham criticizes is one in which I show the table of contributions to observed sea-level rise from various sources as published in the IPCC’s 2007 report, and draw from it the conclusion that the measured contribution of the Greenland and West Antarctic ice sheets to “global warming” is 6 cm/century, while Al Gore’s film predicts 610 cm (20 feet) of imminent sea-level rise.
Abraham again artfully distorts or carefully omits what I actually said. First, he says that the IPCC predicts 20-50 cm of sea-level rise this century, not 6 cm. Well, yes it does, but the reason for the difference is that the IPCC’s figure (which still amounts to below 2 feet, not 20, and it’s actually rising at just 1 ft/century at present, if that) is for sea-level rise from all sources, chiefly thermosteric expansion, not just from ice-melt.
But Gore’s prediction of a 20 ft sea-level rise is, as his movie makes quite clear, based on ice-melt alone. Abraham says Gore was right to worry about a very large rise in sea level because the IPCC specifically excludes ice-melt from its calculations, saying it cannot yet be quantified. No, the IPCC specifically includes ice-melt in its calculations, as the table on my slide showed, but it does add that “dynamic” effects of unpredictable but theoretically-possible large-scale failure on the ice sheets are not taken into account.
Abraham says that if either Greenland or the West Antartic ice sheet were to melt sea level would indeed rise by around 20 feet, and that, he says, is where Gore got his figure.
Just two problems with that. First, the IPCC also says, on the very page quoted by Abraham, that even if there were a major collapse of the ice the Greenland ice sheet would not entirely disintegrate for millennia, a phrase that was also used in the IPCC’s 2001 report, where it was made plain that surface temperatures at least 2 Celsius degrees higher than today’s would have to persist for several millennia before either the Greenland or the West Antarctic Ice Sheet could melt away. True, the British Antarctic Survey disagrees with the IPCC and maintains that the WAIS is in imminent danger of collapse, but so far even the IPCC has not bought that alarmist story.
Secondly, as I said in my talk, but as Abraham very carefully failed to point out in his, both sides of this particular argument have been carefully heard in the impartial forum of the British High Court. The British Government, unsuccessfully attempting to defend Gore on this point, had eventually been compelled - when confronted with what the IPCC actually says about several millennia - to concede that Gore’s 20 feet of sea-level rise was a flagrant exaggeration.
And the judge’s finding could not have been blunter: “The Armageddon scenario that he [Gore] depicts is not based on any scientific view.” And that quotation, too, was on one of my slides, but Abraham carefully failed to mention it, or to check with me to find out how it was that the judge had come to that conclusion.
Nor, of course, did Abraham mention the slide in which I showed a picture of the St. Regis Tower, San Francisco, with a map showing it to be just feet from the allegedly-rising ocean at Fisherman’s Wharf, and a statement that in 2005, the very year in which Gore was making up his alarmist movie, he had spent $4 million buying a condo there. Would he have bought that condo if he had seriously thought sea level would imminently rise by 20 feet? That, as my Latin Grammar would put it, is “a question expecting the answer ‘No’”.
Well, I could go on. And on and on. And on and on and on. Just about every one of the 115 slides presented by Abraham contains serious, serial, material errors, exaggerations, or downright lies. All I have been able to do here is to give you some flavor of how unscientific, inaccurate, and deliberately mendacious Abraham is.
Keep an eye out at www.scienceandpublicpolicy.org. There, in due course, will appear the letter I am now drafting to Abraham, asking him several hundred pertinent questions designed to make him and anyone who may think of relying upon him understand that academic dishonesty and deliberate lying on this scale and with this amount of public circulation is just not acceptable, and will not be tolerated.
If Abraham wishes to present himself as “a scientist” - as he does throughout his talk - then it is as a scientist that he will be judged, found lamentably wanting, and dismissed. He may like to get an apology and retraction in early: for I am a Christian too, and will respond kindly to timely repentance. See blog here.
Icecap Note:See new book Warnings, by Mike Smith, Chief Meteorologist with Weather Data and now Accuweather available in the Icecap bookstore here.
Last week’s dispute between the Weather Channel and Dish Network seems to have been resolved (note link from that announcement leads nowhere), with the Weather Channel getting most of what it wanted from the satellite service provider.
But the underlying issues—whether the Weather Channel’s new entertainment programming is doing a dangerous disservice to viewers when major storms loom, and the increasing pressure from cable channels for greater fee concessions from service providers—are far from resolved and are only going to get worse in the months ahead.
Viewers at home should brace themselves for rough winds.
Some 14 million Dish subscribers nearly lost the Weather Channel last week when Dish threatened to drop the channel from its lineup. The stated reason: the channel’s switch from its all-forecasts-all-the-time format to showing Friday night movies (some clearly weather-themed, like ‘The Perfect Storm’ or ‘The Avengers,’ some only tangentially weather-related, like ‘Misery,’ which opens with a blizzard).
Dish—and some viewers—argued that the channel was no longer providing a needed service, and Dish even threatened to create its own competing weather channel and add it to the lineup.
But the conflict was also about money, reports the Los Angeles Times, with the Weather Channel seeking an extra penny per month per subscriber in carriage fees, according to industry analyst firm SNL Kagan. That adds up to about $1.7 million per year, which Dish will presumably pass on to its customers. The demand for increased fees—and the corresponding threat that the channel would go dark—is a scenario that has already recurred several times this year between other channels and other cable operators, and is one that is likely to keep happening, with subscribers ultimately paying the price in the form of a bigger cable or satellite bill.
According to the New York Times, Dish Network wasn’t the only source of complaints about the channel’s entertainment programming; so had some viewers, and so had the network’s star anchor, Jim Cantore. When viewer Patricia Vollmer voiced her anger via Twitter about the airing of a movie on April 23 instead of breaking storm news, Cantore tweeted back, “You’re not alone.”
The channel told the New York Times that its policy is to interrupt the movie with breaking severe weather coverage, but it doesn’t necessarily follow that policy always. On April 30, during a tornado outbreak, Cantore told his Twitter followers that the movie would be canceled, but later, he apologized to viewers, tweeting that management had misled him by telling him “we were bagging the ‘movie’ to do what this network was created for.” The Times reports that the channel did air an alternate live feed in areas directly affected.
The Weather Channel is hardly alone in diluting its brand by adding questionable entertainment programming in order to boost ratings. Cable channels from MTV (the “M” once stood for music, you young’uns) to TLC (once The Learning Channel, now better known as home to the likes of Jon & Kate) to AMC (once upon a time, “American Movie Classics,” now just general movies and original drama series like ‘Mad Men’, A&E (which once stood for “Arts & Entertainment” but is now largely reality shows) to Bravo (ditto) to the History Channel (what’s historical about ‘Pawn Stars’?) have been trending that way for years. Still, no viewer’s life or property is at risk because Bravo decides to air a ‘Real Housewives’ marathon instead of ‘Inside the Actors Studio.’
So the Weather Channel’s movement toward movies over meteorology was the pretext for Dish’s threat to yank the channel and replace it with its own weathercast as of last Friday. But the hour came and went, and negotiations continued. In the end, the channel agreed to provide Dish subscribers with a second channel of just local forecasts, but it also got Dish to agree to drop the threat of a rival weather network. Perhaps more important, it got Dish to cough up that extra penny. (Dish subscribers currently pay about 11 cents per month for the channel.)
The settlement marks at least the fourth time in 2010 that a channel has gone dark, or nearly gone dark, because it’s been pushing for a higher fee. There was a tussle between the Fox broadcast network and Time Warner Cable at the beginning of the year, one between Cablevision and Scripps that briefly darkened Food Network and HGTV, and one between Cablevision and ABC that was resolved moments before the Oscars, ABC’s biggest program of the year, was to air. Terms of those settlements haven’t been disclosed, but it seems clear that channels have been emboldened to challenge service providers and demand carriage fee increases. The Weather Channel may be adding just a penny a month to Dish subscribers’ bills, but in a 500-channel universe, all those pennies can really add up.
It would be nice if, for the extra cash cable and satellite viewers will likely be paying, we’d get the unique (and sometimes, vitally useful) programming these channels were once known for, instead of just more reality shows and movie reruns.
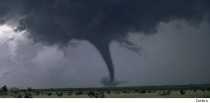
Check out Jim Cantrone in action during a storm last year.