May 29, 2010
‘Merchants of Doubt’ delves into contrarian scientists
By Seth Brown Special for, USA TODAY
No matter how overwhelmingly the scientific community may back a research study, naysayers can always find a scientist to support the opposing view on issues ranging from tobacco smoke to global warming.
According to science historians Naomi Oreskes and Erik Conway, the same contrarian scientists keep popping up no matter the topic: Fred Seitz, Fred Singer and Bill Nierenberg, to name three. All physicists, Seitz and Nierenberg worked on the atomic bomb, while Singer, a rocket scientist, worked on observation satellites.
Oreskes and Conway have co-authored a history of these Merchants of Doubt. Their subjects have stood against the scientific consensus on a number of issues. They gained traction because a media concerned with fairness gave them equal time.
In 1953, a scientific study demonstrated that mice painted with cigarette tar developed fatal cancers. In December of that year, tobacco companies created the Tobacco Industry Research Committee (TIRC) to cast doubt on the link between tobacco and cancer. It worked. Between 1954 and the late 1970s, more than 100 lawsuits were filed against tobacco companies and not one plaintiff received money, the authors say.
In 1979, tobacco giant R.J. Reynolds hired Seitz, former president of the National Academy of Sciences, as a consultant. His credibility helped TIRC counter research linking smoking with health problems. As one tobacco industry executive put it in an infamous memo, “Doubt is our product.”
In 1993, the tobacco industry published Bad Science: A Resource Book, a handbook containing ideas for messages that could be used in sound bites to weaken scientific claims. Examples:
•Too often science is manipulated to fulfill a political agenda.
•Government agencies betray the public trust by violating principles of good science to achieve political goals.
•The Environmental Protection Agency adjusts science to support preconceived public policy prescriptions.
•Decisions based on bad science cost society heavily.
•EPA’s tobacco reports allow political goals to guide research.
•Proposals that target tobacco smoke are an excuse for new laws to take individual liberties.
Writing about secondhand smoke, Singer once said, “If we do not carefully delineate the government’s role in regulating (danger) ... there is essentially no limit to how much government can ultimately control our lives.”
What Singer and Seitz did for tobacco, Nierenberg did for global warming. In 1995, the Intergovernmental Panel on Climate Change (IPCC) concluded that human-caused climate change was a reality. By 2004, global warming was becoming the scientific consensus. The National Academy of Sciences commissioned a study, naming to the panel economists and scientists including Nierenberg. A committee Nierenberg chaired could not get the economists and scientists to agree, so the synthesis supported Nierenberg’s economic argument.
The scientists had argued that a “wait-and-see” attitude was untenable, but Nierenberg discounted distant costs and ascribed the rise in temperature to the sun. Nierenberg’s message carried, even though other scientists such as Bert Bolin called Nierenberg “simply wrong.”
Eventually, most of the scientific community stopped working with Nierenberg, according to Oreskes and Conway.
Though a veteran of tobacco wars, Singer also joined the global warming fray. In an article on the topic, he said, “The scientific base for a greenhouse warming is too uncertain to justify drastic action at this time.” He had voiced similar reservations about acid rain and ozone depletion.
The authors give examples of conservative think tanks supporting the status quo:
•The George C. Marshall Institute opposes the views of the Union of Concerned Scientists, an advocacy group for environmental solutions that included late astronomer Carl Sagan.
•The Competitive Enterprise Institute, which promotes free-market economics and minimal business regulation, dismisses research of Rachel Carson, author of Silent Spring, a book decrying overuse of the pesticide DDT.
•The Advancement of Sound Science Center promotes the idea that environmental science on issues such as smoking, pesticides and global warming is “junk science.”
The center is operated by Steven Milloy, a self-described libertarian and columnist at FoxNews.com. Milloy once wrote an article blasting the Arctic Climate Impact Assessment, a report of the Union of Concern Scientists that explores the impact of a warming Arctic. At the time, it was not revealed that Milloy got money from ExxonMobil.
All in all, Oreskes and Conway paint an unflattering picture of why some scientists continue to stand against the overwhelming scientific consensus on issues at the center of public discussion.
Merchants of Doubt: How a Handful of Scientists Obscured the Truth on Issues from Tobacco Smoke to Global Warming, By Erik Conway and Naomi Oreskes, Bloomsbury Press, 368 pages, $27
ICECAP Note: Naomi Oreskes has been totally discredited in her findings relative to the unanimity of AGW supporting peer review. She is very likely the most dishonest science historian in the country.
-----------------
Are Climate Alarmists losing the Mainstream Media?
By Marc Sheppard
In the past week, two mainstream media giants have apparently recognized that the debate over manmade global warming is far from over.
On Monday, the NY Times broke with years of blatant warmist bias in reporting that Climate Fears Turn to Doubts Among Britons. The article cited a February BBC survey which “found that only 26 percent of Britons believed that ‘climate change is happening and is now established as largely manmade,’ down from 41 percent in November 2009.” The Times attributed the public opinion swing in Great Britain and similar shifts in Germany and the US to what it referred to as “a series of climate science controversies unearthed and highlighted by skeptics since November.” In other words, the climate fraud uncovered at the University of East Anglia (aka Climategate) and the multitude of errors uncovered in the latest IPCC (AR4) report.
Of course, the Times abhor the new public awareness as it “will make it harder to pass legislation like a fuel tax increase and to persuade people to make sacrifices to reduce greenhouse gas emissions.” But shouldn’t facts drive policy? Not according to Greenpeace spokesman Ben Stewart, quoted by the Times complaining that “[l]egitimacy has shifted to the side of the climate skeptics, and that is a big, big problem.”
Really?
Now Newsweek has joined the newly aware, but with a dash more honesty. In a piece titled Uncertain Science, the normally climate alarm sounding magazine has also acknowledged the turning tide: Blame economic worries, another freezing winter, or the cascade of scandals emerging from the world’s leading climate-research body, the Intergovernmental Panel on Climate Change (IPCC). But concern over global warming has cooled down dramatically. In uber-green Germany, only 42 percent of citizens worry about global warming now, down from 62 percent in 2006. In Britain, just 26 percent believe climate change is man-made, down from 41 percent as recently as November 2009. And Americans rank global warming dead last in a list of 21 problems that concern them, according to a January Pew poll.
Now, such news from the MSM would normally be followed by a lengthy sermon about the effects of a well-funded “denial” machine and simple-minded fools confusing weather with climate. Or, as witnessed by the Times piece, how easily misled are the public by “denier” tricks. But Newsweek’s Stefan Theil instead broke with the usual alarmist ad-hominem and declared that “[t]his is no dispute between objective scientists and crazed flat-earthers.”
Writes Theil: The lines cut through the profession itself. Very few scientists dispute a link between man-made CO2 and global warming. Where it gets fuzzy is the extent and time frame of the effect. One crucial point of contention is climate “sensitivity” - the mathematical formula that translates changes in CO2 production to changes in temperature. In addition, scientists are not sure how to explain a slowdown in the rise of global temperatures that began about a decade ago.
While not entirely accurate (more than a few scientists reject the notion of CO2-influenced warming outright), by publishing those words Newsweek has gone where few (if any) left-leaning newsmagazines have gone before - admitting that there’s a problem with the “science is settled” mantra.
Needless to say, Theil’s take-away from a continuing climate debate isn’t likely to please the Cap-and-Tax-and-Control crowd: There are excellent reasons to limit emissions and switch to cleaner fuels - including an estimated 750,000 annual pollution deaths in China, the potential to create jobs at home instead of enriching nasty regimes sitting on oil wells, the need to provide cheap sources of power to the world’s poorest regions, and the still-probable threat that global warming is underway. At the moment, however, certainty about how fast - and how much - global warming changes the earth’s climate does not appear to be one of those reasons.
Okay, so he can’t help clinging to a “still-probable threat that global warming is underway,” which I suppose implies an anthropogenic cause, but at least he acknowledges that further unbiased investigation must precede any policy decisions.
Of greater note—the same powerhouse publication that in its August 2007 cover story—The Truth about Denial—described climate skepticism as “an undermining of the science” now challenges the same AGW orthodoxy it once preached. No wonder Ben Stewart is worried. Read more here.
May 28, 2010
El Nino 2009/10 Over - La Nina, Warm Summer and Global Cooling Coming
By Joseph D’Aleo CCM
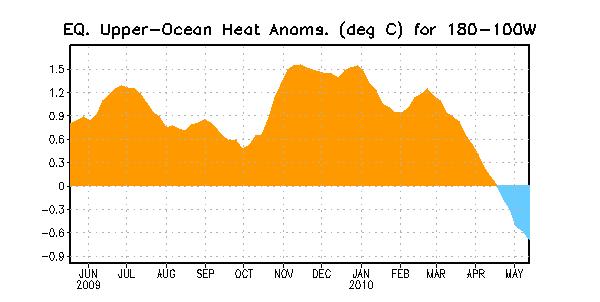
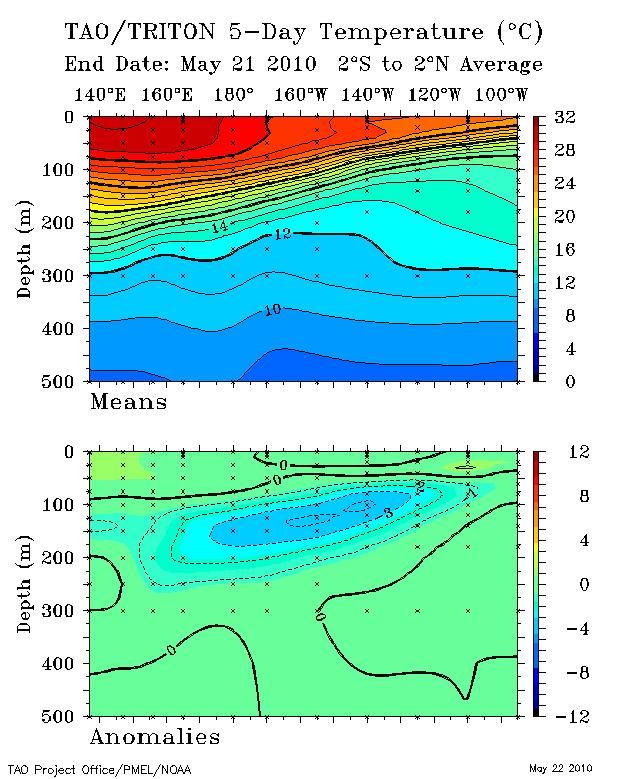
The El Nino of 2009/10 is over. Temperatures in region NINO34, the key region used for official El Nino assessment are now negative (-0.2C).
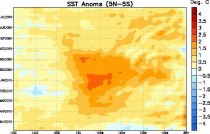
The warming peaked in the central tropical Pacific in December / January. Cooler water has surfaced in the east central Tropical Pacific (below, enlarged here).
LA NINA - SISTER OF THE EL NINO COMING ON

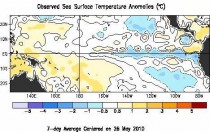
You can see the colder water emerging here in the recent weekly (above, enlarged here).
Also the warmer water is seen mixing out quickly as upwelling of cold water increased in this animation.
Ocean heat content in the tropical Pacific is shown to dive, similar to what happened in 1998 and 2007. (below, enlarged here).

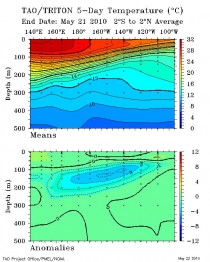
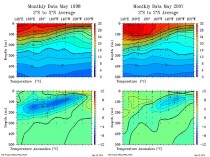
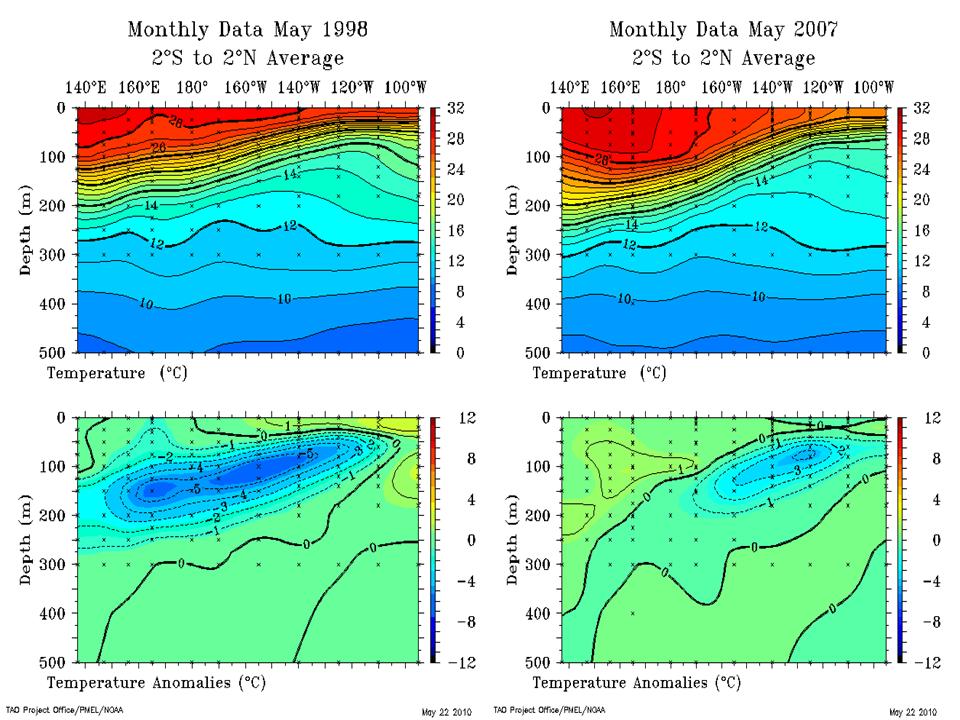
The cross section along the equatorial Pacific shows the warm water gone with a large plume of sub-surface water ready to be tapped by upwelling - the onset of La Nina (below, enlarged here). Note the similarity to May in 1998 and 2007 when El Ninos gave way to La Nina in the summer/fall (below, enlarged here).
.
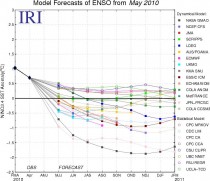
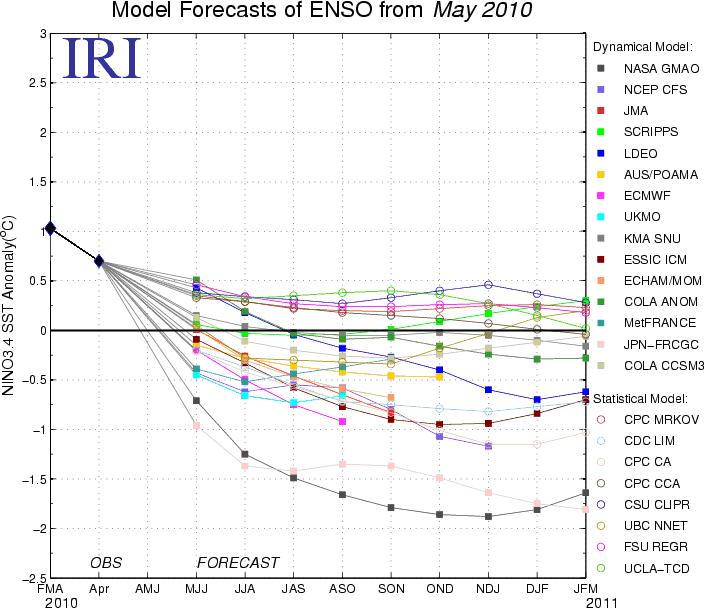
Most ENSO models indicate La Nina is likely. All dynamical models show negative anomalies. Some statistical models show La Nada (neutral) conditions (below, enlarged here).
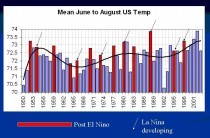
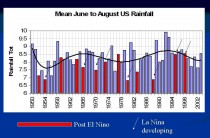
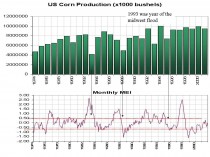
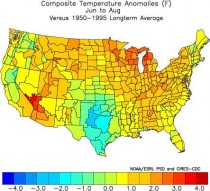
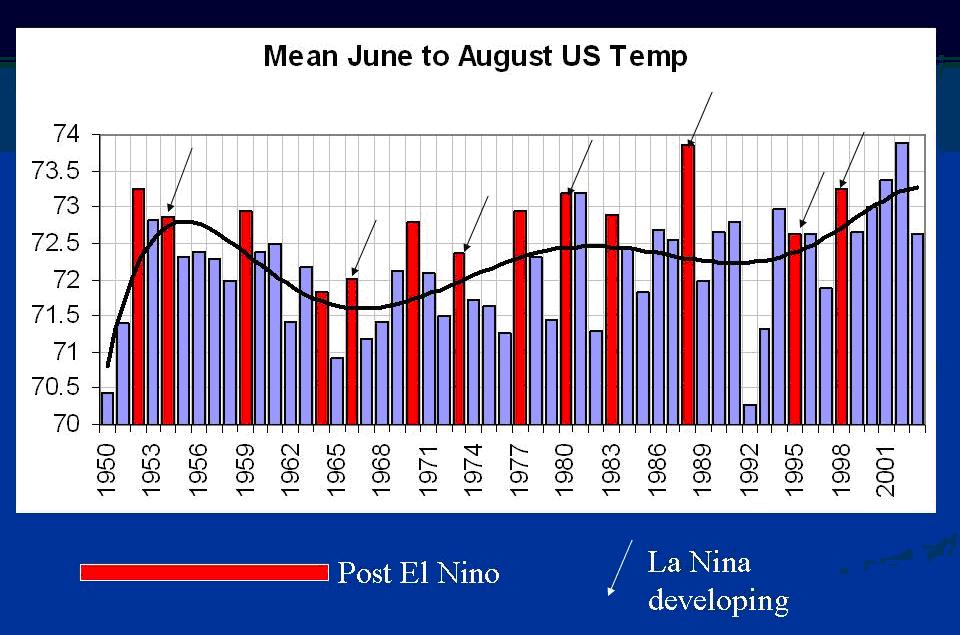
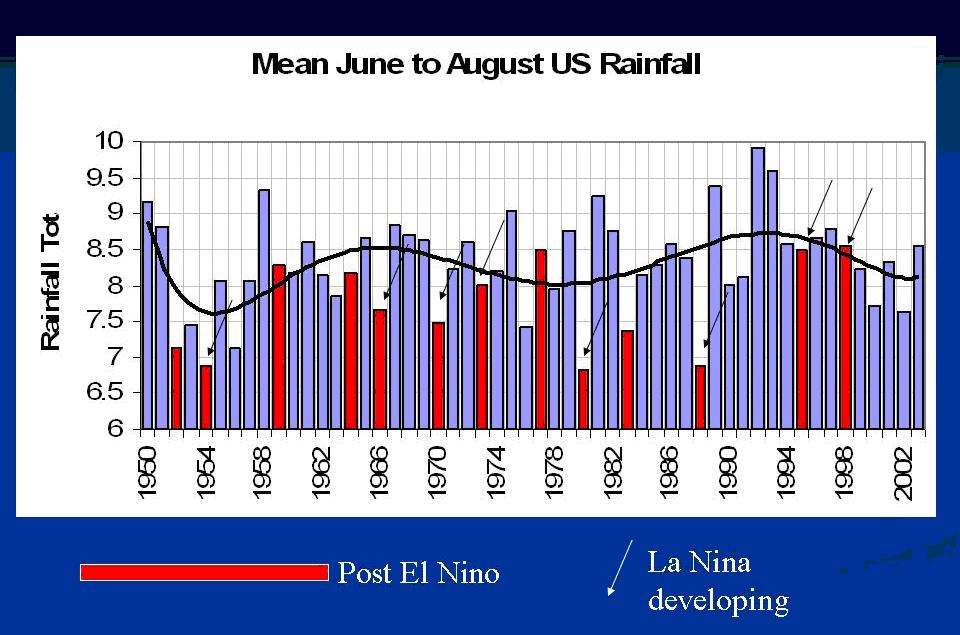
EL NINOS TRANSITIONING TO LA NINAS TEND TO LEAD TO WARM, DROUGHTY SUMMERS IN CORN BELT AND YET GLOBAL COOLING
These maps are for the Corn Belt. (below, enlarged here and here).
Rapidly falling ENSO indices have led to lowered corn production in 1983, 1988, 1995. 1998 did not see such a decline. Warm water lingered in the eastern TROPAC that year (below enlarged here).
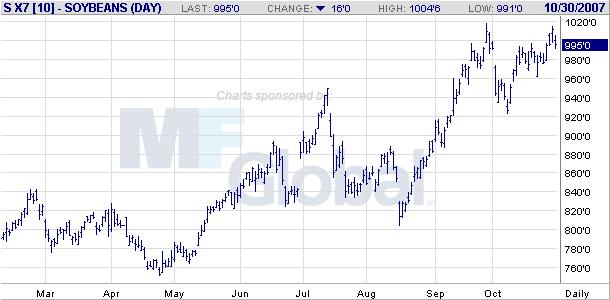
In 2007, slow movement west of the cold water led to late season issues, affecting mainly beans.
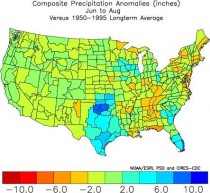
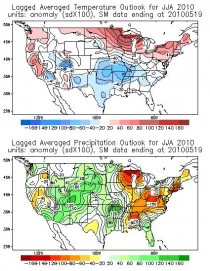
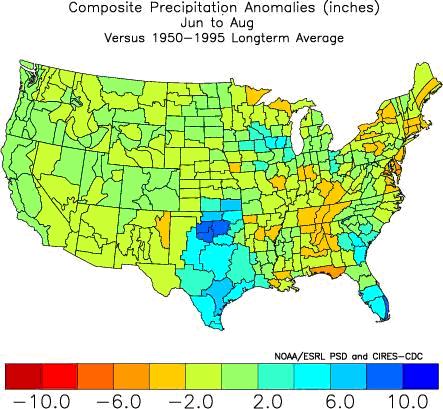
The best analogs suggest a warm summer though cooler than normal and wet conditions in the southern plains (below, enlarged here and here).
Soil moisture models have been coming around to this thinking (below enlarged here).
See how dry it has been in Michigan year to date in this excellent report from the NWS.
WILDCARDS - SOLAR SLUMBER AND VOLCANIC RUMBLINGS
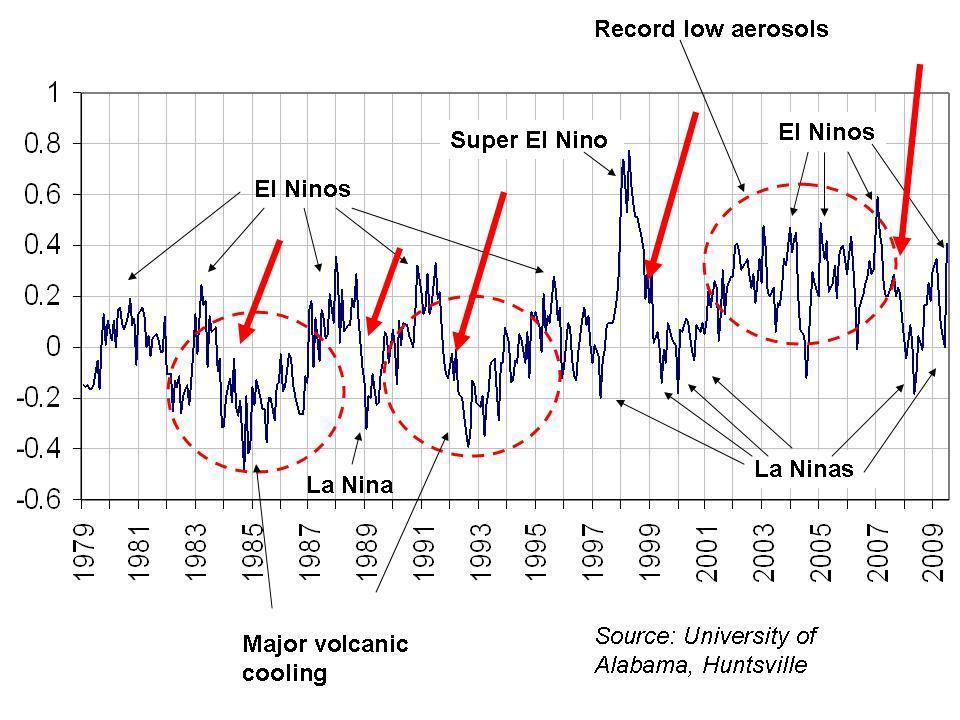
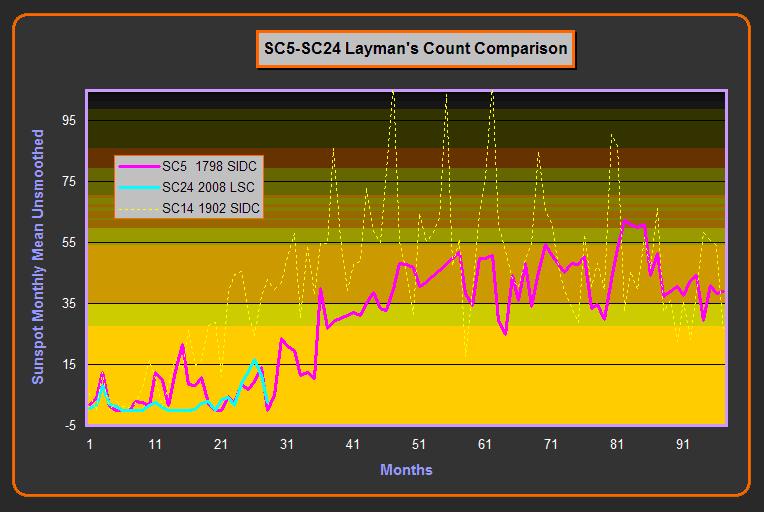
One of the wildcards is the sun, which returned to a quiet state in late April and early May with two extended strings of spotless days and a return of solar flux to solar minimum levels. We continue to track close to the cycle 5 in the Dalton Minimum 200+ years ago. Unprecedented solar levels and long period of quiet solar may enhance the global cooling effect as La Nina comes on. Note the rapid global temperature (MSU satellite lower atmospheric temperatures shown) declines in prior La Nina episodes post strong El Ninos (red arrows) (below, enlarged here). You can also see clearly the effects of volcanic aerosols and El Nino (warming) and La Nina (cooling).
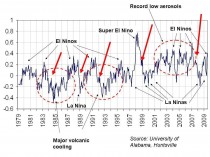
Note similarity of sunspot activity to cycle 5 at the start of the Dalton Minimum. Cycle 14 a century ago is also shown and has been regarded by some as another possible analog/ Note the more rapid recovery that cycle. That was also a cold period though not as cold as the Dalton (below, enlarged here).

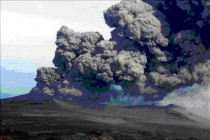
Also Eyjafjallajokull continues to erupt. Though most days the ash and aerosols remain below the stratosphere, occasional eruptions are more explosive. Much more dangerous Katla historically has been triggered by Eyjafjallajokull eruption periods which often last for long periods. A major eruption would change the weather picture globally quickly by affecting the AO and ash and aerosols could affect crops in Europe. Redoubt and Sarychev affected the hemisphere’s climate last two summers and last winter.
See full PDF with enlarged images here.
----------------
Snow day in May
ctvcalgary.ca
It’s another snow day in Calgary and we’re all wondering when winter will loosen its grip. The city hasn’t seen this much snow on May 29th since 1942. Central Alberta saw about 10 centimetres of the white stuff overnight which made for some slippery driving.
While some are fed up with the white stuff, others are trying to take it all in stride. Even though enough heavy wet snow fell overnight to bend trees into awkward angles, children were able to toss snowballs.
But not everyone thinks this is fun. “Yah, it’s typical, but kind of getting tired of it,” said Russ Martin. The snowy spring morning didn’t stop people like Tina Bay from hitting up a garage sale. “We just kind of started, something to do on the weekend,” said Bay. Iris Curd took advantage of the snowy situation by strategically placing items she had up for sale, like a Santa Claus statue and a couple of sleighs. “We have a theme, we have the Santa Claus and the sleighs and the coffee and Baileys in the back so we’re set,” commented Curd.
Springtime in Alberta typically means snow, but not this much or so late in the season. Even weather experts like meteorologist Steve Rothfels say this is unusual. “We’re pushing the limits here, we’re pushing the limits. The only thing that makes it seem a little less unusual is that we did have some snow last June. That was very unusual. But towards the end of May, we don’t usually see it this late in the year,” commented Rothfels.
For people itching to dig into a flowerbed, like Laurie-Lynn Brookwell, this weather is hard to take. “You think you’re going to get used to it after living in Calgary for 22 years, but it’s hard to be a gardener here,” said Brookwell.
Warmer weather is in the forecast for mid-week. Calgarians can only hope that’s when spring will arrive, and stay, in southern Alberta.
-----------------
Smoke from Quebec forest fires make for smoky Memorial day in Northeast
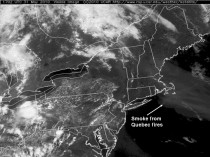
Enlarged here.
May 26, 2010
Climategate and the Scientific Elite
By Iain Murray
Climategate starkly revealed to the public how many global-warming scientists speak and act like politicians.
The news that Dr. Andrew Wakefield, who popularized the idea of a link between the MMR (measles, mumps, and rubella) vaccine and autism, has been struck off the register of general practitioners in the United Kingdom testifies to the fact that, in many scientific fields, objectivity still reigns. Britain’s General Medical Council found that Wakefield had used unethical and dishonest research methods and that when his conclusions became common knowledge, the result was that far more children were exposed to the risk of those diseases than would have been the case otherwise. Unfortunately, in other areas, some scientists have been getting away with blatant disregard for the scientific method.
The most prominent example, “Climategate,” highlights how dangerous the politicization of science can be. The public reaction to Climategate should motivate politicians to curb such abuses in the future. Yet it was politicians who facilitated this politicization of science in the first place.
The economic historians Terence Kealey (The Economic Laws of Scientific Research) and Joel Mokyr (The Gifts of Athena) help us understand just how science progresses. Their central insight involves the recursive nature of the scientific process. In Mokyr’s terms, propositional knowledge (what politicians term “basic” science) can inform prescriptive knowledge ("applied" science). However, the reverse happens just as often.
This understanding contradicts the linear model of scientific research, which became prevalent in America in the 1940s and ‘50s, following the model of the great scientist Vannevar Bush. Under this model, we must invest in propositional knowledge as a public good, because that’s where our prescriptive knowledge comes from. Yet even as Bush’ model was taking hold, President Eisenhower warned against it. In his farewell address, just after the famous remarks about the military-industrial complex, he said:
Today, the solitary inventor, tinkering in his shop, has been overshadowed by task forces of scientists in laboratories and testing fields. In the same fashion, the free university, historically the fountainhead of free ideas and scientific discovery, has experienced a revolution in the conduct of research. Partly because of the huge costs involved, a government contract becomes virtually a substitute for intellectual curiosity. For every old blackboard there are now hundreds of new electronic computers. The prospect of domination of the nation’s scholars by federal employment, project allocations, and the power of money is ever present - and is gravely to be regarded.
Yet, in holding scientific research and discovery in respect, as we should, we must also be alert to the equal and opposite danger that public policy could itself become the captive of a scientific-technological elite.
What Ike warned about has now come to pass. The scientific elite, with the help of its allies in Congress, increasingly dictates public policy and thereby secures the continued flow of research funding. Time and again, scientists have told me how they have to tie their work to global warming in order to obtain funding, and time and again - bar a few brave souls, who are immediately tagged as “deniers” - they tell me it would be career suicide to speak out openly about this.
Moreover, by consciously reinforcing the link between politics and science, the scientific elite is diminishing the role of private innovation, where prescriptive knowledge informed by market demand drives propositional knowledge. Thus, they are driving the market out of the marketplace of ideas.
For that reason, we must challenge the linear model of science. One way to do this is to break the link between political patronage and scientific funding. For example, we could fund basic science by awarding prizes for excellent research results instead of grants before the event. With their patronage powers curtailed, politicians might become less interested in scientific funding, allowing private money to fill the void.
That’s the good news about Climategate. It starkly revealed to the public how many global-warming scientists speak and act like politicians. To those scientists, the message trumped the science. Few members of the public have accepted the findings of the inquiries exonerating the scientists; most dismiss them as whitewashes. This is to the good, for it reinforces awareness of the scientific elite President Eisenhower warned about.
If politicians realize that the public regards them as corrupting science rather than encouraging it, they might become less inclined to continue funding the scientific-political complex. Then scientists would be free to deal with the Andrew Wakefields among them as needed, rather than worry about their funding.
Iain Murray is vice president for strategy at the Competitive Enterprise Institute.
May 24, 2010
A Legislative Trojan Horse
by Hans A. von Spakovsky and Robert Gordon
Small businesses and the American economy, beware: Once again Washington politicians are conspiring to help you out. Apparently, Sens. Robert Casey (D., Pa.) and Thomas Carper (D., Del.) are planning to “save” you from the onerous rules regulating greenhouse gases being hatched at the EPA.
The basis of the EPA’s regulatory efforts is the agency’s finding that carbon dioxide is a “pollutant” that supposedly “endangers” us by causing global warming. Once the EPA made this unprecedented and unsupported endangerment finding under the Clean Air Act, it put the enormous regulatory machinery of the federal government in gear to generate rules regulating CO2, rules that will damage every aspect of the U.S. economy. Thankfully, substantive legal challenges to the endangerment finding and the rules the EPA is generating have been filed.
One rule the agency has already issued, something known as the tailoring rule, seems, at first glance, different than its economy-stifling kin. The tailoring rule was supposedly designed to exempt smaller CO2 emitters from the new regulations until 2016. While the Clean Air Act itself states that pollutant emissions of 250 tons or more must be regulated, EPA’s tailoring regulation simply contradicts the law, stating that for now the agency will only regulate CO2 sources emitting 50,000 tons or more.
How, you may ask, can a federal agency just overturn a law by regulation? Good question. The reality is that the EPA is well aware that the tailoring regulation contradicts black-letter law; consequently, it knows legal challenges have high prospects for success. So why would an agency like the EPA that has no trouble flexing its regulatory muscles exempt tens of thousands of potential regulatory targets with such a rule? Quite simply, in addition to recognizing the regulation’s tenuous legal grounds, the EPA realizes that as the number of individuals aware of the pending regulatory burden grows, the stronger the backlash against its CO2 rules will be. Crafty bureaucrats also know that the biggest hurdle they now face is beginning the process of regulating CO2 - striking out against our national economy from the regulatory beachhead of the EPA’s very questionable endangerment finding.
The reality is that with or without the tailoring exemption, the Clean Air Act is already festooned with complex and expansive regulatory mechanisms. The EPA’s extension of its grip to CO2 will be another unparalleled regulatory bonanza for this government agency. Once done - like virtually every other federal regulatory effort - the scope of the agency’s CO2 powers will only continue to expand. While a small business, family farm, or ranch might escape the EPA’s direct regulatory burden and a particular permitting process with the tailoring rule (perhaps only temporarily), they will still suffer from this unlawful aggregation of power by a federal agency. At the end of the day, the enormous economic costs of job losses, reduced GDP, and dramatically higher energy prices from the impact of the EPA’s rules will punish all of us.
Enter Senators Carper and Casey. The word is that they will be introducing legislation to codify the EPA’s tailoring rule - that is, make it law. Their likely public spin will be that they “saved” small businesses - read voters 0 by cementing the 50,000-tons tailoring rule. But that’s not all they would cement. By legally carving out an exemption for smaller CO2 emission sources, such a law could be legally interpreted as Congress’s implicit stamp of approval of all of the EPA’s other CO2 regulatory efforts and specifically the endangerment finding itself, which means that we would all end up paying more. Sen. Lisa Murkowski (R., Ala.) has a different resolution (S.J. Res. 26), introduced on January 21, which would simply (but effectively) disapprove and void the EPA’s endangerment finding. The danger is that if her resolution, which may be considered early next week, fails to pass, some supporters of vitiating the EPA’s regulatory aggrandizement may be tempted to support legislating the EPA’s tailoring rule.
As of now, there are numerous legal challenges to the endangerment finding and CO2 regulations that have reasonable prospects of prevailing. Senators Casey and Carper’s effort could be seen as a self-interested effort to politically insulate themselves from economically destructive CO2 regulations, and Majority Leader Harry Reid has signaled that he intends to take up their effort. If successful, they may effectively kill legal challenges to the endangerment finding, handing radical greens inside and outside the administration something that otherwise would have likely eluded them, Majority Leader Reid, and even Speaker Pelosi - their biggest global “warming” regulatory win ever, to the detriment of the entire American economy, including small businesses.
------------------
Overturning EPA’s Endangerment Finding Is a Constitutional Imperative
by Marlo Lewis, Pajamas Media
This week, the U.S. Senate is expected to vote on a “resolution of disapproval,” sponsored by Republican Senator Lisa Murkowski of Alaska, to stop the U.S. Environmental Protection Agency from “enacting” controversial global warming policies through the regulatory back door.
The importance of this vote is difficult to exaggerate. Nothing less than the integrity of our constitutional system of separated powers and democratic accountability hangs in the balance.
Who Shall Make Climate Policy?
The Murkowski resolution would overturn the EPA’s “endangerment finding,” a December 2009 rulemaking in which the agency concluded that greenhouse gas emissions endanger public health and welfare. The endangerment finding is both trigger and precedent for sweeping policy changes that Congress never approved. America could end up with a regulatory regime more costly and intrusive than any climate bill or treaty the Senate has declined to pass or ratify, yet without people’s representatives ever voting on it.
Unless stopped, the EPA will be in a position to determine the stringency of fuel economy standards for the auto industry, set climate policy for the nation, and even amend the Clean Air Act - powers never delegated to the agency by Congress.
The Murkowski resolution puts a simple question squarely before the Senate: Who shall make climate policy - lawmakers who must answer to the people at the ballot box or politically unaccountable bureaucrats, trial lawyers, and activist judges appointed for life?
It might seem amazing that any senator would oppose such a measure. After all, senators take an oath to “support and defend” the Constitution, which vests “all legislative powers” in Congress (i.e., not in administrative agencies or courts). However, regulatory zealotry has a long history of trampling on constitutional principle, and many lawmakers would simply prefer to let the non-elected bureaucrats at the EPA take the heat for “enacting” costly climate policies.
Power Grab
Let’s examine in somewhat more detail the unauthorized powers the EPA will amass unless the endangerment finding is overturned.
For starters, the endangerment finding compels the EPA to establish greenhouse gas (GHG) emission standards for new motor vehicles. About 95% of vehicular GHGs are carbon dioxide (CO2) emissions from gasoline combustion. Because no commercial technologies exist to filter CO2 emissions from automobile tailpipes, automakers can significantly reduce the quantity of CO2 emitted per mile only by reducing the quantity of gasoline combusted per mile.
Thus, by setting GHG emission standards, the EPA can largely determine the stringency of new-car fuel economy standards. Congress should object, because the Clean Air Act gives EPA no authority to regulate fuel economy. Congress delegated that power to another agency (the Department of Transportation) under another statute (the Energy Policy and Conservation Act).
Once the EPA’s motor vehicle GHG standards take effect, CO2 by definition becomes a “regulated air pollutant.” That, in turn, makes any “major stationary source” of CO2 emissions subject to additional regulation under the Act’s Prevention of Significant Deterioration (PSD) pre-construction permitting program and Title V operating permits program. Firms will need to obtain PSD and Title V permits if they plan to build, modify, or operate “major” sources of CO2 emissions.
Similarly, the endangerment finding will empower the EPA to establish GHG “performance standards” for scores of industrial categories of emitters, such as power plants, refineries, and steel mills.
Thus, by issuing an endangerment finding, the EPA will deal itself into a position to control the economy - both mobile and stationary sources - for climate change purposes. Yet the Clean Air Act gives the EPA no such authority. Congress enacted the Clean Air Act in 1970, decades before global warming was even a topic of congressional debate. That is why phrases like “greenhouse gas,” “greenhouse effect,” and “global climate change” appear nowhere in the statute.
Absurd Results
Compelling evidence that Congress never intended to regulate greenhouse gases through the Clean Air Act unwittingly comes from the EPA itself. As the EPA explains in its so-called “tailoring rule,” unless the EPA “tailors” - that is, amends - the Clean Air Act permitting programs, the endangerment finding leads inexorably to “absurd results.”
Here’s why. A stationary source is “major” if it has a potential to emit 250 tons per year of a “regulated air pollutant” under the PSD pre-construction permitting program and 100 tons per year under the Title V operating permits program. These “applicability thresholds” make sense when applied to bona fide air pollutants, such as particulate matter and smog-forming chemicals, which are emitted in the threshold amounts only by large industrial facilities.
In contrast, an immense number and variety of previously unregulated entities - office buildings, big box stores, apartment complexes, small manufacturers, commercial restaurants, hospitals, churches, and schools - emit 100-250 tons per year of CO2. All become vulnerable to new regulation, penalties, and litigation under the PSD and Title V provisions once CO2 becomes a “regulated air pollutant.”
The EPA and its state counterparts will have to process an estimated 41,000 PSD permits annually (instead of 280) and 6.1 million Title V permits annually (instead of 14,700), the agency estimates. Such workloads vastly exceed agencies’ administrative resources. If EPA applies the Clean Air Act as written to CO2, permitting agencies will develop huge, ever-growing backlogs that will bog down environmental enforcement, block new construction, and thrust millions of firms into legal limbo. Needless to say, President Obama does not want this red ink nightmare unfolding on his watch.
Rather than argue on statutory grounds that it cannot issue an endangerment finding without producing absurd results destructive of congressional intent, the EPA plans to amend the Act. Specifically, the EPA intends for six years to exempt from PSD and Title V all sources emitting less than 50,000 tons per year of CO2-equivalent greenhouse gases, even though, as noted, the statutory applicability thresholds are 250 and 100 tons per year.
In summary, the EPA is poised to breach the separation of powers in three ways - first, by determining fuel economy standards (a power Congress delegated to another agency), next by setting climate policy for the nation (a matter about which Congress is still deliberating), and finally by effectively amending the statutory definition of “major source.”
Smear Campaign
Sen. Murkowski’s resolution of disapproval would safeguard both the economy and the democratic process by nipping all this mischief in the bud.
Precisely because the resolution would restore constitutional discipline to climate policymaking, opponents are mounting a smear campaign against it.
Climate Progress calls the Murkowski resolution the “Dirty Air Act,” contending it is “polluter crafted.” Nice try, but that’s impossible. The form of the resolution is fixed by Section 802 of the Congressional Review Act. The only choices allowed are which agency and which final rule to insert in the blank spaces. There is no room for “crafting,” whether by “polluters” or anyone else. If there were an award for hypocritical sanctimony, Climate Progress would be a top contender. They support both the Waxman-Markey and Kerry-Lieberman cap-and-trade bills, which are “polluter-crafted” from top to bottom.
MoveOn.org, in TV ads, warns that the Murkowski resolution will “roll back” the Clean Air Act, which supposedly is an outrage because “many Americans already smoke the equivalent of a pack a day just from breathing the air.” That is complete rubbish. The resolution will not affect any policy, program, or regulation the EPA administers to protect air quality. Moreover, one cigarette delivers 12-27 times the daily dose of particulate matter (PM2.5) that non-smokers get in cities with the highest PM2.5 levels. No Americans anywhere smoke a pack a day or even one cigarette a day just from breathing the air.
Environmental Defense Action Fund claims, in radio ads, the Murkowski resolution is a “polluter bailout bill.” For shame! EDAF cynically exploits taxpayers’ anger at wealth transfers to fat-cat corporations to advance a big-government agenda that many of those same taxpayers oppose.
Sen. Barbara Boxer (D-Calif.) claims that overturning the endangerment finding is equivalent to overturning the Surgeon General’s report linking cigarette smoking to cancer. We’re supposed to be scandalized that Congress would try to repeal science and keep us in the dark about threats to our health and welfare. This too is nonsense, for two reasons.
First, the Surgeon General’s report was purely an assessment of the medical literature. It had no legal force or effect. It did not even offer policy recommendations. If the endangerment finding were simply one agency’s review of the science, Congress would have no business voting on it either. But, to repeat, unlike the Surgeon General’s report, the endangerment finding is both trigger and precedent for costly and complex policy changes Congress never approved.
Second, although some may oppose the endangerment finding on scientific grounds, the Murkowski resolution neither takes nor implies a position on climate science. The resolution would overturn the “legal force and effect” of the endangerment finding, not its reasoning or conclusions. The resolution is a referendum not on climate science but on the constitutional propriety of EPA making climate policy without new and specific statutory guidance from Congress.
Although you’d never guess from the attacks to which she has been subjected, Sen. Murkowski is not a climate skeptic, nor does she oppose greenhouse gas regulation in principle. Her position is simply that climate policy is too important to be made by non-elected bureaucrats. That ought to be a proposition on which all Senators can agree.
Marlo Lewis is a senior fellow in environmental policy at the Competitive Enterprise Institute
May 21, 2010
Only morons, cheats and liars still believe in Man-Made Global Warming
By James Delingpole
Well of course I would write a headline like that having just spent the last three days in Chicago at the Heartland Institute’s 4th International Conference on Climate Change. This is the event the cackling, cloak-wearing, befanged AGW-denying community attends every year to glorify in their own evil. And naturally, in the wake of Climategate, a mood of uproarious triumphalism has prevailed as distinguished skeptical scientists, economists, and policymakers from around the world - Pat Michaels, Richard Lindzen, Ian Plimer, Bob Carter, Fred Singer.. you name them, they’re here - have gathered to dance on the smouldering ashes of the mythical beast ManBearPig.
Except we shouldn’t use that word “sceptic” any more. Richard Lindzen - Godfather of Climate Realism = told us so in one of the keynote addresses.
“Scepticism implies doubts about a plausible proposition,” he said. “Current global warming alarmism hardly represents a plausible proposition.” Not least, he pointed out, because the various activist scientists, greenies and government institutions pushing AGW theory have failed to “improve their case over 20 years.” So paper thin are the AGW movement’s arguments that pretty much the only defences left to them are desperate techniques like the appeal to authority ("the Royal Society believes in AGW and the Royal Society is, like, really old and distinguished, so AGW must be true") and cheap slurs.
Consider, as examples of the latter technique, how this conference has been reported in the liberal media. Both the BBC and the Huffington Post have decided to write off the expertise of the dozens of PhDs and professors speaking at this event to concentrate on the issue that really matters: it was funded by Big Oil. (Except it isn’t. Unfortunately Big Oil stopped funding the skeptical side of the argument a long time ago. The Heartland Institute is a conservative leaning think tank funded by a number of business donors, and the main funder of the conference is a local libertarian millionaire who just happens to want a bit of openness and honesty in the debate on AGW. But hey, never let the facts get in the way of a libtard story).
The other main objection I heard - from the BBC’s Roger Harrabin - is how utterly ridiculous it was that a total know-nothing like James Delingpole was speaking on a “Science” panel with meteorologist Joe D’Aleo, climate expert Fred Singer, and economist Ross McKitrick (co-destroyer - with Steve McIntyre - of Michael Mann’s hockey stick). Indeed, when I introduced myself to him, he snapped back “I’m not sure whether I should shake your hand. I want to punch you.” He sounded jolly cross indeed and ranted that I was utterly irresponsible and had disseminated lots of lies - though he later apologized to me saying he was jet-lagged and had confused me with Christopher Booker. Hmm.
Anyway, I agree with him. As I said when I gave my speech, it was entirely inappropriate that a humble hack like me should be on a panel with such great men - like a lowly swineherd suddenly finding himself translated to Mount Olympus. Then again, I said, it wasn’t such a bad idea that I was there to inject a note of reality to the proceedings. The truth is, I said, that the scientific debate is over. The scientists on our side of the argument have won (which is why no Warmist will dare debate Richard Lindzen, and while Al Gore won’t debate anyone at all: they know they’d lose). Problem is, I went on, this debate was never really about science anyway. AGW is and always have been a political process. It’s the political war that were fighting now and it’s going to be much much harder to win.
Especially when you look at the results of our recent General Election which I still find so monumentally depressing I’m not altogether sure I can bring myself to fly home. See post here.
A thoroughly delightful gentleman. A bright light among the many curmudgeons and closed minded scientifically illiterate elitists in the mainstream media here and in most places abroad who simply regurgitate all the lies the corrupt IPCC, NOAA, NAS, NASA, EPA, CRU, UKMO, local government weather services and the NGO environmental advocacy groups pump out like BP oil from the Gulf spill.
|

