May 20, 2010
Triple Crown of global cooling could pose serious threat to humanity
Seminole County Environmental News Examiner Kirk Myers
"Global warming” may become one of those quaint cocktail party conversations of the past if three key climate drivers - cooling North Pacific sea surface temperatures, extremely low solar activity and increased volcanic eruptions - converge to form a “perfect storm” of plummeting temperatures that send our planet into a long-term cool-down lasting 20 or 30 years or longer.
“There are some wild cards that are different from what we saw when we came out of the last warm PDO [Pacific Decadal Oscillation] and entered its cool phase [1947 to 1976]. Now we have a very weak solar cycle and the possibility of increased volcanic activity. Together, they would create what I call the ‘Triple Crown of Cooling,’” says Accuweather meteorologist Joe Bastardi.
If all three climate-change ingredients come together, it would be a recipe for dangerously cold temperatures that would shorten the agricultural growing season in northern latitudes, crippling grain production in the wheat belts of the United States and Canada and triggering widespread food shortages and famine.
Cool Pacific Decadal Oscillation
The Pacific Decadal Oscillation refers to cyclical variations in sea surface temperatures that occur in the North Pacific Ocean. (The PDO is often described as a long-lived El Nino-like pattern.) PDO events usually persist for 20 to 30 years, alternating between warm and cool phases. During these long periods there are sometimes short-interval phase switches that can last several years.
From 1977 to 1998, during the height of “global warming,” North America was in the midst of a warm PDO. Since then, we have experienced several short-duration PDO fluctuations between cool and warm.
But the PDO has once again resumed its negative cool phase, and, as such, represents the first climate driver in the Triple Crown of Cooling. With the switch to a cool PDO, we’ve seen a change in the El Nino/Southern Oscillation (ENSO), which alternates between El Nino (warm phase) and La Nina (cool phase) every few years. The recent strong El Nino that began in July 2009 is now transitioning to a La Nina, a sign of cooler temperatures ahead.
“We’re definitely headed towards La Nina conditions before summer is over, and we’re looking at a moderate to strong La Nina by fall and winter, which, as these La Ninas tend to persist in the cold PDO for two years, should bring us cooler temperatures over the next few years,” predicts Joe D’Aleo, founder of the International Climate and Environmental Change Assessment Project (ICECAP) and the first director of meteorology at the Weather Channel.
He is not alone in his forecast. Bastardi also sees a La Nina just around the corner.
“I’’ve been saying since February that we’ll transition to La Nina by the middle of the hurricane season. I think we’re already seeing the atmosphere going into a La Nina state in advance of water temperatures. This will have interesting implications down the road. La Nina will dramatically cool off everything later this year and into next year, and it is a signal for strong hurricane activity,” Bastardi predicts.
The difference in sea surface temperature between positive and negative PDO phases is not more than 1 to 2 degrees Celsius, but the affected area is huge. So the temperature changes can have a big impact on the climate in North America.
In fact, as Dr. Roy Spencer points out, the warm-phase PDO lasting from 1977 to 1998 might explain most of the warming we experienced in the late 20th century.
“This is because a change in weather circulation patterns can cause a small change in global-average cloudiness. And since clouds represent the single largest internal control on global temperatures (through their ability to reflect sunlight), a change in cloudiness associated with the PDO might explain most of the climate change we’ve seen in the last 100 years or more,” he writes.
Declining solar activity
Another real concern - and the second climate driver in the Triple Crown of Cooling - is the continued stretch of weak solar activity Earth is experiencing. We recently exited the longest solar minimum - 12.7 years compared to the 11-year average - in 100 years. It was a historically inactive period in terms of sunspot numbers. During the minimum, which began in 2004, we have experienced 800 spotless days. A normal cycle averages 485 spotless days.
In 2008, we experienced 265 days without a sunspot, the fourth-highest number of spotless days since continuous daily observations began in 1849. In 2009, the trend continued, with 261 spotless days, ranking it among the top five blank-sun years. Only 1878, 1901 and 1913 (the record-holder with 311 days) recorded more spotless days.
In 2010, the sun continues to remain in a funk. There were 27 spotless days (according to Layman’s sunspot count) in April and, as of May 19, 12 days without a spot. Both months exhibited periods of inexplicably low solar activity during a time when the sun should be flexing its “solar muscle” and ramping up towards the next solar maximum.
Why are sunspot numbers important? Very simple: there is a strong correlation between sunspot activity and global temperature. During the Dalton Minimum (1790 - 1830) and Maunder Minimum (1645 -1715), two periods with very low sunspot activity, temperatures in the Northern Hemisphere plummeted.
During the Dalton Minimum, the abnormally cold weather destroyed crops in northern Europe, the northeastern United States and eastern Canada. Historian John D. Post called it “the last great subsistence crisis in the Western world.” The record cold intensified after the eruption of Mount Tambora in 1815, the largest volcanic eruption in more than 1,600 years (see details below).
During the 70-year Maunder Minimum, astronomers at the time counted only a few dozen sunspots per year, thousands fewer than usual. As sunspots vanished, temperatures fell. The River Thames in London froze, sea ice was reported along the coasts of southeast England, and ice floes blocked many harbors. Agricultural production nose-dived as growing seasons became shorter, leading to lower crop yields, food shortages and famine.
If the low levels of solar activity during the past three years continue through the current solar cycle (Solar Cycle 24), which is expected to peak in 2013, we could be facing a severe temperature decline within the next five to eight years as Earth’s climate begins to respond to the drop-off in solar activity.
“The sun is behaving very quietly - like it did in the late 1700s during the transition from Solar Cycle 4 to Solar Cycle 5 - which was the start of the Dalton Minimum,” D’Aleo says. If the official sunspot number reaches only 40 or 50 - a low number indicating very weak solar energy levels - during the next solar maximum, we could be facing much lower global temperatures down the road.”
Even NASA solar physicist David Hathaway has said this is “the quietest sun we’ve seen in almost a century.” “Since the Space Age began in the 1950s, solar activity has been generally high,” Hathaway told NASA Science News. “Five of the ten most intense solar cycles on record have occurred in the last 50 years. We’re just not used to this kind of deep calm.”
Volcanic eruptions
Although the eruption of Iceland’s Mount Eyjafjallajokull volcano continues to raise havoc with air travel, it remains a relatively minor event by volcanic standards. Much of its ash cloud has stayed out of the stratosphere, where it would reflect sunlight, bringing cooler temperatures to the northern hemisphere.
Unfortunately, there is a very real chance Eyjafjallajokull’s much larger neighbor, the Katla volcano, could blow its top, creating the third-climate driver in the Triple Crown of Cooling. If Katla does erupt, it would send global temperatures into a nosedive, with a big assist from the cool PDO and a slumbering sun.
The Katla caldera measures 42 square miles and has a magma chamber with a volume of around 2.4 cubic miles, enough to produce a Volcanic Explosivity Index (VEI) level-six eruption - an event ten times larger than Mount St. Helens.
Katla erupts about every 70 years or so, most recently in 1918, often in tandem with neighboring Eyjafjallajokull, which is not a good sign. According to Bastardi, “The Katla volcano in Iceland is a game changer. If it erupts and sends plumes of ash and SO2 into the stratosphere, any cooling caused by the oceanic cycles would be strengthened and amplified.”
Iceland’s President Olafur Grimsson says the eruption of Eyjafjallajoekull volcano is only a “small rehearsal.” “The time for Katla to erupt is coming close . . . I don’t say if, but I say when Katla will erupt,” Grimsson predicts. And when Katla finally erupts it will “create for a long period, extraordinary damage to modern advanced society.”
Not a very encouraging outlook. Yet major eruptions throughout history bear witness to the deadly impact of volcanoes. The Tambora eruption in 1815, the largest in 1,600 years, sent the earth’s climate into a deep freeze, triggering “the year without a summer.” Columnist Art Horn, writing in the Energy Tribune, describes the impact: “During early June of 1815, a foot of snow fell on Quebec City. In July and August, lake and river ice were observed as far south as Pennsylvania. Frost killed crops across New England with resulting famine. During the brutal winter of 1816/17, the temperature fell to -32 in New York City.”
And Katla, with its large magma chamber, would register high on the Volcanic Explosivity Index, if it were to erupt. When it unleashed its fury in the 1700s, the volcano sent temperatures into a tailspin in North America. As Gary Hufford, a scientist with the Alaska Region of the National Weather Service, observes: “The Mississippi River froze just north of New Orleans and the East Coast, especially New England, had an extremely cold winter.
“Katla could cause some serious weather changes. It depends on the duration of the eruption, and how high the ash gets blasted into the stratosphere.”
Global cooling: a life-threatening event
With the PDO now in its cool phase, solar activity the weakest in more than 100 years, and the prospect of a major climate-cooling volcanic eruption, actions to limit CO2 emissions should be shelved and preparations made for an extended period of global cooling that would pose far more danger to humankind than any real or imagined warming predicted by today’s climate models.
Says D’Aleo: “Cold is far more threatening than the little extra warmth we experienced from 1977 to 1998 during the recent warm PDO. According to NASA, crop yields increased 30 percent, and there was a 10 percent increase in arable land during that period, which helped us feed many millions more of the earth’s population. A cooling down to Dalton Minimum temperatures or worse would lead to shortened growing seasons and large-scale crop failures. Food shortages would make worse the fact that more people die from cold than heat.”
See also paper by Don Easterbrook on this issue here. See Don’s response back to criticism on Tim Lambert’ Deltoid blog here.
May 19, 2010
Malaria in retreat despite warmer climate
By Michael Marshall, New Scientist
IN A rare instance of humans beating one of the impacts of climate change, measures to combat malaria appear to be neutralising the expected global increase of the disease driven by rising temperatures.
Peter Gething of the University of Oxford compared a map of the range of malaria in 2007 with one from 1900, when the world was 0.7 C cooler. He found the proportion of Earth’s landmass where malaria is endemic has fallen from 58 per cent to 30 per cent (Nature, vol 465, p 342). Malaria’s rate of transmission has also fallen almost everywhere.
This indicates that the incidence of malaria may not rise as a result of climate change. “The things acting to reduce malaria spread, like improved healthcare and disease control, are much more powerful than the weak effect of warming,” Gething says.
That doesn’t mean health authorities can rest on their laurels. Kevin Lafferty, an ecologist at the US Geological Survey, says the positive global picture hides shifting regional ones. Malaria is expected to move to different areas, even as its overall range decreases, he says.
May 19, 2010
Scientist Disputes EPA Finding that Carbon Dioxide Poses Threat to Humans
By Gene J. Koprowski
EPA scientists say manmade carbon dioxide and other greenhouse gases are contributing to a warming of the global climate—and as such represent a threat to human welfare. But a leading climatologist says his research indicates that CO2 poses no threat to human welfare at all, and he says the EPA should revisit its findings.
CHICAGO—Carbon dioxide is hazardous to your health, the Environmental Protection Agency says. Oh really?
EPA scientists say manmade carbon dioxide and other greenhouse gases are contributing to a warming of the global climate—and as such represent a threat to human welfare. Officials went so far as to declare the gas a danger to mankind in early December. But a leading climatologist says his research indicates that CO2 poses no threat to human welfare at all, and he says the EPA should revisit its findings.
“There is an overestimation of the environment’s sensitivity to CO2,” said Dr. Patrick Michaels, senior fellow in environmental studies at the CATO Institute and a past president of the American Association of State Climatologists.
Michaels spoke before a group of about 700 scientists and government officials at the fourth International Conference on Climate Change. The conference is presented annually in Chicago by the Heartland Institute, a conservative nonprofit think tank that actively questions the theory of man’s role in global warming. Last year the Institute published Climate Change Reconsidered, a comprehensive reply to the United Nations’ latest report on climate change.
Michaels described how the U.N. gathers weather information for its computer models, on which the EPA based its ruling. He said data gathering at weather stations in some parts of the world is spotty, and U.N. scientists add new figures to compensate. But in doing so, he said, they also add errors to the final research product.
“There is a systemic bias in the computer models,” said Michaels, whose research suggests that the U.N.’s adjusted computer modeling data, rather than actual observed data, is what connects the rise in temperatures to manmade causes. When one takes away the computerized modeling enhancements, he said, mankind’s contribution to global warming is virtually nil, approximately .03 degrees, rather than .07 degrees, over the last 50 years.
Thus, he said, most of the planet’s warming is not from manmade sources. “This idea that most of the warming is due to greenhouse gases caused by man just isn’t right,” he said.
But Catherine C. Milbourn, a spokeswoman for the EPA in Washington, disagreed with Michaels’ conclusions. “The U.S. Supreme Court ruled three years ago that greenhouse gas emissions constitute air pollution, and EPA set out to determine whether that pollution threatens the health and welfare of Americans,” she told FoxNews.com, explaining that the EPA ruling was based on a comprehensive review of available science from an array of peer-reviewed sources across the globe.
“The conclusion: The scientific evidence of climate change is overwhelming, and greenhouse gases pose a real threat to the American people. The question of the science is settled,” Milbourn said.
Greg Wiles, an associate professor of geology at The College of Wooster in Ohio, agreed with Milbourn. “Despite the recent attacks on the scientific community and large-scale buy-in by some of the public, the science behind the conclusion that contemporary warming is largely anthropogenic (manmade) still stands,” he told FoxNews.com.
But others disagree. Former Virginia Gov. George Allen, chairman of the American Energy Freedom Center think tank, said that the U.S. is “at a crossroads in energy policy,” but that the country “cannot stand with pompous elites.” He noted that a bill has been introduced in the U.S. Senate to essentially veto the EPA’s “endangerment finding”—and he said that others, like the legislature of the state of Kansas, have also gone on record against implementing an energy policy based on EPA’s findings. Read story here.
May 15, 2010
Questions posed for Kerry, Lieberman on new climate-energy bill
By Paul Driessen and Dr. Willie Soon
The new Kerry-Lieberman climate bill mandates a 17% reduction in US carbon dioxide emissions by 2020. It first targets power plants that provide reliable, affordable electricity for American homes, schools, hospitals, offices and factories. Six years later, it further hobbles the manufacturing sector itself.
Like the House-passed climate bill, Kerry-Lieberman also requires an 83% reduction in CO2 emissions by 2050. Once population growth and transportation, communication and electrification technologies are taken into account, this translates into requiring US emission levels last seen around 1870!
House Speaker Pelosi says “every aspect of our lives must be subjected to an inventory,” to ensure that America achieves these emission mandates. This means replacing what is left of our free-market economy with an intrusive Green Nanny State, compelling us to switch to unreliable wind and solar power, and imposing skyrocketing energy costs on every company and citizen.
Meanwhile, the Environmental Protection Agency is implementing its own draconian energy restrictions, in case Congress does not enact punitive legislation.
It’s time to ask these politicians some fundamental questions.
1) Even slashing carbon dioxide emissions to 83% below 2005 levels would reduce projected global average temperatures in 2050 by barely 0.2 degrees F, according to a study that used the UN’s own climate models. That’s because China, India and other developing countries are building new coal-fired power plants every week, even as the United States and Europe shackle their economies and send more jobs overseas. How do you justify such destructive, punitive, meaningless legislation?
2) Reflecting agreement with thousands of scientists, most Americans now say climate change is natural, not manmade. Fully 75% are unwilling to spend more than $100 per year in higher energy bills to “stabilize” Earth’s unpredictable climate. What provision of the Constitution, your oath of office or your duty to the overall health and welfare of this nation permits you to ignore the will of the people, the mounting evidence that “climate disasters” are the product of manipulated data and falsified UN reports, and the job-killing impacts of the laws and regulations you seek to impose?
3) If carbon dioxide is causing “runaway global warming,” why have average global temperatures not risen since 1995, and why have they been COOLING for the past five years - even as atmospheric carbon dioxide levels have continued to rise to levels unprecedented in the modern era?
4) What properties does manmade carbon dioxide have that enable it to replace the complex natural forces that clearly caused the Ice Ages, Medieval Warm Period, Little Ice Age, Dust Bowl, ice-free Arctic seas in 1822 and 1922, Alaska’s 100 degree F temperature record in 1915, and all the other climate and weather changes and anomalies, blessings and disasters that our planet has experienced during its long geologic and recorded history?
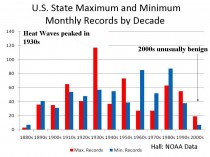
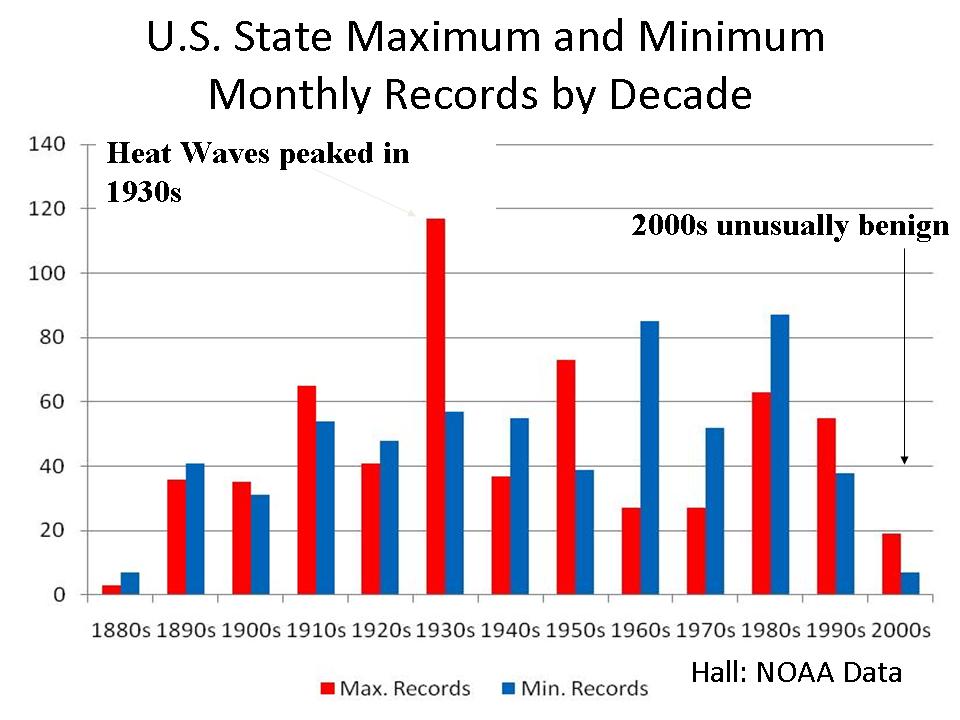
State record highs (enlarged here) show the 1930s still dominates.
5) What physical or chemical properties does manmade carbon dioxide have that would enable it to overturn the laws of thermodynamics - and cause temperatures in Antarctica to rise 85 degrees F (from an average of minus 50 F to plus 35 F year-round, or 48 degrees C, from -46 C to +2 C), to melt that continent’s vast ice masses, raise sea levels 20 feet or more, and flood coastal cities?
6) Precisely what chemical, physical and thermodynamic processes would drastic carbon dioxide reductions alter, and how? Precisely what weather and climate improvements would those reductions achieve? Precisely how will CO2 reductions stabilize planetary temperature, climate and weather systems that have been turbulent, unpredictable and anything but stable throughout Earth’s history?
7) Is there ANY direct physical observation or evidence that would falsify your climate crisis thesis, and cause you to say human greenhouse gas emissions are not causing a planetary climate disaster? Or do you think everything that happens confirms your climate disaster hypothesis: warmer or colder, wetter or drier, more snow and ice or less, more hurricanes and tornadoes or cyclical periods with few such storms?
8) Replacing hydrocarbons with unreliable, subsidized “green” energy will require millions of acres of land for wind turbines, solar panels and transmission lines - plus hundreds of millions of tons of steel, copper, concrete, fiberglass and rare earth minerals for all those facilities.
Do you support delaying wind, solar and transmission projects for years, to protect the rights and property of local communities and private landowners? Or do you favor regulatory edicts and eminent domain actions, so that government can seize people’s property and expedite construction of these projects?
Do you support opening US public lands for renewed exploration and development, so that we can produce these raw materials and create American jobs? Or do you intend to keep US lands off limits, and force us to depend on imports for renewable energy, too?
Do you support relaxing environmental study, endangered species and other laws, to fast-track approval of these projects, despite their obvious impacts on wildlife and habitats? Or do you want them subjected to the same rules that have stymied thousands of other energy projects, so that renewable energy projects cannot be built, either - and we have massive blackouts?

9) Over 1.5 billion people in Africa, Asia and Latin America still do not have electricity, for even a light bulb or tiny refrigerator. Millions die every year from diseases that would be largely eradicated with electricity for refrigeration, sanitation, modern hospitals, and industries that generate greater health and prosperity. How can you justify using taxpayer money to finance UN and environmental activist programs that claim global warming is the biggest threat they face, and they need to get by on wind and solar power, and give up their dreams of better lives, because YOU are worried about global warming? Doesn’t that violate their most basic human rights to improved living standards, and even life itself?
10) If you’re so sure about your data and conclusions - and intend to use climate disaster claims to justify sending our energy costs skyrocketing, killing millions of factory jobs, controlling our lives, and totally overhauling our energy, economic and social structure - why do you refuse to allow fair, open and balanced congressional hearings and debates on climate science and economics? Why do you refuse to debate skeptical experts in a public forum, or even answer questions that challenge your alarmist thinking? Why do you refuse to require that scientists who get taxpayer money for their research must share and discuss climate data, computer codes, methodologies and analyses?
11) How much money and campaign help have you gotten from companies and activist groups that benefit from renewable energy mandates and subsidies, carbon offset and trading schemes, coal mining and oil leasing bans, and other provisions of climate and energy legislation?
12) What if you vote for these job-killing, anti-growth, anti-poor, anti-human-rights “climate disaster prevention” laws - and it turns our you are WRONG on the science or economics? What will you do? Give up your congressional seat, home, pension and worldly wealth - and pledge yourself and your children to an austere life of service to the people you have harmed? Or just say, “Oh I’m so sorry,” and then pass more intrusive, oppressive laws, before retiring to collect a nice government pension - while millions freeze jobless in the dark?
13) If you can’t or won’t answer these questions, then why do you think you have a right to tell anyone on this planet that we have a “climate crisis,” and dictate how they must live their lives - especially when you’ve done virtually nothing to slash your own air travel, staff, and home and office energy use?
Paul Driessen is senior policy advisor for the Committee For A Constructive Tomorrow and author of Eco-Imperialism: Green Power - Black Death. He has studied climate change for over 15 years.
May 13, 2010
IPCC Cites an Unpublished Journal 39 Times
By Donna Laframboise, Noconsensus
We read a lot of magazines in our house. Occasionally, an issue arrives in which nearly every article is engaging and (in the case of cooking magazines) every recipe sounds amazing. In short, the issue is a keeper.
The Intergovernmental Panel on Climate Change (IPCC) had an experience like that. It was so impressed by one edition of the academic journal Climatic Change that it cited 16 of the 21 papers published that month. The journal editors should take a bow. When three-quarters of a single issue of your publication is relied on by a Nobel-winning report, you’re doing something right.
Except for one small problem. The issue in question - May 2007 - didn’t exist yet when the IPCC wrote its report. Moreover, none of the research papers eventually published in that issue had been finalized prior to the IPCC’s cutoff date.
As the IPCC chairman recently reminded us, that organization’s 2007 report:
...was based on scientific studies completed before January 2006, and did not include later studies…
That’s what the rules say. And that’s what was supposed to have happened. But according to the online abstracts for each of the 16 papers cited by the IPCC and published in the May 2007 issue of Climatic Change (see my working notes here): 15 of them weren’t accepted by the journal until Oct. 17, 2006, the other wasn’t accepted until May 18, 2006.
The first date is highly significant. As the second box on this page makes clear, the IPCC expert review period ended on June 2, 2006 for Working Group 1 and on July 21, 2006 for Working Group 2. This means the expert reviewers had offered their comments on the second draft and had already exited the stage. It means the IPCC had reached the utmost end of a process that represented years of collective labour.
So how could 16 papers, accounting for 39 new citations across fours chapters and two working groups, have made it into this twice vetted, next-to-finalized IPCC report? Those citations don’t reference research papers the wider scientific community had already digested. They don’t even reference papers that were hot off the press. Instead, in 15 of 16 cases, no expert reviewer could possibly have evaluated these papers since they hadn’t yet been accepted for publication by the journal itself.
Where do these 39 citations of the May 2007 issue of Climatic Change turn up in the IPCC report? [working notes here]
Chapt. 11 by Working Group 1 references ten papers (20 citations in total)
Chapt. 12 by Working Group 2 references nine papers (15 citations in total)
Chapt. 2 by Working Group 2 references two papers (2 citations in total)
Chapt. 3 by Working Group 2 references two papers (2 citations in total)
Among the 10 papers cited in Chapter 11 three were co-authored by Jens Hesselbjerg Christensen. I’m sure it’s sheer coincidence that this gentleman served as one of two coordinating lead authors for that chapter.
see the first abstract here (cited twice as Jacob et al. 2007 on this page of the IPCC report)
second abstract is here (cited as Déqué et al. 2007 on this page)
third abstract is here (cited as Christensen et al. 2007 on this page)
I’m equally certain there’s no connection whatsoever between the fact that Jørgen E. Olesen was a lead author for the IPCC’s Chapter 12 and that a paper he co-authored in the May 2007 issue of Climatic Change got cited four times in that chapter. (That abstract is here. Cited as Olesen et al., 2007 four times on this page.)
Welcome to the strange world of the IPCC. Whenever one turns over a new rock there’s something shady beneath. See post here.
Coming soon: the research paper that wasn’t accepted for publication until May 2008, yet got cited seven times in the IPCC’s 2007 report
|

