May 12, 2010
Ocean Acidification is New Climate Scare, Says SPPI
By Dennis Ambler on SPPI
ICECAP ASIDE:
El Nino dying rapidly. See equatorial Pacific cross section animation showing how lingering warm pool gets mixed out and cold expands. La Nina is coming. here.
See tropical Pacific heat content diminish rapidly below (enlarged here) in the last few months. Now colder than normal.
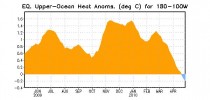
I can’t remember a North Pacific this cold (enlarged image from Unisys).
-----------------
SPPI Monthly CO2 Report
By Cristopher Monckton
Now updated through April here.
-------------------
Ocean Acidification is New Climate Scare, Says SPPI
By Dennis Ambler on SPPI
“Ocean acidification is the new climate scare,” writes Dennis Ambler in a recent paper for the Science and Public Policy Institute, a Washington D.C. non-profit research and education organization.
Ambler’s paper, Dying Shell Fish Larvae: The Story of a Scam, expands on the following points:
Ø Ocean acidification is the new climate scare and is being used as part of the “Climate Change” drive to force emissions legislation.
Ø Presentations to a Congressional hearing on “The Environmental and Economic Impacts of Ocean Acidification” claimed ocean acidification is “real” and that seawater is “corrosive” to shell fish larvae. This is a deliberate distortion; indeed it is a lie.
Ø IPCC AR4 WGI states that the mean pH of surface waters ranges between 7.9 and 8.3 in the open ocean, so the ocean remains alkaline. It is dishonest to present to a lay audience that any perceived reduction in alkalinity means the oceans are turning to acid.
Ø The oft-repeated claim that ocean “acidification” has increased by 30% since the Industrial Revolution is based on an average of a calculation, from an estimate of anthropogenic CO2 uptake by the oceans, from 1750 to 1994. It shows a decrease in alkalinity of 0.1pH unit, well within the range of current ocean pH quoted by IPCC AR4 WG1.
Ø Prominent scientists have claimed that high mortality rates in Oyster hatcheries operated in the North West Pacific, are due to “acid seawater” resulting from upwelling of the deep ocean. There is no acid seawater. As stated in AR4 WGI, the oceans are alkaline, not acid.
Ø Those same scientists stated that bacterial contamination of seawater was not to blame for the high oyster larvae mortality rates.
Ø Contrary to their false claims, the problem of early oyster mortality has been found to be directly caused by a faecal organism, Vibrio tubiashii. Research programs are currently underway to investigate the extent and resolution of the problem.
Ø This research is being conducted by the Pacific Shellfish Institute and was known at the time of the acid seawater claims.
Ø The fact that this was not considered or was even ignored, when the claims of “acid seas damage” were made, is at worst, mischievous and at best, very un-scientific.
The full paper can be read here.
Additional studies on the topic can be found here:
- CO2, Global Warming and Coral Reefs: Prospects for the Future

- Effects of Ocean Acidification on Marine Ecosystems
- Answers to a Fisherman’s Testimony about Ocean Acidification
- Acid Seas, Back to Basic
- A New Propaganda Film by Natl. Resources Defense Council Fails the Acid Test of Real World Data
- Calcification (Other Marine Organisms) - Summary
Contact: Robert Ferguson, Science and Public Policy Institute
202-288-5699
www.scienceandpublicpolicy.org
bferguson@sppinstitute.org
May 07, 2010
Green Mind Control
By Bethany Stotts, Accuracy in Academia
A review of the Princeton Review’s Guide to 286 Green Colleges shows that environmental “literacy” has become a mandatory education component at over three dozen “green” colleges, with entries for 37 of the 286 campuses indicating that these schools have an “environmental literacy requirement” for the student body.
As examples given in the guide show, environmental “literacy” includes not only learning about environmental issues but teaching students to adopt green lifestyles and how to reduce their carbon footprint:
For example, the guide states that at New England College “...every NEC student receives a primer in sustainability and climate change before graduation” (emphasis added). And at Prescott College, “Respect for the natural world, as well as specific training in sustainability, is incorporated into nearly every class (even those without a green focus).”
At the University of Georgia, according to TPR, “...Engineering students have conducted energy audits on campus buildings; students in the College of Journalism and Mass Communication look for ways to promote energy conservation and recycling; and students in the River Basin Science and Policy Center research water quality in area streams.”
The University of Maine entry contains similar language. “UM’s new student orientation includes sustainability programming, and Eco Reps in residence halls coordinate recycling programs and lead other environmental initiatives,” states The Princeton Review guide (emphasis added).
As for the University of Northern Iowa, its “...liberal arts core program incorporates the issue of sustainability and environmental responsibility throughout the curriculum and the capstone course ‘Environment, Technology, and Society’ has specific modules devoted explicitly to the topic.” “UNI Energy! is a student organization that energizes students in residence halls to calculate their carbon footprint and commit to reducing it.”
At the University of Southern Florida, “Undergraduates are taught sustainability as part of the school’s mandatory core curriculum,” states the guide (emphasis added).
Small wonder, then, that a 2010 Gallup poll on climate change attitudes showed that while most demographics had experienced a rise in skepticism about news coverage regarding climate change, Millennials, ages 18 to 29, showed no change. “Notably, all of the past year’s uptick in cynicism about the seriousness of global warming coverage occurred among Americans 30 and older,” wrote Lydia Saad for Gallup on March 11. “The views of 18- to 29-year-olds, the age group generally most concerned about global warming and most likely to say the problem is underestimated, didn’t change.”
It’s not only about greening the campus, but the greening of the student mind,” said Iona College Environmental Concerns Committee Chair Dr. Frederica Rudell, according to the school’s website. “To that end, ECC has helped introduce green marketing programs into the curricula,” states the guide after quoting Rudell.
Some schools whose TPR descriptions indicate they do not have an environmental literacy requirement still integrate green living into their curriculum. For example, Eastern Connecticut State University “...seeks to create a ‘campuswide [sic] culture of conservation and sustainability,’ not only through green-minded initiatives, but also green-minded education in students’ first year program coursework and the school’s Environmental Earth Science major,” according to the guide.
At Harvard College peer pressure pushes sustainability outcomes. “As an example, a peer-to-peer engagement program (picture students running around the dorm telling each other to turn off the lights) has helped Harvard College students reduce their energy consumption by more than 12 percent over the last four years,” states the guide. The TPR publication doesn’t indicate whether or not Harvard College has an environmental literacy requirement.
TPR’s Guide to 286 Green Colleges was “presented in partnership with the U.S. Green Building Council,” according to its website. Rob Franek, Senior Vice President and Publisher for The Princeton Review says in an online video that his organization paid close attention to three “guiding principles” when constructing the guide: “Look for a healthy campus,” “Green curriculum,” and “A commitment to sustainability.”
“In our recent college hopes and worries survey 64% of college applicants and their parents told us that having information about a school’s commitment to the environment would impact their decision to apply to and attend that school,” says Franek in the video. “When we saw those results we knew we had to provide students and parents with this resource as a public service.”
TPR used ten criteria to rate the hundreds of schools it rated, namely,
1. the percentage of food spending on “local, organic or otherwise environmentally preferable food,”
2. whether the school offers bus passes and other public transportation, car sharing, etc. which encourages “alternatives to single-passenger automobile use for students,”
3. “Whether the school has a formal committee with participation from students that is devoted to advancing sustainability on campus,”
4. “Whether new buildings are required to be LEED Silver certified,”
5. “The school’s overall waste diversion rate,” or the rate at which garbage is diverted from landfills,
6. the presence of an “environmental studies major, minor or concentration,”
7. “Whether the school has an ‘environmental literacy’ requirement” (emphasis added),
8. if “the school has produced a publicly available greenhouse gas emissions inventory and adopted a climate action plan consistent with 80 percent greenhouse gas reductions by 2050 targets,”
9. “What percentage of the school’s energy consumption, including heating/cooling and electrical, is derived from renewable sources...” and
10. “Whether the school employs a dedicated full-time (or full-time equivalent) sustainability officer.”
“Of 697 schools we gave ‘Green Ratings’ to, these 286 schools scored in the 80s or 90s on our tallies,” states the guide. See post here. H/T Dr. Cal Beisner, Cornwall Alliance
May 06, 2010
Climate Policies Based on Distorted Temperatures
By Dr. Timothy Ball, Canada Free Press
A speaker from Natural Resources Canada followed me at a conference on “Global Climate Change: Forest Industry Impacts and Responses.” He was speaking in a section titled, “Science and Climate Change Modeling” presumably providing the official government position. Did the Minister approve his position? Government employees doing research almost guarantees a compromise with science. Worse, they have the entire power of government to impose their views. It is at the heart of the problems with climate science because Maurice Strong promoted the bad science through the bureaucracies of the UN and then weather agencies in every country. Instead of disproving the Anthropogenic Global Warming (AGW) hypothesis following normal scientific procedure they worked to prove it. The conference tells the story. It was more about dealing with government policies than with the validity of the science on which those policies were based.
Distortion of The Temperature Record
Weather and climate boondoggles are almost all associated with government agencies and there are two major areas of concern, research and data. Governments control climate research funding so the problem is extended to those they choose to support. What happens if those paid by them find evidence that contradicts the government’s position? Governments control collection and distribution of data. There are many examples of governments creating a record to suit their position. As Anthony Watts notes in his examination of US weather stations that, “We observed that changes in the technology of temperature stations over time also has caused them to report a false warming trend. We found major gaps in the data record that were filled in with data from nearby sites, a practice that propagates and compounds errors. We found that adjustments to the data by both NOAA and another government agency, NASA, cause recent temperatures to look even higher.”
He concludes, “The conclusion is inescapable: The U.S. temperature record is unreliable.” And it is supposedly the best in the world. Watts with Joe D’Aleo have produced an excellent monograph of worldwide problems.
A Classic Example Of Government Science
The government employee opened by taking issue with my presentation when I had no opportunity to respond. Apparently his problem was because I openly gave a biased presentation identifying what was wrong with the ‘official’ climate science that was the basis of the government’s position. I argued that all most people had heard was a bias and they could put the two together and draw their own conclusions. What I presented clearly put his scientific view and therefore the government’s claims in jeopardy. It had to be attacked.
I presented Farhad Manjoo’s claim that: “Facts no longer matter. We simply decide how we want to see the world and then go out and find experts and evidence to back our beliefs.” He misunderstood this by saying the facts do matter, not realizing the facts Manjoo is talking about are manufactured for the purpose. Ironically, in attempting to refute my presentation he used an example that reinforced my position; except he was unaware of what was wrong.
His view and presentation was based on total acceptance of the Intergovernmental Panel on Climate Change (IPCC) claim that the warming is due to CO2. It was the government’s position not what the science shows. He said recent temperatures are the warmest on record. Of course they are because the world has generally warmed since the end of the Little Ice Age. He simply accepts data without understanding its source and limitations.
What he ignored is that global temperature has not increased since 1998 and declined since 2001 as Phil Jones, former Climatic Research Unit (CRU) Director acknowledged.
Kevin Trenberth, another CRU member said, “The fact is that we can’t account for the lack of warming at the moment and it is a travesty that we can’t.”
Well government agencies have found a way to account for the lack of warming. The example used to show I was wrong was a classic example of Manjoo’s claim.
He showed the map (Figure 1) of global temperatures for March as proof warming was not only continuing but increasing.
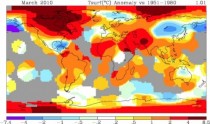
Figure 1: March temperatures with excessive warming in Arctic Canada (enlarged here)
A Means To An End
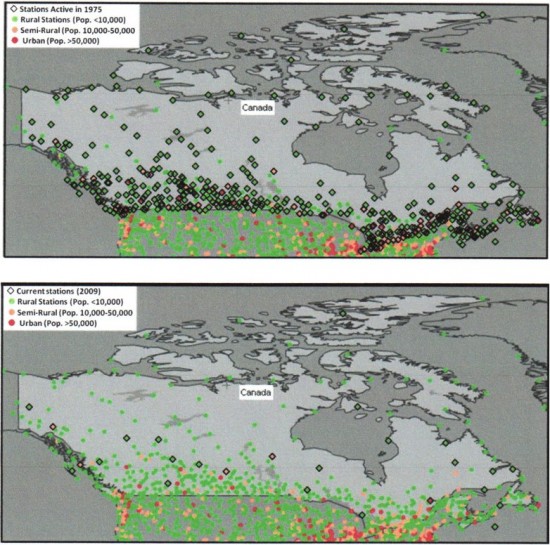
But let’s examine the source of data for that map. Figure 2 compares the number of weather stations used in 1975 with those used to create the map in Figure 1. D’Aleo and Watts (DW) wrote about the data, “Phil Jones admitted “Almost all the data we have in the CRU archive is exactly the same as in the GHCN archive used by the NOAA National Climatic Data Center.” NASA uses the GHCN as the main data source for the NASA GISS data.” They eliminated virtually all the Canadian stations as DW note. “Just one thermometer remains for everything north of the 65th parallel.” Figure 3 shows the changes and as DW observe, “In Canada, the number of stations dropped from 600 to less than 50. The percentage of stations in the lower elevations (below 300 feet) tripled and those at higher elevations above 3000 feet were reduced by half. Canada’s semi-permanent depicted warmth comes from interpolating from more southerly locations to fill northerly vacant grid boxes, even as a simple average of the available stations shows an apparent cooling.” The warming was artificial and created by reducing the number and then selecting specific stations.
This was especially true for the single Arctic station. DW wrote, “That station is Eureka, which has been described as “The Garden Spot of the Arctic” thanks to the flora and fauna abundant around the Eureka area, more so than anywhere else in the High Arctic. Winters are frigid but summers are slightly warmer than at other places in the Canadian Arctic.” These refugia have distinctly different climate conditions and are well-documented areas in the Arctic.

Figure 2: Stations (black diamonds) in 1975 and in 2009 in GHCN (enlarged here)
The Eureka problems don’t end there. A shift to fewer stations involved wider use of a system called METAR that Watts reports creates warm anomalies in temperature maps due to ”missing minus signs”. Below zero temperature readings are often reported as above zero.
Such errors were found at Eureka. Equally troubling was the fact they only take readings for 22 hours. There are no readings for the period from 2200 to 0100 local time.
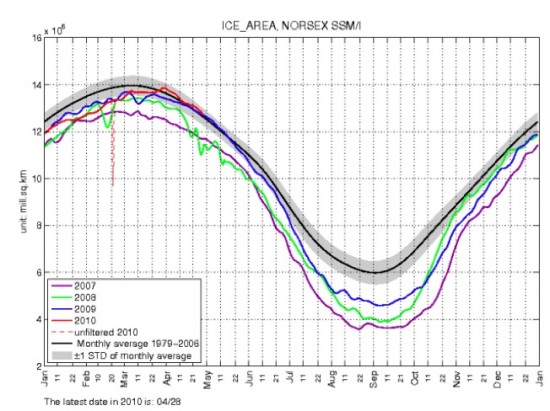
Finally, physical evidence completely contradicts the warming claim. Arctic sea ice continued to expand into April (Figure 3) and beyond the average melting point for the period of record (1979 - 2006).

Figure 3: Arctic sea ice extent (enlarged here)
Recipe For Disastrous Policies
Governments continue to impose rules and regulations based on incorrect climate science using their own manipulated data. They control the research in-house or through funding and are the source of the data that is poorly measured and modified inappropriately, always to create warming. Government scientists are caught between practicing true skeptical science and buying, without question, the government position.
See full story here.
Apr 29, 2010
Oh, Mann: Cuccinelli targets UVA papers in Climategate salvo - University Balks
By Courteney Stuart
No one can accuse Virginia Attorney General Ken Cuccinelli of shying from controversy. In his first four months in office, Cuccinelli directed public universities to remove sexual orientation from their anti-discrimination policies, attacked the Environmental Protection Agency, and filed a lawsuit challenging federal health care reform. Now, it appears, he may be preparing a legal assault on an embattled proponent of global warming theory who used to teach at the University of Virginia, Michael Mann.
In papers sent to UVA April 23, Cuccinelli’s office commands the university to produce a sweeping swath of documents relating to Mann’s receipt of nearly half a million dollars in state grant-funded climate research conducted while Mann - now director of the Earth System Science Center at Penn State - was at UVA between 1999 and 2005.
If Cuccinelli succeeds in finding a smoking gun like the purloined emails that led to the international scandal dubbed Climategate, Cuccinelli could seek the return of all the research money, legal fees, and trebled damages.
“Since it’s public money, there’s enough controversy to look in to the possible manipulation of data,” says Dr. Charles Battig, president of the nonprofit Piedmont Chapter Virginia Scientists and Engineers for Energy and Environment, a group that doubts the underpinnings of climate change theory.
Mann is one of the lead authors of the controversial “hockey stick graph,” which contends that global temperatures have experienced a sudden and unprecedented upward spike (like the shape of a hockey stick).
Neither UVA spokesperson Carol Wood nor Mann returned a reporter’s calls at posting time, but Mann - whose research remains under investigation at Penn State - recently defended his work in a front page story in USA Today saying while there could be “minor” errors in his work there’s nothing that would amount to fraud or change his ultimate conclusions that the earth is warming as a result of human activities, particularly the burning of fossil fuels.
Last fall, the release of some emails by researchers caused turmoil in the climate science world and bolstered critics of the human-blaming scientific models. (Among Climategate’s embarrassing revelations was that one researcher professed an interest in “...punching Charlottesville-based doubting climate scientist Patrick Michaels in the nose.")
Among the documents Cuccinelli demands are any and all emailed or written correspondence between or relating to Mann and more than 40 climate scientists, documents supporting any of five applications for the $484,875 in grants, and evidence of any documents that no longer exist along with proof of why, when, and how they were destroyed or disappeared.
The Attorney General has the right to make such demands for documents under the Fraud Against Taxpayers Act, a 2002 law designed to keep government workers honest. Read more here.
--------------------
Another Global Warming Scientist Slates Legal Probe by John O’Sullivan
Since the Climategate scandal establishment figures have relentlessly stymied unwelcome scrutiny by legal experts. The latest wagon-circler is Dr. Judith Curry, an esteemed member of NASA’s Climate Research Committee for over three years. Now Curry has become a self-appointed apologist for the unethical and some say, fraudulent, conduct of Penn. State University’s climate professor, Michael Mann.
In an interview with Thomas Fuller of the Environmental Policy Examiner (May 4, 2010) this well-heeled establishment scientist criticizes Virginia Attorney General, Ken Cuccinelli, for doing his job. Somehow Dr. Curry manages to fudge the line between a deliberate pre-meditated criminal fraud and an honest mistake.
Her tirade was prompted by Cuccinelli’s legal demand for access to Mann’s records from his former employers at Virginia State University where the tree-ring researcher benefited by almost $500,000 in taxpayer funding.
The Evidence Shows Probable Cause
If anyone doubts Cuccinelli’s just cause then I suggest they read the Wegman Report, those leaked Climategate emails plus the British investigation known as the Oxburgh Committee Report.
Click PDF file to read FULL report from John O’Sullivan (inc. links)
UPDATE: See AAUP and ACLU Wants Virginia to Fight Records Request here. See UVA Suggests It May Not Comply With Cuccinelli Climate-Gate ‘Witch Hunt’ here.
----------------
Scientists decry “assaults” on climate research
By Deborah Zabarenko, Environment Correspondent, Reuters
More than 250 U.S. scientists on Thursday defended climate change research against “political assaults” and warned that any delay in tackling global warming heightens the risk of a planet-wide catastrophe.
The scientists, all members of the U.S. National Academy of Sciences, targeted critics who have urged postponing any action against climate change because of alleged problems with research shown in a series of hacked e-mails that are collectively known as “climate-gate.”
“When someone says that society should wait until scientists are absolutely certain before taking any action, it is the same as saying society should never take action,” the 255 scientists wrote in an open letter in the journal Science.
“For a problem as potentially catastrophic as climate change, taking no action poses a dangerous risk for our planet,” they wrote. They said they were deeply disturbed by “recent escalation of political assaults on scientists in general and on climate scientists in particular.”
Scientists sounded a similar note on Thursday before the U.S. House of Representatives panel on energy independence and climate change. “The reality of anthropogenic climate change can no longer be debated on scientific grounds,” James Hurrell of the U.S. National Center for Atmospheric Research told the committee. “The imperative is to act aggressively to reduce carbon emissions and dependency on fossil fuels.” Read more here.
UPDATE: Australian Broadcasting Corp (ABC) News Watch reports the following:
ABC recently reported on a letter signed by 250 scientists published in the journal Science. The letter is accompanied by a photo of a lone Polar Bear on an ice berg credited to ISTOCKPHOTO.COM. The photo is a fake with the following note in the photo caption at Istockphoto: “This images is a photoshop design. Polarbear, ice floe, ocean and sky are real, they were just not together in the way they are now.” The same background is also available with one emperor penguin (HERE) or three (HERE).
What does the use of a faked photo say about the scientific credibility of the journal in question?
----------------------
The ClimateGate Scandals: What has been revealed and what does it mean?
by William Yeatman, Global Warming.org
On April 16th, the Cooler Heads Coalition and the Heritage Foundation hosted a briefing on Climategate by Dr. Patrick J. Michaels, Senior Fellow in Environmental Studies, Cato Institute and Joseph DAleo, Executive Director, ICECAP, and Consulting Meteorologist.
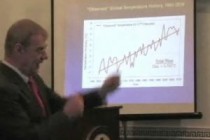
Dr. Patrick J. Michaels, Senior Fellow, CATO Institute
The scientific case for catastrophic global warming was already showing signs of weakening when the Climategate scientific fraud scandal broke in November 2009. This release of thousands of computer files and emails between leading global warming scientists showed evidence of data manipulation, flouting of freedom of information laws, and attempts to suppress publication of research that disagreed with the alarmist “consensus.”
Climategate has raised many questions about the reliability of key temperature records as well as the objectivity of the researchers and institutions involved, but it is far from the only global warming-related controversy. It has been followed by revelations that some of the most attention-grabbing claims in the 2007 UN Intergovernmental Panel on Climate Change’s (IPCC) Fourth Assessment Report - the supposed gold standard of climate science - were simply made up. Before laws regulating energy use are enacted that could well cost trillions of dollars, it is crucial to understand the extent to which the alleged scientific consensus supporting global warming alarmism has been discredited by these scandals. Join us for a discussion featuring two scientists who have closely studied Climategate.
Click here to view video of the briefing. See post and more here.
Apr 28, 2010
The Association of Outgoing Radiation with Variations of Precipitation - GW Implications
By Dr. William Gray and Barry Schwartz
1. INTRODUCTION
Global warming scenarios from CO2 increases are envisioned to bring about rainfall enhancement and resulting upper tropospheric water vapor rise. This initial water vapor enhancement has been hypothesized and programmed in climate models to develop yet additional rainfall and water vapor increase. This causes an extra blockage of IR energy to space (a positive feedback warming mechanism). This additional rainfall and IR blockage is modeled to be approximately twice as large as the additional rainfall needed to balance the increased CO2 by itself. The reality of this additional warming and extra IR blockage has been questioned by many of us. This study analyzes a wide variety of infrared (IR) radiation differences which are associated with rainfall differences on different space and time scales. Our goal is to determine the extent to which the positive rainfall feedbacks as are included in the climate model simulations are realistic.
We have analyzed 21 years (1984-2004) of ISCCP (International Satellite Cloud Climatology Project) outgoing solar (albedo) and outgoing longwave infrared (IR) radiation (often referred to as OLR) on various distance (local to global) and time scales (1 day to decadal). We have investigated how radiation measurements change with variations in precipitation as determined from NCEP-NCAR Reanalysis data on a wide variety of space and time scales (Figure 1).
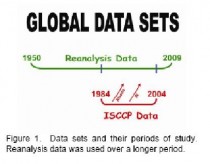
Figure 1. Data sets and their periods of study. Reanalysis data was used over a longer period.
We have stratified our radiation and rainfall data into three latitudinal sections and six distinctive longitudinal areas (Figure 2).
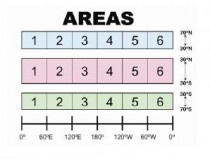
Figure 2. Areas of study.
Infrared and albedo changes associated with rainfall variations by month (January to December) and by yearly periods for the globe (70N-70S; 0-360) as a whole and separately for the tropics (30N-30S; 0-360) have been studied. This analysis shows they are not realistic.
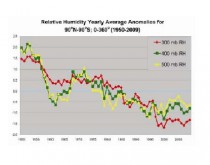
Above shown global tropospheric water vapor trends over the period from 1950-2009 for 300, 400 and 500mb RH.
Much more detail in paper. Click to download PDF file from William M. Gray and Barry Schwartz
|

