It is a quiet controversy about global warming. At least one local broadcaster had been hoping to keep it quiet.
But after considerable persuasion last week, the Fox affiliate WDAF reluctantly allowed its chief meteorologist, Mike Thompson, to explain in an e-mail to The Kansas City Star why he breaks from the scholarly worldview of the causes of climate change.
“It has become completely political - it’s not about science at all,” he wrote in an e-mail. “If science were the objective, then we would be seeing an entirely different debate. But there are agendas at play, and it has undermined the credibility of climate science.”
Others in his profession share that view.
“Global warming is the greatest scam in history,” blogged a veteran TV weatherman in San Diego, John Coleman, in late 2007. He then appeared on Glenn Beck’s show.
That hardly stunned University of Texas researcher Kris Wilson, who for years has probed the wide range of attitudes, values and skill sets of those beamed into your living room to chat up the weather.
What did surprise Wilson was that 29 percent of meteorologists in a modest survey he conducted took Coleman’s side - “a scam,” they called the scare.
And a clear majority of 121 weathercasters polled - 62 percent - said they thought climate models were unreliable for predicting temperatures and sea levels to come.
It is important to know that meteorologists are not climatologists.
One group projects snowfall and sometimes blows the call, making doubt and error the weatherman’s constant companions. The other group - more degree-decorated, but sound-bite challenged - studies such things as ice caps, sunlight absorption and carbon-dioxide levels to reach conclusions about planetary conditions decades from now.
The quarrels between the two make the American Meteorological Society uneasy. Through education and “more dialogue,” the AMS and other science groups seek to bring more weathercasters in line with scientists who insist that global warming is a reality most likely aggravated by human actions.
“The climate scientists tend not to appreciate the concerns of broadcasters, and meteorologists tend to underestimate how much work the climate scientists do and care they take,” said AMS Director Keith Seitter. “We’re trying to get these folks to communicate with each other better.”
Nobody knows exactly how many weathercasters are skeptical of the scientific line on climate change and its causes. Wilson, who soon will release results of a poll of more than 500 meteorologists, calls the skeptics “a vocal minority.”
They range from Joseph D’Aleo - who, with Coleman, established the Weather Channel - to a former director of the National Hurricane Center. From WeatherData Inc. executive Mike Smith of Wichita to the 44 TV weathercasters who signed a 2008 petition circulated by U.S. Sen. James Inhofe. An Oklahoma Republican, Inhofe is a fiery critic of climate science.
Plenty of others, including KSHB chief meteorologist Gary Lezak, scoff at the skepticism.
“I absolutely believe it’s politically driven,” he said. “I’m not politically driven...I go with the overwhelming scientific evidence. “The fact is, the Earth is warming up. Far as I know, 90 to 95 percent of scientists believe climate change is real and it has a human influence. Am I able to change my mind in 10 years if the facts show otherwise? Of course.”
ICECAP NOTE: But Gary, the earth has been cooling since 2001. Not anywhere near 90-95% scientists buy into man-made global warming and politics has little to do with it. On the ICECAP board, we have the full spectrum of political leanings from liberal to independent to libertarian to conservative. That is true among all the skeptics I know. Right now, one political party is more open to a balanced view which is why it appears we are politcially driven. I am glad to hear you say you are open to change your mind. Scientists should always feel that way.
With the Midwest facing an unusually harsh winter, the politicized research of “Climategate” still ringing in our ears and the nation’s capital beneath 3 feet of snow, skeptics brandishing the AMS seal are ramping up their arguments that “solar cycles” and other natural events have caused warming patterns since the 1970s.
Sun activity, measured in spots and bursts, is thought to vary over multiyear periods. Some say that in recent years we have entered a calmer cycle that will deliver cold, snowy winters like those of the 1960s. Others say heavy snows may instead be the result of more moisture in the atmosphere due to ice caps melting beneath greenhouse gases.
The AMS and Congress-funded National Environmental Education Foundation work together to provide science news and online courses to weathercasters who rely on the AMS for certification.
Because of documented levels of trust people place in on-air personalities who seem up on their science, “the future of climate-change policy rests to a not insubstantial degree on the well-tailored shoulders of the local weatherman,” a cover story in the Columbia Journalism Review said.
One problem is that not all weathercasters are scientists - many majored in journalism - and unlike the graduate-level pursuits of most climate scientists, meteorology degrees can be earned in four years.
“By no means do I consider myself an expert on long-term forecasting,” said KMBC chief meteorologist Bryan Busby. “At St. Louis University, I took one course in climatology.”
But what he and other certified meteorologists know too well is that computer models used in predicting highs and lows fail all the time. Purporting to be certain of the weather next week, much less climate patterns by century’s end, strikes Busby as a bit arrogant: “I suspect somewhere in the middle of both camps lies the truth.”
True, climatologists use similar computer models. But they do so in different ways and for different purposes.
“The models used for predicting weather are inherently volatile,” said Wilson, a scientist and member of the journalism faculty in Austin. “The climate models are not like that. They’re inherently stable.”
ICECAP NOTE: Yes that is why the Climate Prediction Center moved instead to statistical methods and trends because the stable climate models were showing too little skill
WDAF’s Thompson laid into Al Gore, the Intergovernmental Panel on Climate Change and “cap-and-trade” proposals in a KCMO radio interview in December: ‘“Our kids and our kids’ kids are going to be paying for this mess for a long time.”
The rhetoric does get heated. Citing the “gravy train of grants” available to climate “alarmists,” meteorologist D’Aleo said network affiliates pressured some weathercasters to keep their skepticism to themselves “because they might lose advertising. There’s a lot of green money out there.”
D’Aleo also accused the AMS of trying to get weathercasters “to evangelize” the worst fears of climatologists to the 99 percent of Americans who own TVs.
While the society did draft a fought-over statement citing “adequate evidence… that humans have significantly contributed” to Earth heating up, Seitter of the AMS said nobody was urging skeptics to quiet down - but just to “know the scientific background and read the articles.”
To reach weathercasters in 125 U.S. media markets, the National Environmental Education Foundation puts out a weekly Earth Gauge newsletter with “climate facts” pointing out, for example, the retreat of glaciers and the northward movement of bird species.
ICECAP NOTE: This story was a fair and balanced piece. I should point out NEEF is politically driven (chartered by Congress in 1990 to advance environmental knowledge and action) and so is the AMS which has as its third organizational goal, policy advocacy. If I were executive director, I would advocate only good science.
By Kirk Myers, Seminole County Environmental Examiner
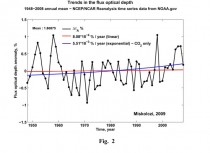
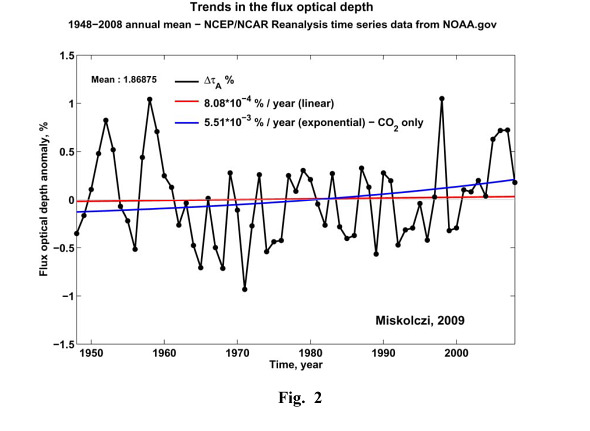
Enlarged here. The black line is the annual variation in atmospheric “absorbing power” over a 61-year period. The red trend line shows the greenhouse aborbing power remaining constant (in equilibrium) during that period. Greenhouse absorption increases (blue trend line) only when H20 levels are kept constant.
Editor’s note: In response to reader interest in Dr. Ferenc Miskolczi’s provocative greenhouse theory challenging the widespread belief in man-caused global warming, Examiner.com has asked the former NASA researcher to explain his work further. Earlier this week he attacked the prevailing climate-change theory, calling it “a lie.”
At Dr. Miskolczi’s request, we also have posted his letter sent last year to the Environmental Protection Agency, summarizing his research and questioning the agency’s efforts to declare CO2 a harmful pollutant that poses a threat to earth’s climate.
Examiner.com: Has there been global warming?
Dr. Miskolczi: No one is denying that global warming has taken place, but it has nothing to do with the greenhouse effect or the burning of fossil fuels.
Examiner.com: According to the conventional anthropogenic global warming (AGW) theory, as human-induced CO2 emissions increase, more surface radiation is absorbed by the atmosphere, with part of it re-radiated to the earth’s surface, resulting in global warming. Is that an accurate description of the prevailing theory?
Dr. Miskolczi: Yes, this is the classic concept of the greenhouse effect.
Examiner.com: Are man-made CO2 emissions the cause of global warming?
Dr. Miskolczi: Apparently not. According to my research, increases in CO2 levels have not increased the global-average absorbing power of the atmosphere.
Examiner.com: Where does the traditional greenhouse theory make its fundamental mistake?
Dr. Miskolczi: The conventional greenhouse theory does not consider the newly discovered physical relationships involving infrared radiative fluxes. These relationships pose strong energetic constraints on an equilibrium system.
Examiner.com: Why has this error escaped notice until now?
Dr. Miskolczi: Nobody thought that a 100-year-old theory could be wrong. The original greenhouse formula, developed by an astrophysicist, applies only to the stars, not to finite, semi-transparent planetary atmospheres. New equations had to be formulated.
Examiner.com: According your theory, the greenhouse effect is self-regulating and stabilizes itself in response to rising CO2 levels. You identified (perhaps discovered) a “greenhouse constant” that keeps the greenhouse effect in equilibrium. Is that a fair assessment of your theory?
Dr. Miskolczi: Yes. Our atmosphere, with its infinite degree of freedom, is able to maintain its global average infrared absorption at an optimal level. In technical terms, this “greenhouse constant” is the total infrared optical thickness of the atmosphere, and its theoretical value is 1.87. Despite the 30 per cent increase of CO2 in the last 61 years, this value has not changed. The atmosphere is not increasing its absorption power as was predicted by the IPCC.
Examiner.com: You used empirical data, rather than models, to arrive at your conclusion. How was that done?
Dr. Miskolczi: The computations are relatively simple. I collected a large number of radiosonde observations from around the globe and computed the global average infrared absorption. I performed these computations using observations from two large, publicly available datasets known as the TIGR2 and NOAA. The computations involved the processing of 300 radiosonde observations, using a state-of-the-art, line-by-line radiative transfer code. In both datasets, the global average infrared optical thickness turned out to be 1.87, agreeing with theoretical expectations.
Examiner.com: Have your mathematical equations been challenged or disproved?
Dr. Miskolczi: No.
Examiner.com: If your theory stands up to scientific scrutiny, it would collapse the CO2 global warming doctrine and render meaningless its predictions of climate catastrophe. Given its significance, why has your theory been met with silence and, in some instances, dismissal and derision?
Dr. Miskolczi: I can only guess. First of all, nobody likes to admit mistakes. Second, somebody has to explain to the taxpayers why millions of dollars were spent on AGW research. Third, some people are making a lot of money from the carbon trade and energy taxes.
Examiner.com: A huge industry has arisen out of the study and prevention of man-made global warming. Has the world been fooled?
Dr. Miskolczi: Thanks to censored science and the complicity of the mainstream media, yes, totally.
This comment is to demonstrate, that the origin of the observed global warming (positive global average surface temperature trend) in the last few decades can not be caused by the observed increase of the atmospheric CO2 concentration.
In theoretical radiative transfer, the absorbing power of infrared active gases are measured by the total infrared optical depth (TIOD). This dimensionless quantity is the negative natural logarithm of the ratio of the absorbed surface upward radiation by the atmosphere to the total emitted surface upward radiation.
The recent value of the TIOD is 1.87, which value fully complies with the theoretical expectation of an optimal (saturated) greenhouse effect of a greenhouse gas (GHG)-rich planet. (Miskolczi - 2007).
With relatively simply computations, we show that in the last 61 years, despite the 30 per cent increase in the atmospheric CO2 concentration, the cumulative greenhouse effect of all atmospheric greenhouse gases has not been changed - that is, the atmospheric TIOD is constant.
According to the most plausible explanation of the above fact, the equilibrium atmospheric H2O content is constrained with the theoretical optimal TIOD. Our simulation results are summarized in . . . Fig. 2.
. . . Apparently, increased total CO2 column amount is coupled with decreasing H2O column amount. As the result of the opposing trends in the two most important GHGs, in Fig. 2 the red curve shows no trend in the TIOD. In the last 61 years, the infrared absorbing capability of the atmosphere has not been changed; therefore, the greenhouse effect can not be the cause of the global warming.
In case of fixed atmospheric H2O column amount, simulation results show that according to the positive trend in the CO2 content of the atmosphere, there would also be a significant positive trend in the TIOD (blue curve).
The above results are the plain proofs that the IPCC consensus on the causes of the global arming is totally wrong, and the physics of the greenhouse effect requires serious revisions.
Hot Enough for You? Global warmists used to love talking about the weather! By James Taranto
It’s been a slow week for news because it’s been a big week for weather. The East Coast is covered in snow, and Time magazine blames global warming. No, seriously: “There is some evidence that climate change could in fact make such massive snowstorms more common, even as the world continues to warm.” The New York Times says the same thing, though two-sidedly: “The two sides in the climate-change debate are seizing on the mounting drifts to bolster their arguments.”
The Time story notes that climate is not the same thing as weather:
Ultimately, however, it’s a mistake to use any one storm--or even a season’s worth of storms--to disprove climate change (or to prove it; some environmentalists have wrongly tied the lack of snow in Vancouver, the site of the Winter Olympic Games, which begin this week, to global warming). Weather is what will happen next weekend; climate is what will happen over the next decades and centuries. And while our ability to predict the former has become reasonably reliable, scientists are still a long way from being able to make accurate projections about the future of the global climate.
Wait a minute, “scientists are still a long way from being able to make accurate projections about the future of the global climate”? We thought global warming was settled science, and anyone who doubted it was a knuckle-dragging lackey or handmaid of Big Oil! (Sorry for the mixed metaphors, but at least we’re gender inclusive.)
It is now clear the media’s approach ... assigning too much authority to the IPCC. Yesterday London’s Guardian, a left-wing paper that has long been squarely in the global-warmist camp, carried a damning report titled “How to Reform the IPCC”:
The IPCC says its reports are policy relevant, but not policy prescriptive. Perhaps unknown to many people, the process is started and finished not by scientists but by political officials, who steer the way the information is presented in so-called summary for policymakers [SPM] chapters. Is that right, the Guardian asked?
“The Nobel prize was for peace not science . . . government employees will use it to negotiate changes and a redistribution of resources. It is not a scientific analysis of climate change,” said Anton Imeson, a former IPCC lead author from the Netherlands. “For the media, the IPCC assessments have become an icon for something they are not. To make sure that it does not happen again, the IPCC should change its name and become part of something else. The IPCC should have never allowed itself to be branded as a scientific organisation. It provides a review of published scientific papers but none of this is much controlled by independent scientists.”
And of course the University of East Anglia emails showed that the so-called independent scientists manipulated data and tried to blacklist colleagues who did not accept the global-warmist hypotheses.
It’s true that cold weather, while providing an occasion to mock global warming, does not disprove it. But the mocking would be far less effective had global warmists not spent the past quarter-century making a mockery of the scientific method.
By Marlo Lewis in Pajamas Media, Februrary 10, 2010
Air quality in the United States has improved dramatically over the past 40 years, yet Moveon.Org wants you to believe that breathing the air is like being a pack-a-day smoker.
Moveon broadcasts this disinformation in TV ads bashing Senators Blanche Lincoln (D-AR), Ben Nelson (D-NB), and Mary Landrieu (D-LA). The ads show little leaguers, a mother and her bottle-feeding infant, track athletes, and even a mother giving birth all smoking cigarettes. As these images flash by, the text of the ads says: While Senator Landrieu [or Lincoln, or Nelson] works to roll back the Clean Air Act, many Americans are already smoking the equivalent of a pack a day just from breathing the air.
Senator Landrieu [or Lincoln, or Nelson], Americans need the Clean Air Act. Leave it alone.
The Moveon ad is a triple whopper, piling falsehood upon falsehood upon falsehood. No American smokes the equivalent of a pack a day just by breathing. The senators are not working to “roll back” the Clean Air Act. The policy they support - one that Moveon opposes - would not slow any federal or state efforts to clean the air. Let’s examine each falsehood in turn.
Moveon claims that “many” Americans breathe the equivalent of a pack of cigarettes a day. Cigarette smoking accounts for 30% of all cancer deaths in the United States, and nine out of 10 lung cancer deaths. So how does cigarette smoke compare with outdoor air in regard to airborne carcinogens?
Nazaroff and Singer (2004), a study by researchers at UC Berkeley and the Lawrence Berkeley National Laboratory, found that, by breathing indoor “environmental tobacco smoke” (ETS), non-smokers who live with a smoker each year inhale 1.2 to 150 times more of six known carcinogens than they inhale from “ambient"(outdoor) sources. Smokers themselves get a bigger dose of carcinogens, since they inhale both first- and second-hand smoke.
Not only is Moveon’s pack-a-day claim false, it could also harm “the children,” because it trivializes the risks of smoking. After all, a gullible teenager might reason, if breathing is as unhealthy as smoking, then how bad can smoking be?
Maybe what Moveon means is that people living in some U.S. cities inhale as much airborne particulate matter (PM) as a smoker gets from a pack a day. Much recent EPA action targets the so-called fine particles, those measuring 2.5 micrometers or less in size, known in regulatory parlance as PM2.5. Elevated levels of PM2.5 are associated with increased risks of cardiopulmonary and cardiovascular diseases. Do many (or any) of us get a pack-a-day dose of PM2.5 just by breathing?
Koong et al. (2009), a 24-country study by three prestigious health institutes, found substantially higher PM2.5 levels in workplace ETS than in the ambient air, in all regions of the world. In the Americas, for example, PM2.5 levels average 248 micrograms per cubic meter (μg/m3) in workplaces where smoking is allowed. On the other hand, PM2.5 in outdoor air averages less than 15 micrograms/m3, and even the most polluted U.S. cities average about 20 micograms/m3, or less than one-tenth the 248 micrograms/m3 of PM2.5 found in smoking venues.
Moveon is blowing smoke - nowhere in the United States is breathing the equivalent of a pack a day or even one cigarette a day.
Turning now to the second falsehood, none of the senators is working to “roll back” the Clean Air Act. The senators have crossed party lines to support a resolution, introduced by Republican Sen. Lisa Murkowski of Alaska, to stop the U.S. Environmental Protection Agency (EPA) from dealing itself, trial lawyers, and activist judges into a position to set climate policy for the nation.
Here’s the pertinent background you won’t get from Moveon’s attack ads. Last December, EPA issued a finding that emissions of carbon dioxide (CO2) and other greenhouse gases endanger public health and welfare. If this were just a scientific assessment of the relevant literature - like the surgeon general’s famous finding in 1964 that cigarette smoke causes cancer - the Senate would have no business voting on it.
But unlike the surgeon general’s report, which did not presume even to advise Congress on policy options, EPA’s finding will trigger a regulatory cascade through multiple provisions of the Clean Air Act. EPA could end up administering global warming regulations more costly and intrusive than any Congress has considered and either rejected or failed to pass, yet without the people’s elected representatives ever voting on the policies.
As even the EPA all-but-acknowledges, the endangerment finding tees up several “absurd results” that are contrary to congressional intent. For example, EPA will have to apply Clean Air Act pre-construction permitting requirements to tens of thousands of small businesses, and operating permit requirements to millions. Unless EPA poaches legislative power and amends the Act, as it proposes to do in its legally dubious “tailoring rule,” the permitting programs will crash under the own weight, freezing construction activity and putting millions of firms in legal limbo. Apply the Clean Air Act to CO2 - the inescapable consequence of the endangerment finding - and the Act mutates into a gigantic anti-stimulus program.
Murkowski’s resolution would avert this debacle. In so doing, it would also remove the necessity for EPA to play lawmaker and violate the separation of powers in order to avoid “absurd results.” The Murkowski resolution would be good policy even if we were not experiencing the worst economic downturn since the Great Depression.
Moveon also neglects to mention that the endangerment finding logically commits EPA to establish national ambient air quality standards (NAAQS) for CO2 set below current atmospheric levels. Even a global depression lasting several decades would not be enough to bring America (and the world) into attainment with such a standard. Yet the Clean Air Act obligates states to attain “primary” (health-based) NAAQS within five or at most 10 years, or face various restrictions and sanctions such as the loss of federal highway funds. Regulating CO2 under the NAAQS program is a recipe for national economic disaster. Murkowski’s resolution would nip that mischief in the bud as well.
Although a strong case can be made that the endangerment finding is scientifically flawed, that is not what Sen. Murkowski’s resolution is about. Contrary to misrepresentation by Sen. Barbara Boxer (D-CA) and others, the resolution is not a referendum on climate science. It is a referendum on whether bureaucrats with a vested interest in expanding their power should make climate policy. The resolution would veto the regulatory force and legal effect of the endangerment finding - not its scientific reasoning or conclusions. Indeed, Sen. Murkowski is not a global warming skeptic, nor is she opposed in principle to greenhouse gas regulation. She simply believes that climate policy is too important to be made by a bureaucracy with no accountability to the American people.
The Murkowski resolution would not change one word of the Clean Air Act. It would not alter any program that EPA administers under the Act. It would not reduce funding for any EPA program. It would, however, avert an era of unaccountable regulation. It’s this defense of democracy that Moveon.org vilifies.
Moveon’s third whopper is the notion - implied rather than stated - that CO2 is an air contaminant like tobacco smoke and, thus, that anyone who opposes EPA regulation of CO2 must be in favor of polluting the air. Unless EPA regulates CO2 emissions, Moveon suggests, even more people will smoke just by breathing.
This claim too is complete bunk. An odorless, colorless trace gas that is non-toxic to humans and animals at more than 30 times ambient levels, CO2 is an essential plant nutrient, the basic building block of the planetary food chain. Animal life depends on plant life, and plants raised in CO2-enriched environments grow larger and faster, use water more efficiently, and are more resilient to environmental stresses such as drought and air pollution. Yes, CO2 is a greenhouse (heat trapping) gas, but so is water vapor, which obviously is not air pollution. Calling CO2 emissions “carbon pollution” is a rhetorical trick designed to fool the unwary into believing the kind of nonsense Moveon.org is peddling.
History proves that cleaning the air does not depend on capping or otherwise restricting CO2 emissions. U.S. air quality has improved dramatically, decade by decade for almost as long as we’ve been measuring it. Indeed, particulate matter has been dropping since at least the late 1950s. Between 1980 and 2008, nationwide air pollution levels decreased 79% for carbon monoxide, 25% for ozone, 92% for lead, 46% for nitrogen dioxide, and 71% for sulfur dioxide. Between 1990 and 2008, air pollution levels decreased 31% for coarse particulates (PM10) and 20% for PM2.5.
This progress will continue under regulations already on the books or planned, as motor vehicle fleets turn over to cleaner vehicles and new capital stock replaces old. The bottom line: America’s air is very clean by historical standards, and pollution levels will continue to drop under existing EPA and state requirements that will not be affected in any way by the Murkowski resolution.
Moveon’s ad campaign is a falsehood from top to bottom. Moveon.org should promptly do three things: (1) Apologize to Sens. Landrieu, Lincoln, and Nelson for subjecting them to a smear campaign. (2) Apologize to its members for feeding them falsehoods instead of providing truthful information. (3) Return every penny to anyone whom the ads frightened or angered into contributing money to Moveon.Org.
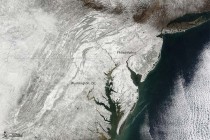
Update: A new storm is moving east and will dump another heavy snow on the Mid-Atlantic. It is likely to give DCA and PHL their all-time seasonal snow records with still more winter to come. Another storm will follow in the deep south with snow close to the Gulf. See the view of the deep snow from space from NASA below and enlarged here.
The mainstream mediasphere and the alarmist blogosphere has been ignoring or dismissing the dominos of global warming collapsing as the fraudulent machinations of the IPCC are exposed, NOAA and NASA and CRU data manipulation is revealed and their heroes Michael Mann and Phil Jones are being investigated, and this incredible winter unfolds in many areas of the United States and Europe and Asia.
China has had the coldest weather since 1971. Europe and Russia experienced brutal, deadly cold and heavy snows. Snow and cold surprised delegates to the UN Copenhagen global warming conference and followed Obama and congress back to DC.
Florida and parts of the southeast had the longest stretch of cold weather in history. Florida citrus areas had the worst damage since 1989. Washington saw a heavy snowstorm in December and now a record breaking storm in early February. Another one is on the way and will likely affect other cities further north.
In recent years snows have fallen in unusual places like Iraq, Saudi Arabia, Buenos Aires, southern Brazil. Johannesburg, South Africa, southern Australia, the Mediterranean Coast and Greece. All-time record snows fell in many locales across the western and northern United States from Washington State and Oregon and Colorado to Iowa, Wisconsin, Michigan, Vermont and Maine. All-time records were also set in southern Canada and now the Mid-Atlantic.
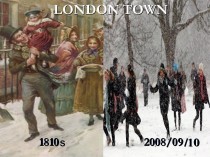
Snow returned to the UK reminiscent of the Dickens winters the last few years.
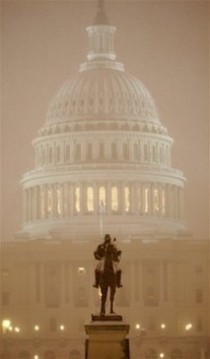
Washington was oblivious to the wild weather, so nature has brought the wild weather to their backyard. This storm brought over 3 feet of snow to a few spots around the nation’s capitol, perhaps to estates of some of the nation’s political leaders or media bigwigs (see list of snow totals here). See a news accounts of it here. It and following storms will ensure DC will have the All-TIME SNOWIEST WINTER ever going back to 1871. Expect the enviro wackos and their media lapdogs to come out and claim the storm and cold winter is the result of global warming.
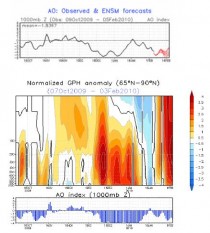
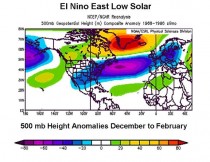
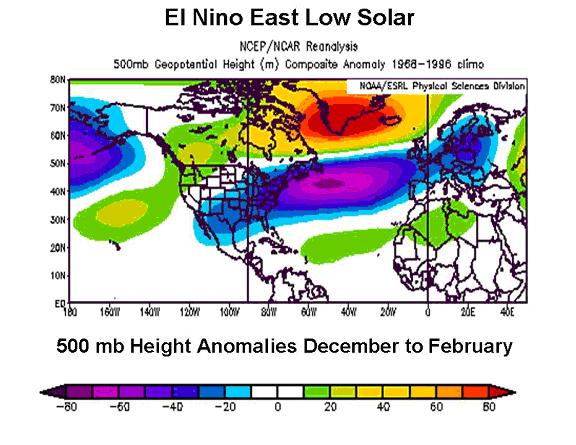
The winter was not a surprise to many of the private industry forecasters, unencumbered by the global warming albatross. We expected the winter to be a harsh one (see here). The reasons we felt so was a developing stratospheric warming in the polar regions of the northern hemisphere favored in east QBO low solar years and east QBO low solar El Ninos and also in winters following high latitude volcanoes (Redoubt and Sarychev). The stratospheric warming started in late November peaked in December then faded in mid January. Often in years when it occurs early, it recurs later (2000-2001, 1995-1996, 1977-78).
The stratospheric warming leads to a negative arctic oscillation (exceeding 5 standard deviations in December and again in February) which pushed cold air to middle latitudes while surface temperatures in the higher latitude are cold but above normal under the warm ridging aloft. This kind of pattern happened in the 1960s and 1970s and indeed the winter is very much like 1965/66, 1968/69, and 1977/78 in that regard.
See Steve Goddard;s post in Watts Up With That in what that might mean for the arctic ice this summer here.
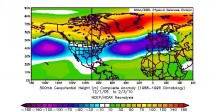
See how well through February 3rd, the upper level pattern has fit the expected pattern based on these natural factors.
Also we are back in the cold Pacific Decadal Oscillation (PDO) phase which favors the colder El Ninos of the late 1950s to late 1970s (and again 2002/03).
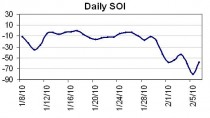
Expect another storm this upcoming week with perhaps more snow for DC and this time further north, where less has fallen so far this season. The SOI hit an amazing 8 STD negative last week.
The water is warmest in the central tropical Pacific. A cold pool northwest of Hawaii also favors a cold central and east. That argues for a continued active southern storm track. The warm central Pacific and cold east also favors the same pattern as the East QBO low solar El Ninos, cold PDO. Once again natural oscillations provide a better indication of weather AND climate then the CO2, aerosol forcing dominated tinkertoy climate models (see a new peer review paper on their limitations here).
Looking ahead, these stratospheric warming events last 4 to 6 weeks so since it began in late January, expect it to continue at least several more weeks. Cold air and snow will be returning to Europe too after the same January thaw we experienced here in the states before winters return. See full PDF here. Updates to come after the storms the next week.
Guest post on Watts Up With That by Jerome Ravetz of Oxford University, UK
At the end of January 2010 two distinguished scientific institutions shared headlines with Tony Blair over accusations of the dishonest and possibly illegal manipulation of information. Our ‘Himalayan glaciers melting by 2035’ of the Intergovernmental Panel on Climate Change is matched by his ‘dodgy dossier’ of Saddam’s fictitious subversions. We had the violations of the Freedom of Information Act at the University of East Anglia; he has the extraordinary 70-year gag rule on the David Kelly suicide file. There was ‘the debate is over’ on one side, and ‘WMD beyond doubt’ on the other. The parallels are significant and troubling, for on both sides they involve a betrayal of public trust.
Politics will doubtless survive, for it is not a fiduciary institution; but for science the dangers are real. Climategate is particularly significant because it cannot be blamed on the well-known malign influences from outside science, be they greedy corporations or an unscrupulous State. This scandal, and the resulting crisis, was created by people within science who can be presumed to have been acting with the best of intentions. In the event of a serious discrediting of the global-warming claims, public outrage would therefore be directed at the community of science itself, and (from within that community) at its leaders who were either ignorant or complicit until the scandal was blown open. If we are to understand Climategate, and move towards a restoration of trust, we should consider the structural features of the situation that fostered and nurtured the damaging practices. I believe that the ideas of Post-Normal Science (as developed by Silvio Funtowicz and myself) can help our understanding.
There are deep problems of the management of uncertainty in science in the policy domain, that will not be resolved by more elaborate quantification. In the gap between science and policy, the languages, their conventions and their implications are effectively incommensurable. It takes determination and skill for a scientist who is committed to social responsibility, to avoid becoming a ‘stealth advocate’ (in the terms of Roger Pielke Jr.). When the policy domain seems unwilling or unable to recognise plain and urgent truths about a problem, the contradictions between scientific probity and campaigning zeal become acute. It is a perennial problem for all policy-relevant science, and it seems to have happened on a significant scale in the case of climate science. The management of uncertainty and quality in such increasingly common situations is now an urgent task for the governance of science.
We can begin to see what went seriously wrong when we examine what the leading practitioners of this ‘evangelical science’ of global warming (thanks to Angela Wilkinson) took to be the plain and urgent truth in their case. This was not merely that there are signs of exceptional disturbance in the ecosphere due to human influence, nor even that the climate might well be changing more rapidly now than for a very long time. Rather, they propounded, as a proven fact, Anthropogenic Carbon-based Global Warming. There is little room for uncertainty in this thesis; it effectively needs hockey-stick behaviour in all indicators of global temperature, so that it is all due to industrialisation. Its iconic image is the steadily rising graph of CO2 concentrations over the past fifty years at the Mauna Loa volcano in Hawaii (with the implicit assumption that CO2 had always previously been at or below that starting level). Since CO2 has long been known to be a greenhouse gas, with scientific theories quantifying its effects, the scientific case for this dangerous trend could seem to be overwhelmingly simple, direct, and conclusive.
In retrospect, we can ask why this particular, really rather extreme view of the prospect, became the official one. It seems that several causes conspired. First, the early opposition to any claim of climate change was only partly scientific; the tactics of the opposing special interests were such as to induce the proponents to adopt a simple, forcefully argued position. Then, once the position was adopted, its proponents became invested in it, and attached to it, in all sorts of ways, institutional and personal. And I suspect that a simplified, even simplistic claim, was more comfortable for these scientists than one where complexity and uncertainty were acknowledged. It is not merely a case of the politicians and public needing a simple, unequivocal message. As Thomas Kuhn described ‘normal science’, which (as he said) nearly all scientists do all the time, it is puzzle-solving within an unquestioned framework or ‘paradigm’. Issues of uncertainty and quality are not prominent in ‘normal’ scientific training, and so they are less easily conceived and managed by its practitioners.
Now, as Kuhn saw, this ‘normal’ science has been enormously successful in enabling our unprecedented understanding and control of the world around us. But his analysis related to the sciences of the laboratory, and by extension the technologies that could reproduce stable and controllable external conditions for their working. Where the systems under study are complicated, complex or poorly understood, that ‘textbook’ style of investigation becomes less, sometimes much less, effective. The near-meltdown of the world’s financial system can be blamed partly on naïvely reductionist economics and misapplied simplistic statistics. The temptation among ‘normal’ scientists is to work as if their material is as simple as in the lab. If nothing else, that is the path to a steady stream of publications, on which a scientific career now so critically depends. The most obvious effect of this style is the proliferation of computer simulations, which give the appearance of solved puzzles even when neither data nor theory provide much support for the precision of their numerical outputs. Under such circumstances, a refined appreciation of uncertainty in results is inhibited, and even awareness of quality of workmanship can be atrophied.
In the course of the development of climate-change science, all sorts of loose ends were left unresolved and sometimes unattended. Even the most fundamental quantitative parameter of all, the forcing factor relating the increase in mean temperature to a doubling of CO2, lies somewhere between 1 and 3 degrees, and is thus uncertain to within a factor of 3. The precision (at about 2%) in the statements of the ‘safe limits’ of CO2 concentration, depending on calculations with this factor, is not easily justified. Also, the predictive power of the global temperature models has been shown to depend more on the ‘story line’ than anything else, the end-of century increase in temperature ranging variously from a modest one degree to a catastrophic six. And the ‘hockey stick’ picture of the past, so crucial for the strict version of the climate change story, has run into increasingly severe problems. As an example, it relied totally on a small set of deeply uncertain tree-ring data for the Medieval period, to refute the historical evidence of a warming then; but it needed to discard that sort of data for recent decades, as they showed a sudden cooling from the 1960’s onwards! In the publication, the recent data from other sources were skilfully blended in so that the change was not obvious; that was the notorious ‘Nature trick’ of the CRU e-mails.
Even worse, for the warming case to have political effect, a mere global average rise in temperature was not compelling enough. So that people could appreciate the dangers, there needed to be predictions of future climate - or even weather - in the various regions of the world. Given the gross uncertainties in even the aggregated models, regional forecasts are really beyond the limits of science. And yet they have been provided, with various degrees of precision. Those announced by the IPCC have become the most explosive.
As all these anomalies and unsolved puzzles emerged, the neat, compelling picture became troubled and even confused. In Kuhn’s analysis, this would be the start of a ‘pre-revolutionary’ phase of normal science. But the political cause had been taken up by powerful advocates, like Al Gore. We found ourselves in another crusading ‘War’, like those on (non-alcoholic) Drugs and ‘Terror’. This new War, on Carbon, was equally simplistic, and equally prone to corruption and failure. Global warming science became the core element of this major worldwide campaign to save the planet. Any weakening of the scientific case would have amounted to a betrayal of the good cause, as well as a disruption of the growing research effort. All critics, even those who were full members of the scientific peer community, had to be derided and dismissed. As we learned from the CRU e-mails, they were not considered to be entitled to the normal courtesies of scientific sharing and debate. Requests for information were stalled, and as one witty blogger has put it, ‘peer review’ was replaced by ‘pal review’.
Even now, the catalogue of unscientific practices revealed in the mainstream media is very small in comparison to what is available on the blogosphere. Details of shoddy science and dirty tricks abound. By the end, the committed inner core were confessing to each other that global temperatures were falling, but it was far too late to change course. The final stage of corruption, cover-up, had taken hold. For the core scientists and the leaders of the scientific communities, as well as for nearly all the liberal media, ‘the debate was over’. Denying Climate Change received the same stigma as denying the Holocaust. Even the trenchant criticisms of the most egregious errors in the IPCC reports were kept ‘confidential’. And then came the e-mails.
We can understand the root cause of Climategate as a case of scientists constrained to attempt to do normal science in a post-normal situation. But climate change had never been a really ‘normal’ science, because the policy implications were always present and strong, even overwhelming. Indeed, if we look at the definition of ‘post-normal science’, we see how well it fits: facts uncertain,values in dispute, stakes high, and decisions urgent. In needing to treat Planet Earth like a textbook exercise, the climate scientists were forced to break the rules of scientific etiquette and ethics, and to play scientific power-politics in a way that inevitably became corrupt. The combination of non-critical ‘normal science’ with anti-critical ‘evangelical science’ was lethal. As in other ‘gate’ scandals, one incident served to pull a thread on a tissue of protective plausibilities and concealments, and eventually led to an unravelling. What was in the e-mails could be largely explained in terms of embattled scientists fighting off malicious interference; but the materials ready and waiting on the blogosphere provided a background, and that is what converted a very minor scandal to a catastrophe.
Consideration of those protective plausibilities can help to explain how the illusions could persist for so long until their sudden collapse. The scientists were all reputable, they published in leading peer-reviewed journals, and their case was itself highly plausible and worthy in a general way. Individual criticisms were, for the public and perhaps even for the broader scientific community, kept isolated and hence muffled and lacking in systematic significance. And who could have imagined that at its core so much of the science was unsound? The plausibility of the whole exercise was, as it were, bootstrapped. I myself was alerted to weaknesses in the case by some caveats in Sir David King’s book The Hot Topic; and I had heard of the hockey-stick affair. But even I was carried along by the bootstrapped plausibility, until the scandal broke. (I have benefited from the joint project on plausibility in science of colleagues in Oxford and at the Arizona State University).
Part of the historic significance of Climategate is that the scandal was so effectively and quickly exposed. Within a mere two months of the first reports in the mainstream media, the key East Anglia scientists and the Intergovernmental Panel on Climate Change were discredited. Even if only a fraction of their scientific claims were eventually refuted, their credibility as trustworthy scientists was lost. To explain how it all happened so quickly and decisively, we have the confluence of two developments, one social and the other technical. For the former, there is a lesson of Post-Normal Science, that we call the Extended Peer Community. In traditional ‘normal’ science, the peer community, performing the functions of quality-assurance and governance, is strictly confined to the researchers who share the paradigm. In the case of ‘professional consultancy’, the clients and/or sponsors also participate in governance. We have argued that in the case of Post-Normal Science, the ‘extended peer community’, including all affected by the policy being implemented, must be fully involved. Its particular contribution will depend on the nature of the core scientific problem, and also on the phase of investigation. Detailed technical work is a task for experts, but quality-control on even that work can be done by those with much broader expertise. And on issues like the definition of the problem itself, the selection of personnel, and crucially the ownership of the results, the extended peer community has full rights of participation. This principle is effectively acknowledged in many jurisdictions, and for many policy-related problems. The theory of Post-Normal Science goes beyond the official consensus in recognising ‘extended facts’, that might be local knowledge and values, as well as unoffficially obtained information.
The task of creating and involving the extended peer community generally known as ‘participation’ has been recognised as difficult, with its own contradictions and pitfalls. It has grown haphazardly, with isolated successes and failures. Hitherto, critics of scientific matters have been relegated to a sort of samizdat world, exchanging private letters or writing books that can easily be ignored (as not being peer-reviewed) by the ruling establishment. This has generally been the fate of even the most distinguished and responsible climate-change critics, up to now. A well-known expert in uncertainty management, Jeroen van der Sluijs, explicitly condemned the ‘overselling of certainty’ and predicted the impending destruction of trust; but he received no more attention than did Nikolas Taleb in warning of the ‘fat tails’ in the probability distributions of securities that led to the Credit Crunch. A prominent climate scientist, Mike Hulme, provided a profound analysis in Why We Disagree About Climate Change, in terms of complexity and uncertainty. But since legitimate disagreement was deemed nonexistent, he too was ignored.
To have a political effect, the ‘extended peers’ of science have traditionally needed to operate largely by means of activist pressure-groups using the media to create public alarm. In this case, since the global warmers had captured the moral high ground, criticism has remained scattered and ineffective, except on the blogosphere. The position of Green activists is especially difficult, even tragic; they have been
‘extended peers’ who were co-opted into the ruling paradigm, which in retrospect can be seen as a decoy or diversion from the real, complex issues of sustainability, as shown by Mike Hulme. Now they must do some very serious re-thinking about their position and their role.
The importance of the new media of communications in mass politics, as in the various ‘rainbow revolutions is well attested. To understand how the power-politics of science have changed in the case of Climategate, we can take a story from the book Here Comes Everybody by Clay Shirkey. There were two incidents in the Boston U.S.A. diocese of the Roman Catholic Church, involving the shuffling of paeodophile priests around parishes. The first time, there was a criminal prosecution, with full exposure in the press, and then nothing happened. The second time, the outraged parents got on their cell phones and organised; and eventually Cardinal Archbishop Bernard Francis Law (who had started as a courageous cleric in the ‘60’s) had to leave for Rome in disgrace. The Climategate affair shows the importance of the new IT for science, as an empowerment of the extended peer community.
The well-known principle, ‘knowledge is power’ has its obverse, ‘ignorance is impotence’. And ignorance is maintained, or eventually overcome, by a variety of socio-technical means. With the invention of cheap printing on paper, the Bible could be widely read, and heretics became Reformers. The social activity of science as we know it expanded and grew through the age of printing. But knowledge was never entirely free, and the power-politics of scientific legitimacy remained quite stable for centuries. The practice of science has generally been restricted to a social elite and its occasional recruits, as it requires a prior academic education and a sufficiency of leisure and of material resources. With the new information technology, all that is changing rapidly. As we see from the ‘open source’ movement, many people play an active role in enjoyable technological development in the spare time that their job allows or even encourages. Moreover, all over IT there are blogs that exercise quality control on the industry’s productions. In this new knowledge industry, the workers can be as competent as the technicians and bosses. The new technologies of information enable the diffusion of scientific competence and the sharing of unofficial information, and hence give power to peer communities that are extended far beyond the Ph.D.s in the relevant subject-specialty. The most trenchant and effective critics of the ‘hockey stick’ statistics were a University-employed economist and a computer expert.
Like any other technology, IT is many-faceted. It is easily misused and abused, and much of the content of the blogosphere is trivial or worse. The right-wing political agendas of some climate sceptics, their bloggers and their backers, are quite well known. But to use their background or motivation as an excuse for ignoring their arguments, is a betrayal of science. The blogosphere interacts with other media of communication, in the public and scientific domains. Some parts are quite mainstream, others not. The Climategate blogosphere is as varied in quality as any other. Some leading scholars, like Roger Pielke, Jr. have had personal blogs for a long time. Some blogs are carefully monitored, have a large readership and are sampled by the mainstream media (such as the one on which this is posted, Wattsupwiththat.com). Others are less rigorous; but the same variation in quality can be found in the nominally peer-reviewed scientific literature. Keeping up with the blogosphere requires different skills from keeping up with traditional literature; it is most useful to find a summarising blog that fits one’s special interests, as well as a loyal correspondent, as (in my case) Roger ‘tallbloke’ Tattersall.
Some mainstream publications are now saying nice things about the blogosphere. Had such sentiments been expressed a while ago, the critical voices might have had a public hearing and the Climategate scandal might have been exposed before it became entrenched so disastrously. And now the critical blogosphere does not need to be patronised. Like any extension of political power, whether it be the right to believe, to protest, to vote, to form trades unions, or to be educated, it can lead to instabilities and abuses. But now the extended peer community has a technological base, and the power-politics of science will be different. I cannot predict how it will work out, but we can be confident that corruptions built on bootstrapped plausibility will be less likely in the future.
There is an important philosophical dimension to Climategate, a question of the relation of personal scientific ethics to objective scientific facts. The problem is created by the traditional image of science (as transmitted in scientific education) as ‘value-free’. The personal commitments to integrity, that are necessary for the maintenance of scientific quality, receive no mention in the dominant philosophy of science. Kuhn’s disenchanted picture of science was so troubling to the idealists (as Popper) because in his ‘normal’ science criticism had hardly any role. For Kuhn, even the Mertonian principles of ethical behaviour were effectively dismissed as irrelevant. Was this situation truly ‘normal’ - meaning either average or (worse) appropriate? The examples of shoddy science exposed by the Climategate convey a troubling impression. From the record, it appears that in this case, criticism and a sense of probity needed to be injected into the system by the extended peer community from the (mainly) external blogosphere.
The total assurance of the mainstream scientists in their own correctness and in the intellectual and moral defects of their critics, is now in retrospect perceived as arrogance. For their spokespersons to continue to make light of the damage to the scientific case, and to ignore the ethical dimension of Climategate, is to risk public outrage at a perceived unreformed arrogance. If there is a continuing stream of ever more detailed revelations, originating in the blogosphere but now being brought to a broader public, then the credibility of the established scientific authorities will continue to erode. Do we face the prospect of the IPCC reports being totally dismissed as just more dodgy dossiers, and of hitherto trusted scientists being accused of negligence or worse? There will be those who with their own motives will be promoting such a picture. How can it be refuted?
And what about the issue itself? Are we really experiencing Anthropogenic Carbon-based Global Warming? If the public loses faith in that claim, then the situation of science in our society will be altered for the worse. There is very unlikely to be a crucial experience that either confirms or refutes the claim; the post-normal situation is just too complex. The consensus is likely to depend on how much trust can still be put in science. The whole vast edifice of policy commitments for Carbon reduction, with their many policy prescriptions and quite totalitarian moral exhortations, will be at risk of public rejection. What sort of chaos would then result? The consequences for science in our civilisation would be extraordinary.
To the extent that the improved management of uncertainty and ignorance can remedy the situation, some useful tools are at hand. In the Netherlands, scholars and scientists have developed ‘Knowledge Quality Assessment’ methodologies for characterising uncertainty in ways that convey the richness of the phenomenon while still performing well as robust tools of analysis and communication. Elsewhere, scholars are exploring methods for managing disagreement among scientists, so that such post-normal issues do not need to become so disastrously polarised. A distinguished scholar, Sheila Jasanoff, has called for a culture of humility among scientists, itself a radical move towards a vision of a non-violent science. Scientists who have been forced to work on the blogosphere have had the invaluable experience of exclusion and oppression; that could make it easier for them to accept that something is seriously wrong and then to engage in the challenging moral adventures of dealing with uncertainty and ignorance. The new technologies of communications are revolutionising knowledge and power in many areas. The extended peer community of science on the blogosphere will be playing its part in that process. Let dialogue commence!

