Jan 18, 2010
Get ready for seven-foot sea level rise as climate change melts ice sheets
Rob Young and Orrin Pilkey for Yale Environment 360, part of the Guardian Environment Network
The reports from the Intergovernmental Panel on Climate Change (IPCC) are balanced and comprehensive documents summarizing the impact of global warming on the planet. But they are not without imperfections, and one of the most notable was the analysis of future sea level rise contained in the latest report, issued in 2007.
Given the complexities of forecasting how much the melting of the Greenland and West Antarctic ice sheets will contribute to increases in global sea level, the IPCC chose not to include these giant ice masses in their calculations, thus ignoring what is likely to be the most important source of sea level rise in the 21st century. Arguing that too little was understood about ice sheet collapse to construct a mathematical model upon which even a rough estimate could be based, the IPCC came up with sea level predictions using thermal expansion of the oceans and melting of mountain glaciers outside the poles. Its results were predictably conservative - a maximum of a two-foot rise this century - and were even a foot lower than an earlier IPCC report that factored in some melting of Greenland’s ice sheet.
The IPCC’s 2007 sea level calculations - widely recognized by the academic community (Yeah, WHERE???) as a critical flaw in the report - have caused confusion among many in the general public and the media and have created fodder for global warming skeptics. But there should be no confusion about the serious threat posed by rising sea levels, especially as evidence has mounted in the past two years of the accelerated pace of melting of the Greenland and West Antarctic ice sheets.
Most climate scientists believe melting of the Greenland Ice Sheet will be one of the main drivers of sea level rise during this century.
The message for the world’s leaders and decision makers is that sea level rise is real and is only going to get worse. Indeed, we make the case in our recent book, The Rising Sea, that governments and coastal managers should assume the inevitability of a seven-foot rise in sea level. This number is not a prediction. But we believe that seven feet is the most prudent, conservative long-term planning guideline for coastal cities and communities, especially for the siting of major infrastructure; a number of academic studies examining recent ice sheet dynamics have suggested that an increase of seven feet or more is not only possible, but likely. Certainly, no one should be expecting less than a three-foot rise in sea level this century.
In the 20th century, sea level rise was primarily due to thermal expansion of ocean water. Contributions of melting mountain glaciers and the large ice sheets were minor components. But most climate scientists now believe that the main drivers of sea level rise in the 21st century will be the melting of the West Antarctic Ice Sheet (a potential of a 16-foot rise if the entire sheet melts) and the Greenland Ice Sheet (a potential rise of 20 feet if the entire ice cap melts). The nature of the melting is non-linear and is difficult to predict.
Seeking to correct the IPCC’s failure to come up with a comprehensive forecast for sea level increase, a number of state panels and government committees have produced sea level rise predictions that include an examination of melting ice sheets. For example, sea level rise panels in Rhode Island and Miami-Dade County have concluded that a minimum of a three- to five-foot sea level rise should be anticipated by 2100. A California report assumes a possible 4.6-foot rise by 2100, while the Dutch assume a 2.5-foot rise by 2050 in the design of their tidal gates.
Given the growing consensus about the major sea level rise on the way in the coming century or two, the continued development of many low-lying coastal areas - including much of the U.S. east coast - is foolhardy and irresponsible.
Rising seas will be on the front lines of the battle against changing climate during the next century. Our great concern is that as the infrastructure of major cities in the industrialized world becomes threatened, there will be few resources left to address the dramatic impacts that will be facing the citizens of the developing world.
Pacific and Indian Ocean atoll nations are already being abandoned because of the direct and indirect effects of sea level rise, such as saltwater intrusion into groundwater. In the Marshall Islands, some crops are being grown in abandoned 55-gallon oil drums because the ground is now too salty for planting. New Zealand is accepting, on a gradual basis, all of the inhabitants of the Tuvalu atolls. Inhabitants of Carteret Atoll have all moved to Papua, New Guinea. The forward-looking government of the Maldives recently held a cabinet meeting underwater to highlight the ultimate fate of their small island nation.
The world’s major coastal cities will undoubtedly receive most of the attention as sea level rise threatens infrastructure. Miami tops the list of most endangered cities in the world, as measured by the value of property that would be threatened by a three-foot rise. This would flood all of Miami Beach and leave downtown Miami sitting as an island of water, disconnected from the rest of Florida. Other threatened U.S. cities include New York/Newark, New Orleans, Boston, Washington, Philadelphia, Tampa-St Petersburg, and San Francisco. Osaka/Kobe, Tokyo, Rotterdam, Amsterdam, and Nagoya are among the most threatened major cities outside of North America.
Preserving coastal cities will require huge public expenditures, leaving smaller coastal resort communities to fend for themselves. Manhattan, for example, is likely to beat out Nags Head, North Carolina for federal funds, a fact that recreational beach communities must recognize when planning a response to sea level rise.
Twelve percent of the world’s open ocean shorelines are fronted by barrier islands, and a three-foot sea level rise will spell doom for development on most of them - save for those completely surrounded by massive seawalls.
Impacts in the United States, with a 3,500-mile long barrier island shoreline extending from Montauk Point on Long Island to the Mexican border, will be huge. The only way to preserve the barrier islands themselves will be to abandon them so that they may respond naturally to rising sea level. Yet, most coastal states continue to allow massive, irresponsible development of the low-lying coast.
Ironically, low-elevation Florida is probably the least prepared of all coastal states. Hundreds of miles of high rises line the state’s shoreline, and more are built every year. The state pours subsidies into coastal development through state-run insurance and funding for coastal protection. If a portion of those funds were spent adapting to sea level rise rather than ignoring it, Florida might be ready to meet the challenge of the next century. Let’s hope the state rises to the challenge.
Despite the dire facts, the next century of rising sea level need not be an economic disaster. Thoughtful planning can lead to a measured retreat from vulnerable coastal lowlands. We recommend the following:
Immediately prohibit the construction of high-rise buildings and major infrastructure in areas vulnerable to future sea level rise. Buildings placed in future hazardous zones should be small and movable - or disposable.
Relocation of buildings and infrastructure should be a guiding philosophy. Instead of making major repairs on infrastructure such as bridges, water supply, and sewer and drainage systems, when major maintenance is needed, go the extra mile and place them out of reach of the sea. In our view, no new sewer and water lines should be introduced to zones that will be adversely affected by sea level rise in the next 50 years. Relocation of some beach buildings could be implemented after severe storms or with financial incentives.
Stop government assistance for oceanfront rebuilding. The guarantee of recovery is perhaps the biggest obstacle to a sensible response to sea level rise. The goal in the past has always been to restore conditions to what they were before a storm or flood. In the United States, hurricanes have become urban renewal programs. The replacement houses become larger and larger and even more costly to replace again in the future. Those who invest in vulnerable coastal areas need to assume responsibility for that decision. If you stay, you pay.
After years of reluctance, scientists and governments are now looking to adaptation measures as critical for confronting the consequences of climate change. And increasingly, plans are being developed to deal with rising seas, water shortages, spreading diseases, and other realities of a warming world.
Local governments cannot be expected to take the lead. The problems created by sea level rise are international and national, not local, in scope. Local governments of coastal towns (understandably) follow the self-interests of coastal property owners and developers, so preservation of buildings and maintaining tax base is inevitably a very high priority. In addition, the resources needed to respond to sea level rise will be far beyond those available to local communities.
Responding to long-term sea level rise will pose unprecedented challenges to the international community. Economic and humanitarian disasters can be avoided, but only through wise, forward-looking planning. Tough decisions will need to be made regarding the allocation of resources and response to natural disasters. Let us hope that our political leadership can provide the bold vision and strong leadership that will be required to implement a reasoned response. Read more of this ridiculous story here.
Icecap Note: Another “its far worse than even the IPCC thought” story. They did not mention James Hansen who a year ago claimed sea levels would rise 246 feet (important to be precise). Not his first wild forecast. In 1988 Hansen was discussing with an underling how the area around Columbia U would change in 20 years. He expected a lot more traffic because “traffic would be diverted because the major highway near the river would have flooded” The story has it he claimed it would rise 3 feet by 2008. Sea level has changed less than 1 inch.
Jan 16, 2010
Professional Discourtesy By The National Climate Data Center On The Menne Et Al 2010 paper
By Roger Pielke Sr., Climate Science
The professional courtesy when researchers collect data is to permit them first opportunity to publish. The National Institute of Health (NIH) has written up this policy. The NIH writes in their section on timeliness of data sharing
“Recognizing that the value of data often depends on their timeliness, data sharing should occur in a timely fashion. NIH expects the timely release and sharing of data to be no later than the acceptance for publication of the main findings from the final dataset.”
The NIH writes with respect to their grantees: “In general, grantees own the rights in data resulting from a grant-supported project.” NIH has just written down what is the professional courtesy with respect to data
In the case of the site data that Anthony Watts has collected at considerable effort on his part and that of his outstanding volunteers (see), the National Climate Data Center (NCDC) is not recognizing this professional courtesy. They already earlier have posted a (flawed) analysis of a subset of Anthony’s data (see). Simply recognizing Anthony’s pivotal role in identifying the current site characteristics of the USHCN sites, as listed in the Acknowledgements of the Menne et al (2009) paper (and the new JGR paper), is hardly adequate.
Despite the proper collegial approach to scientific interaction, and in contrast to the NIH policy, they have prematurely published a paper using a subset of the site classifications that Anthony has completed (and, moreover, the site classification data they used has not even gone through final quality assurance checks!) . They used only ~40% of the USHCN sites yet over 87% have actually been surveyed by Anthony’s volunteers.
The Editor who oversaw this paper is also to blame for the early appearance of this article. I was quite surprised to learn that despite the central role of Andrew Watt’s analysis in the paper, he was not asked to be a referee of the paper. This is inappropriate and suggests the Editor did not provide a balanced review process.
The new paper which analyzes a subset of the available site data is
Menne, M. J., C. N. Williams, and M. A. Palecki (2010): On the reliability of the U.S. Surface Temperature Record, J. Geophys. Res., doi:10.1029/2009JD013094, in press. (accepted 7 January 2010)
with the abstract
Recent photographic documentation of poor siting conditions at stations in the U.S. Historical Climatology Network (USHCN) has led to questions regarding the reliability of surface temperature trends over the conterminous U.S. (CONUS). To evaluate the potential impact of poor siting/instrument exposure on CONUS temperatures, trends derived from poor and well-sited USHCN stations were compared. Results indicate that there is a mean bias associated with poor exposure sites relative to good exposure sites; however, this bias is consistent with previously documented changes associated with the widespread conversion to electronic sensors in the USHCN during the last 25 years. Moreover, the sign of the bias is counterintuitive to photographic documentation of poor exposure because associated instrument changes have led to an artificial negative ("cool") bias in maximum temperatures and only a slight positive ("warm") bias in minimum temperatures. These results underscore the need to consider all changes in observation practice when determining the impacts of siting irregularities.
Further, the influence of non-standard siting on temperature trends can only be quantified through an analysis of the data. Adjustments applied to USHCN Version 2 data largely account for the impact of instrument and siting changes, although a small overall residual negative ("cool") bias appears to remain in the adjusted maximum temperature series. Nevertheless, the adjusted USHCN temperatures are extremely well aligned with recent measurements from instruments whose exposure characteristics meet the highest standards for climate monitoring. In summary, we find no evidence that the CONUS temperature trends are inflated due to poor station siting.”
We will discuss the science of the analysis in a subsequent post and a paper which is being prepared for submission. However, this post is about the process of compromising the standard scientific method, similar to what was revealed in several of the CRU e-mails. This same culture exists at NCDC under the direction of Tom Karl.
The publication of the Menne et al 2010 paper violates the professional courtesy that is standard practice by other scientific groups. We had even offered them co-authorship on our papers, so that we can benefit from their scientific expertise and they can benefit from ours. They refused.
This failure by NCDC to honor professional standards is just another example of the lack of accepted professional standards at this federal climate laboratory. They should have joined us in a paper, or, as an appropriate alternative, waited until we published and then complete their analysis.
See Roger’s post here.
Jan 15, 2010
Climategate: The Perils of Global Warming Models
By John Droz, Jr., Pajamas Media
Everyone readily admits that things aren’t always what they seem. But are we really applying this knowledge in our daily dealings? Are we consciously ferreting out the illusory from the reality? I think not.
For instance, despite overwhelming evidence to the contrary, we aren’t really being run by pandering politicians, self-serving lobbyists, fanatical environmentalists, and greedy Wall Street manipulators. They are the illusion.
There is another even more powerful (but much less visible) agent behind all of these puppets. The person behind the screen is the computer programmer. And, just like in the Wizard of OZ, they do not want you to look at this real controller.
I’ll probably have to turn in my membership card, but as a computer programmer (and physicist and environmental activist) I’m here to spill the beans about the Wiz. The first hint of trouble is spelled out in Wikipedia’s explanation about computer programmers:
The discipline differs from many other technical professions in that programmers generally do not need to be licensed or pass any standardized (or governmentally regulated) certification tests in order to call themselves “programmers” or even “software engineers.”
Hmmm.
My layperson explanation is that computer programming is all about making assumptions, and then converting these into mathematical equations. The big picture question is this: Is it really possible to accurately convert complex real-world situations into ones and zeros? Hal may think so, but higher processing brains say no. Yet this is continuously attempted, with very limited success. Let’s pull the screen back a bit more. We’ll start with an example about how such a model makes assumptions.
One of the computer programs I wrote was for debt collectors. A typical scenario was that a debtor was given a date to make a payment and the collection company didn’t receive it on time. What response is then appropriate? In such a circumstance the computer program typically makes an automatic contact with the debtor. (Remember there are thousands of these debtors, and it would be prohibitively time consuming for an agency person to manually check into and follow up each case.) So what to say in this correspondence to the debtor? Well, it comes down to the assumptions made by the computer programmer.
The programmer tries to simplify such situations into mathematical options. In this case they may decide that the question is: “Does the debtor have the money to make this payment: yes or no?” This relatively basic choice then leads to a Boolean progression within the program. How does the programmer (model) decide on yes or no? Well, other indicators would be used (e.g., were prior payments made on time) to come up with a statistical probability.
Of course, any computer model is not one set of choices, but rather a whole series of yes/no (if/or) calculations that lead to a conclusion. In a complex situation (e.g., debt collection, climate change, or financial derivatives) there could easily be a hundred such choices to deal with.
To understand the implications of that, let’s just consider the case where there are ten such decision points - each with a “yes” or “no” answer. At the end of such a pipeline, that means that there are 210 (i.e., 1024) possible results. That’s a lot of different potential conclusions.
Unfortunately, there are actually many more possibilities! The assumption that this debtor situation could be condensed down to a “yes” or “no” answer is not accurate. There are several other real situations that fall outside of “yes” or “no.” For instance, what if the debtor never got a notice in the first place that the amount was due by the date the agency is monitoring? Or what if the debtor sent the money and it got lost in transition? Or what if the debtor made the payment to the original person they owed, rather than the collection agency? Or what if the debtor sent in the money on time, and the collection agency incorrectly didn’t credit the debtor for the payment? Etc., etc.
For the computer program (model) to be accurate, all of these scenarios need to be able to be handled properly (legally, timely, etc.). Can you begin to see the complexity here, just with this very simple example of a payment not being received on time?
There is still another significant factor (we’re up to #4 now) not mentioned yet. What about the situation where the debtor hasn’t paid, but it’s because his child has MS, and he has no insurance? How does a computer programmer write code for more abstract concepts, like “fairness”? In other words, can ones and zeros be arranged in such a way to represent intangibles? I think not.
So the bottom line question is this: Is there any way that a computer program can correctly handle all of these real-world possibilities - even in this simple debt collection case? The answer is no. We have considerable difficulties just translating the relatively simple thing we call language - e.g., Greek biblical texts into English. How many versions of the Bible are there? Why isn’t there just one?
Can we possibly hope to translate a process much more complicated than just words? We can certainly try, but clearly the answer is that there is a lot lost in the translation of any complex scenario (debtors, energy performance, etc.) into mathematical equations and computer code.
Some uninformed parties believe that the user has control of all the variables, and can manually (and accurately) change scenarios. That is incorrect, as the user-controlled elements only represent a small fraction of the actual number of factors that are built into the computer model. A similar fallacy is to think something like “we know the assumptions that the programmers made, and are adjusting accordingly.” This is wrong.
In writing a computer program of any complexity, there are literally hundreds of assumptions made. The computer programmer does not reveal all these to his customer, for much the same reasons that an accountant does not tell his client all of the assumptions made in preparing a tax return. He goes over a few of the more basic items, and then says “sign here.”
Oh, yes, this example brings up still another major variable (#7): the data the programmer uses as the basis for his creation. Just like preparing a tax return depends on two parties working together, writing a computer model is a collaboration between scientist and programmer. If the taxpayer gives incomplete or inaccurate data to the accountant, the result will be wrong. What’s disconcerting is that in many cases, neither party will know that the results are in error.
Similarly if the scientist (inadvertently) gives incomplete or inaccurate data to the programmer to use in his creation, the result will likewise be wrong. And neither party will know it. There is still one more significant variable (#8) that we have to take into account. After a computer model is generated, there is an interpreter (e.g., IPCC) that translates the “results” for politicians and the public (i.e., the media).
Here’s a surprise: These public interpretations are influenced by such factors as political, religious, environmental, financial, and scientific opinions. In their public revelations, do the interpreters explain all of their underlying biases? By now you know the answer: absolutely not. When these are introduced into the equation we obviously have strayed so far from scientific fact that it is not even in sight anymore.
So we need to think very carefully before we take major actions (e.g., spend a few trillion dollars based on climate predictions, wind energy projected performance, etc.) that are almost entirely based on computer models. What to do? Should we just scrap all computer models? No, that’s the other extreme. Computer models have merit - but shouldn’t be the tail wagging the dog.
We should realistically see computer models for what they are - tools to assist us in organizing our thoughts, and producers of highly subjective results that are simply starting points for real scientific analysis. Because of their inherent limitations (which I’ve just touched on here) all computer models should be treated with a very healthy degree of skepticism.
To insure appropriate integrity, all computer models regarding matters of importance should be subjected to the rigors of scientific methodology. If they can’t accurately and continuously replicate the results of real-world data, then they should be discarded. Unfortunately, that is not what is happening. We have gotten so addicted to the illusion that these programs are accurate - and some have become so agenda driven - that we are now adjusting or discarding real-world data that doesn’t agree with the model. This is insane. If a model has not been proven to fully reflect reality, then it has very limited use and should be treated with the same degree of consideration that one might give a horoscope. See post here.
Jan 12, 2010
Central Park Temperatures - Still a Mystery
By Joseph D’Aleo
In Central Park Temperature - Three Radically Different Us Government Versions on Icecap in 2008 here, we noted some significant differences between the various NOAA versions for the stations.
The raw observations are taken from the stations then adjusted to account for local factors like site changes, changes in instrumentation, time of observation and at least at one time for urbanization in USHCN Version 1 (Karl 1988). Data sets are created for the US (USHCN) and NOAA global data bases (GHCN).
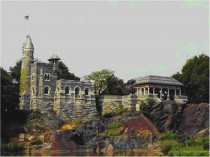
Historical Central Park observations were taken from the periphery of the park from 1909 to 1919 at the Arsenal Building 5th Ave (between 63rd & 64th) and then since 1920 at the Belvedere Castle on Transverse Rd (near 79th & 81st).
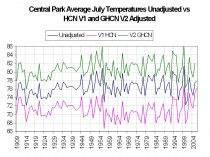
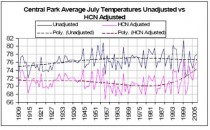
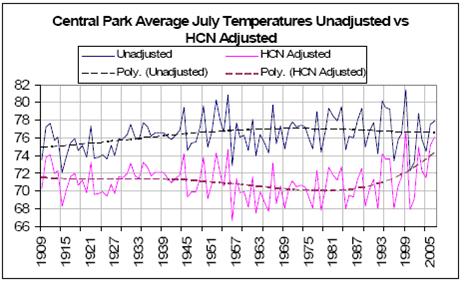
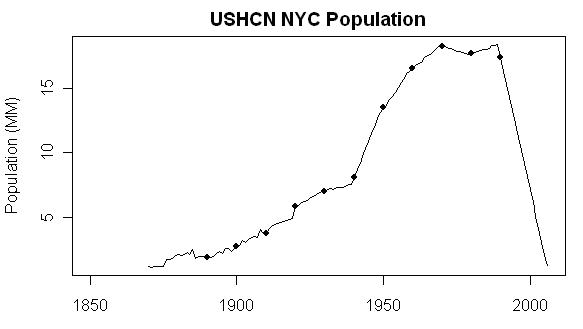
We found a surprisingly large difference from the NCDC United States USHCN version 1 and the NCDC global GHCN for that station (below, enlarged here).
The USHCN version 1 had an urban adjustment (Karl 1988) when it was introduced in 1990. The cooling was as 7F for July and 6F for January. Notice however as some state climatologists noticed, the annual adjustments began to diminish in 1999 and in version 2 of USHCN disappeared altogether (below, enlarged here).
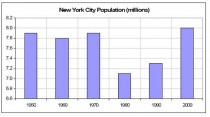
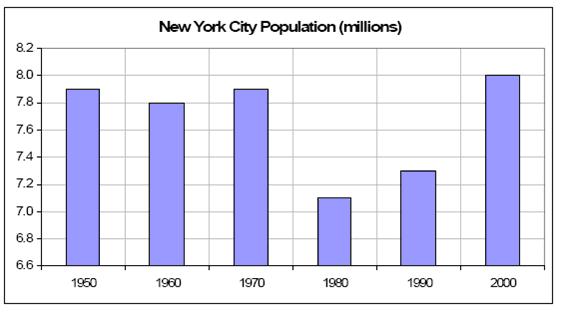
This led Steve McIntyre here to quip “If one reverse engineers this adjustment to calculate the New York City population used in the USHCN urban adjustment, the results are, in Per’s words, ‘gobsmacking’ (utterly astounding), even by climate science standards.” This was because, it could only be explained by a massive depopulation of New York City (below, enlarged here).
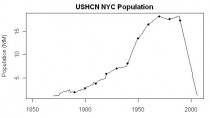
Shown clearly not the case (below, enlarged here).
The story doesn’t end there. The same NCDC maintains a global data base of station data used for climate change assessment called GHCN Version 2 of GHCN contains some of the same adjustments except for the Karl urban adjustment. Central Park is one of the GHCN sites. Note in the top graph above, it mysteriously warms not cools New York’s Central Park by 4F.
GISS USES GHCN AS UNADJUSTED DATA BEFORE HOMOGENIZATION
GISS recently eliminated GHCN with USHCN adjustments as one of the data access options here. “We no longer include data adjusted by GHCN”. They claim they start with GHCN ‘unadjusted’ before they work their own homogenization and other magical wonders.
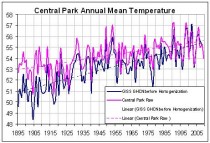
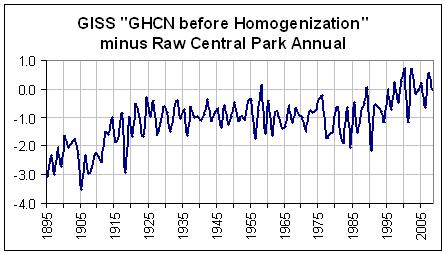
I downloaded the Central Park ‘unadjusted’ GHCN data from GISS and did a comparison of annual mean GHCN with the raw annual mean data downloaded from the NWS New York City Office web site here.
We found that the two data sets were not the same. For some unknown reason, Central Park was colder in the unadjusted data sets in the early record as much as 3F than the raw observation records. The difference gradually diminished so, currently the changes are small (2008 was the same). Some recent years the ‘unadjusted’ adjustments were inexplicably positive (below, enlarged here.
The difference is shown below, enlarged here.
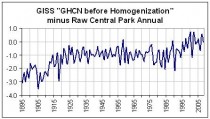
Thus in the so called unadjusted data, the warming (due to urbanization) is somehow increased from 2.5 to 4.5F.
E.M. Smith downloaded the latest iteration of GHCN Central Park directly from NOAA and found it had found its way back closer to the raw data. He notes there are many iterations of the data sets out there. The differences is them is much greater than the changes over time calling into question our ability to accurately assess climate trends. See his discussion here.
Jan 11, 2010
Freeze May Kill 60,000
By Stuart Winter and Kirsty Buchanan, Express UK
Update: Read more here on Britain’s early incredible winter.
As Britain’s winter of discontent threatened a fresh wave of blizzards and freezing temperatures last night, Gordon Brown stood accused of failing to protect the nation.

With up to 60,000 deaths predicted because of the relentless cold and the country’s major roads facing a gritting crisis, Downing Street was heavily criticised for the widespread chaos.
Conservative leader David Cameron slammed the lack of leadership at Number 10 - as the Prime Minister all but ignored the national crisis in a battle for his own political survival.
Mr Cameron said: “At times like these the country needs strong and united leadership. “We can’t go on with a Government that is more focused on its internal problems than trying to help people through difficult times, including some of the worst weather conditions the UK has experienced for years.” The Prime Minister last night admitted that for many people this was a “very serious, worrying and frustrating time”.
But he tried to play down the crisis in a podcast from Downing Street. The embattled Premier insisted gas supplies were not threatened and that everything was being done to keep the roads clear. But the winter of 2010 threatens to become one of the biggest civil crises in modern times.
Experts predict a massive spike in death rates - with up to 60,000 more people dying than average because of the wintry conditions. The British civilian death toll in the Second World War was 67,000. The economy also faces losses of up to 15billion pounds as millions of workers are forced to stay indoors because of the impact on the transport system.
The AA warned the country could expect “creeping paralysis” as grit stocks dwindle over the next two weeks. With no end to the snow and freezing temperatures in sight, the country is facing the prospect of its essential services being unable to function. Despite the efforts of tens of thousands of local authority workers, emergency services personnel and others, the superstructure necessary to cope with a prolonged deep freeze has been revealed to be inadequate.
Shadow Communities and Local Government Secretary Caroline Spelman called for an emergency statement in the Commons as Britain braced itself for a second week of Arctic weather. She said: “I think the Government should voluntarily make a statement to the House on Monday. The statement will have to be made in the Commons. I think what is difficult for local government is that confusion reigns.”
The Conservatives last night accused Labour of sitting on a report for five months which outlined a new strategy for tackling extreme winter weather conditions. Commissioned in the wake of the February 2009 cold snap, the report, by the UK Roads Liaison Group, was completed in July but not produced in the House until December 15 - two days before the big freeze struck. Miss Spelman said that Transport Secretary Lord Adonis could lose his job. She said: “I think he is in danger. It is cheap currency to say a government minister should go, but he should get a grip on the situation and sort it out but he is a bit late into the game.”
Plunging Arctic temperatures and high energy bills have created the “perfect storm” to send winter mortality rates to appallingly high levels. The persistent snow and frost make the elderly far more vulnerable to killer diseases such as pneumonia and bronchitis and also more susceptible to strokes and heart attacks.
Charities are calling for a major shake-up in the way the elderly are helped to survive. It is estimated as many as one in three pensioner households are spending more than 10 per cent of their income on energy bills - the official definition of fuel poverty. As many comparisons are being made between the winter of 2010 and the Big Freeze of ‘63, a look back at official Government statistics reveals that there were more than 89,000 excess deaths that year.
Andrew Harrop, head of public Policy at Age Concern and Help the Aged, said: “It is shocking that there are more older people dying in winter compared to the rest of the year in England than countries with more severe weather such as Sweden and Finland. We are concerned that prolonged cold weather and high energy bills could create the perfect storm for hard-up older people this winter, causing hardship, illness and isolation.”
A spokesman for the Local Government Association said: “For older people freezing temperatures pose a very real danger, and sadly there is a risk of people dying unnecessarily. It would be a tragedy if any person was to die this winter because they kept their heating down because they feared a bill they could not afford.”
Tory shadow health spokesman Mike Penning said: “I was in my local accident and emergency unit recently and there were elderly people suffering from falls and hypothermia who are frightened to turn up the heating because they don’t want to be in debt.”
This weather pattern is deeply entrenched, say experts, raising the prospect of a prolonged freeze to rival the notorious winters of 1963 and 1947. Read more here.
|

