Last week’s storm already caused flooding in South Florida and knocked out electricity for more than 85,000 customers in the Carolinas on Friday. On Saturday, it dropped 16 inches of snow on Reagan National Airport outside Washington - the most ever recorded there for a single December day since snowfall records began in 1884. The storm total snowfall of 16.4 inches of snowfall on December 18-19, 2009 marks the 6th highest two-day snowfall record for Washington, DC, putting it just below the president/s day storm in 2003 and ahead of the January 1996 storm. For the month so far...a total of 16.6 inches of snow has been recorded at DCA. This makes it the snowiest December on record for Washington DC (previous record was 16.2 in 1962).
Not far away in Baltimore, the 20.5 inches of snow measured yesterday will go down as the fifth highest daily snowfall on any calendar day at Baltimore since snowfall records began in 1893. The storm total snowfall of 21.0 inches of snowfall on December 18-19, 2009 marks the 6th highest two-day snowfall record for Baltimore. For the month so far...a total of 22.2 inches of snow has been recorded at BWI. This makes it the snowiest December on record for Baltimore (previous record was 20.4 inches in 1966).
It was the second heaviest snowfall ever for Philadelphia. The 23.2 inches of snow that fell during the nor’easter in Philadelphia is the second highest snowfall for any single event ever. The record still is 30.7 inches set during the January Blizzard in 1996.
The mayors of Washington and Philadelphia and the governors of Virginia, West Virginia, Kentucky, Maryland and Delaware all declared states of emergency.
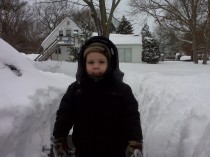
In New York City, Central Park reported 10.9 inches of snow and NY JFK airport 14.2 inches. It was much heavier on Long Island where many locations received over 20 inches. On Long Island, a record maximum single storm snowfall set at Brookhaven National Laboratory...The final snowfall total for the blizzard at Brookhaven National Laboratory in Upton NY was 26.3 inches. This sets a new record maximum single storm snowfall for the lab. The old record was 23.0 inches...set during the blizzard of February 1978. Records have been kept at the lab since 1949.
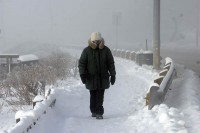
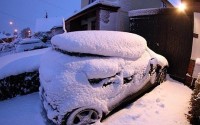
Snow in eastern Long Island. Boy age 2 deep in snow.
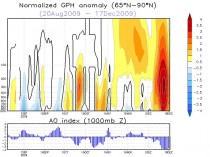
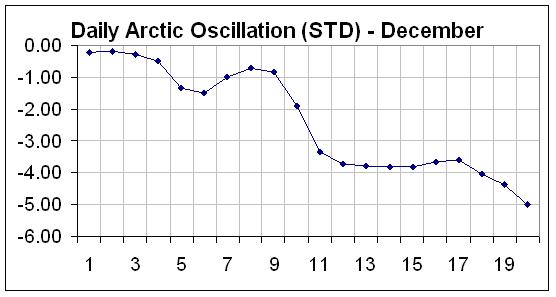
The storm was in part due to the active southern storm track typical of El Nino and a very anomalous arctic oscillation related to that polar mid-tropospheric to stratospheric warming we wrote about a few weeks back. Here is an updated view of that cross section.
(above, enlarged here) Note the warming in red corresponds to the dip to off the chart in the AO graph just under the cross section.
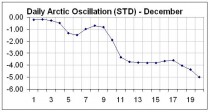
The daily AO (above, enlarged here) has dropped to an amazing 5 standard deviations negative (-5.6 STD today, the lowest in December since records began in 1950 and at levels similar to December 1976 - that year in Mid January dropped to below -7.6 STD). An increasingly negative AO is what caused the cold to dump into the US, Europe, Siberia and China. A major tanking of the AO is often accompanied by a major snowstorm in winter.
Big freeze kills at least 80 across Europe
The death toll from winter storms across Europe rose to at least 80 on Monday as transport chaos spread amid mounting anger over the three-day failure of Eurostar high-speed trains. With tens of thousands stranded by the cancellation of London-to-Paris trains and hundreds of flights across the continent, new accidents and mass power cuts added to the big freeze tumult.
A car veered off an icy road and knocked concrete onto rails, derailing a Paris commuter train and injuring 36 people, police said. Three hundred people had to be evacuated from the train. Another train in the Croatian capital Zagreb hit a buffer injuring 52 people. Croatian investigators blamed the minus 17 degrees Celsius (1.4 Fahrenheit) temperatures for a brake failure, national television reported. European temperatures as low as minus 33.6 degrees Celsius (minus 28.5 Fahrenheit) have been recorded in Bavaria.
In Poland, authorities said 42 people, many of them homeless, had died of cold over three days after temperatures plunged to minus 20 degrees Celsius (minus four Fahrenheit). Ukraine reported 27 deaths while six people were killed in accidents in Germany and three in Austria. France has reported at least two deaths of homeless people, and the national power company briefly cut electricity to two million people on Monday saying it was necessary to avoid an even bigger blackout amid surging demand.
More flights were cancelled in France, Germany, the Netherlands, Portugal and Spain and main highways were blocked across Europe where some regions had more than 50 centimetres (20 inches) of snow. The breakdown of the Eurostar service under the Channel, linking London with Paris and Brussels, has symbolised Europe’s suffering. After the nightmare of more than 2,000 people stuck in the tunnel when five trains broke down Friday, tens of thousands more people have missed trains cancelled since then, with Eurostar announcing a “restricted” service for Tuesday.
Air traffic was again badly hit as temperatures remained glacial: minus 20 degrees Celsius in Sibiu in Romania, where more than 50 centimetres of snow fell, and minus seven Celsius in Venice, Italy. Seven hundred people spent the night on camp beds at Amsterdam-Schipol airport and more flights were cancelled after dozens were grounded Sunday. The Dutch rail network was also badly hit with the railway company advising commuters to stay at home. Heavy snowfall led to more delays and cancellations at Frankfurt and Duesseldorf airports in Germany, where more than 500 flights were cancelled or redirected on Sunday. Twenty percent of flights out of Paris-Charles de Gaulle were cancelled Monday. The main RER commuter train line running east to west across the Paris region has been out of action for 12 days because of a strike. Spanish civil aviation authorities said 174 flights from Madrid-Barajas airport were called off. Flights from Lisbon to Madrid were among those hit while main roads in northern Portugal were cut by snow. Brussels airport also reported cancellations and delays. After more snow falls on Moscow, authorities sent out 13,000 dump trucks to clear the streets as chronic traffic jams built up. In Britain, more airport delays hit passengers while snow forced the postponement of Wigan’s English Premier League football match against Bolton Wanderers. See story here. See earlier BBC story here.
See snowcover spike this past week in the Northern Hemisphere. It will dip down again as brief warming and rains erode away some of the snow in unusual places but should bounce again in January.
Climate Progress’s Joe Romm says the massive weekend snowstorm in the East was exactly what alarmist climate scientists said would happen: “In any case, I have previously discussed the scientific literature, which makes clear that we have seen an increase in intense precipitation in this country, just as climate science predicted we would.”
But as the Washington Examiner’s David Freddoso reminds us, a year ago Robert F. Kennedy, Jr., wrote about the global warming-caused lack of precipitation in the DC area: “Recently arrived residents in the northern suburbs, accustomed to today’s anemic winters, might find it astonishing to learn that there were once ski runs on Ballantrae Hill in McLean, with a rope tow and local ski club. Snow is so scarce today that most Virginia children probably don’t own a sled...”
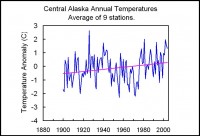
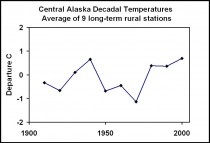
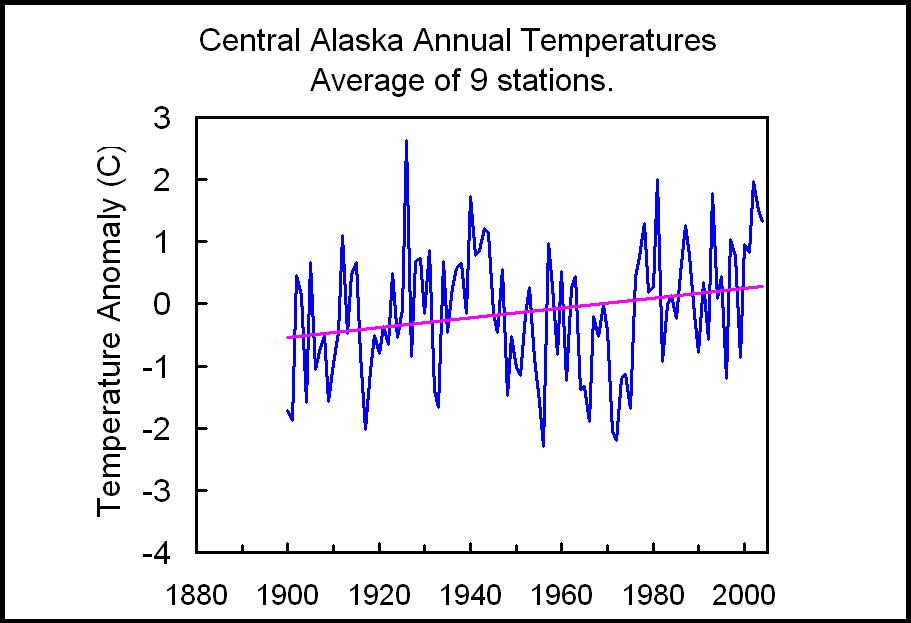
I recently completed a study of central Alaska’s climate. For this study I computed the average annual temperature for nine long-term Alaskan stations (and station combinations), which are: Eagle/Dawson, Ft. Yukon/Central, Fairbanks University, McKinley Park, Talkeetna, Gulkana / Kennecott / Chitina / McCarthy, Yakutat, Cordova, and Valdez. Then I averaged the nine stations for a regional mean (below, enlarged here). The data source was NCDC.
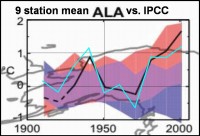
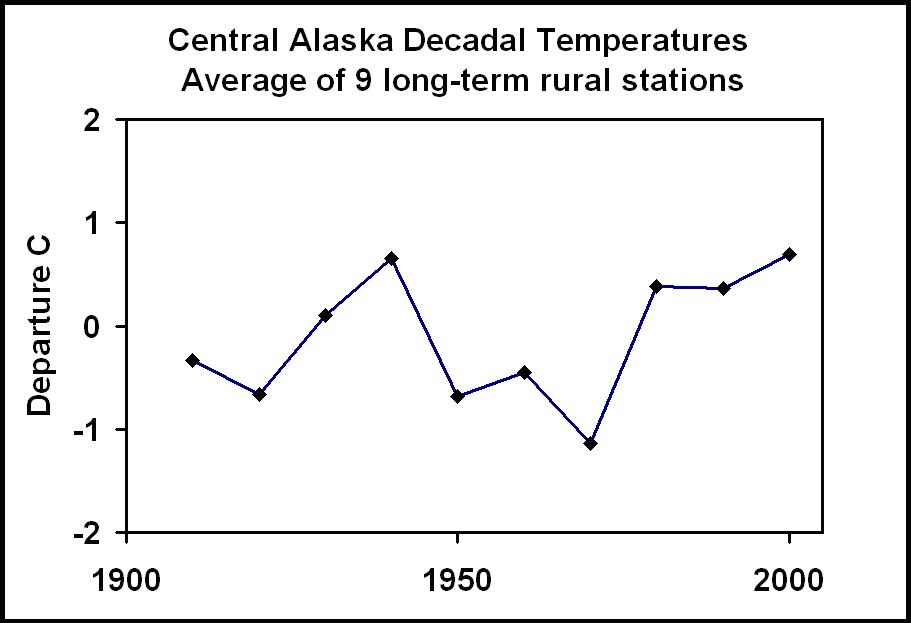
For comparison with the IPCC thumbnail for Alaska (I hope you can find an enlarged version of this), I replotted the regional temperatures as ten-year averages (below, enlarged here).
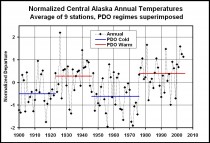
My averages show that the past three decades have shown no warming (since the PDO shift in 1977), and are in fact no warmer than the 1935-1944 decade. This is very different from the IPCC which shows a substantial warming over the past three decades. See the plot of annual versus the PDO stages (below enlarged here).
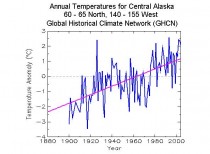
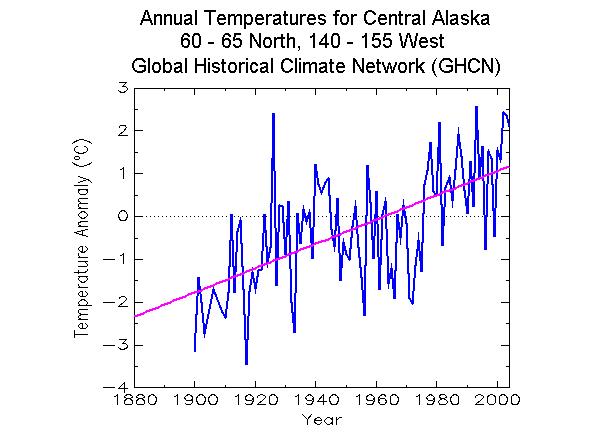
The annual values on the next plot clearly show the dominance of the PDO in Alaskan climate. Next is a graph of the GHCN annual temperatures for the same region. The GHCN data is dominated by an upward trend. My analysis gives an upward linear trend of 0.69 C/century (due to starting during a cold PDO and ending during a warm PDO), while the GHCN trend is 2.83 C/century - over 2 degrees larger!
Here is a blow up of the IPCC graph for Alaska (below, enlarged here.)
My study and the GHCN use the same stations, because there are no other long-term stations in the regions. I applied no “corrections” beyond offsets used when combining two or more stations with overlapping records (no other adjustments were warranted). One can only guess what “corrections” were applied to the GHCN and IPCC data sets, but I can easily guess their magnitude - about 1 degree. Curiously, the magnitude of the adjustments is about the same as the “global warming” signal of the past century.
I’d be interested if other readers can provide similar comparisons with other parts of the world.
---------------------------
Critique Of NCAR Cherry Picking Temperature Record Study Dr. Richard Keen, University of Colorado
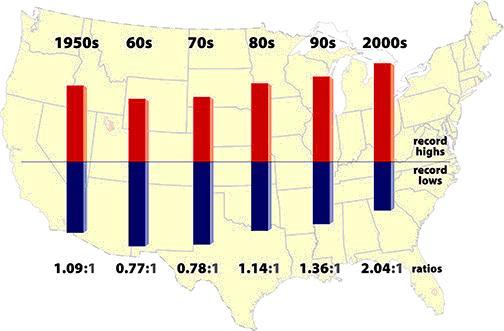
Icecap Note: This is a follow-up to the posting now in Cold Storage below, on the NCAR Meehl etal study of record highs and lows that cherry-picked the starting year as 1950. The following is a graphic representation of the study from the UCAR website (below, enlarged here):
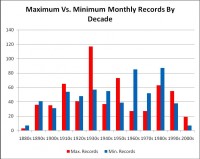
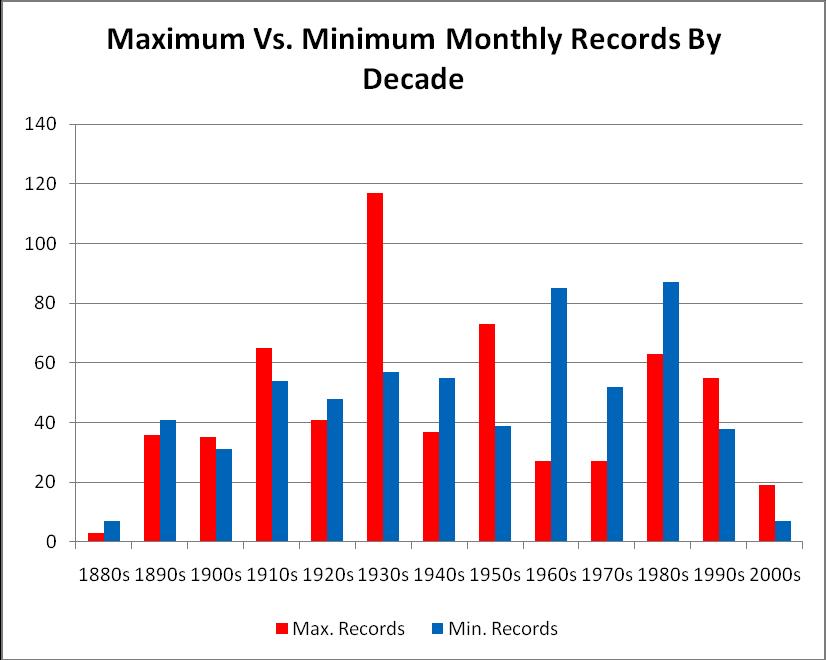
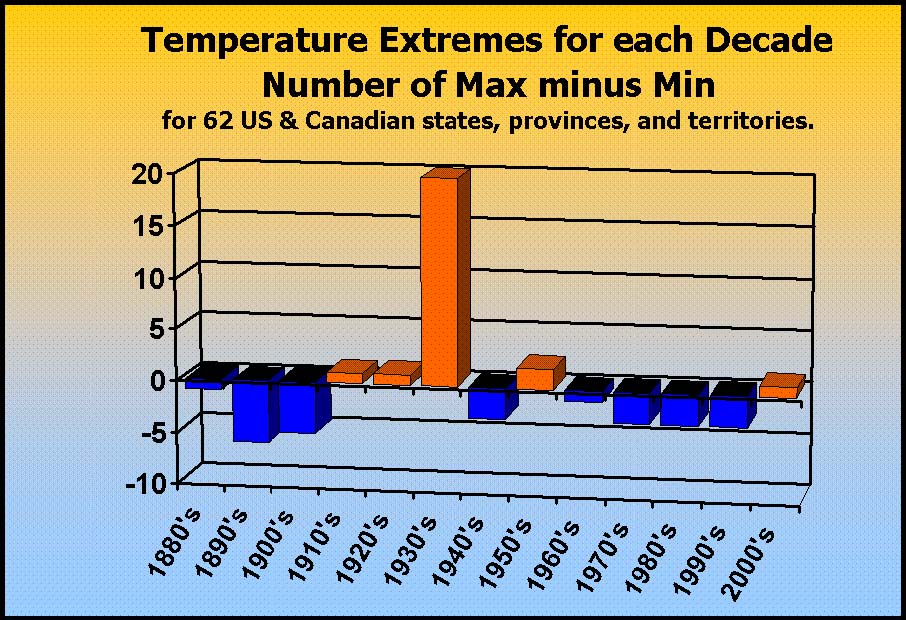
Bruce Hall did an analysis and follow-up. He extended the time period back to the start of the century and found the 1930 had a much higher frequency of maximum temperature extremes than the 1990s or 2000s or the combination of the last two decades (below, enlarged here).
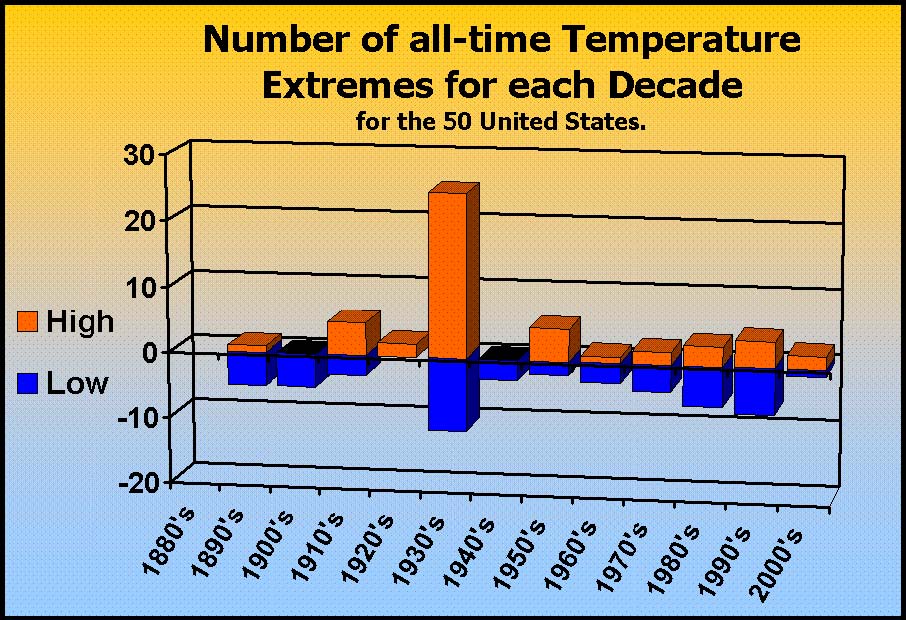
Dr. Richard Keen of the University of Colorado provided evidence from the western parts of the US and Canada supporting Bruce’s findings (below, enlarged here).
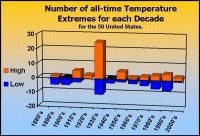
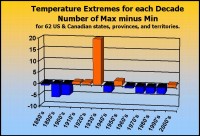
There were links also to WUWT, World Climate Report studies as well. Here below, Dr. Keen follows up his analysis expanding to all of the US and Canadian provinces and territories and shows there is no warming trend the last century.
Thanks for posting my chart of Western US and Canadian extreme temperature records by decade. I’m sure that by now the usual suspects have accused us of picking all of their cherries by showing only the western half of North America. Therefore, I spent the evening creating more charts for all 50 US states and 12 Canadian provinces and territories (excluding Nunavut, which was part of the Northwest Territories until recently).
I’m sending charts for the US, for Canada, and for the two combined. They tell the same story that my earlier Western North American graph showed, but more dramatically! MORE THAN HALF of the state and provincial maximum temperature records were set during the single decade of the 1930’s, and only 29 percent of these records were set since 1950. This means that by considering temperatures after 1950, Meehl et al. removed most of the really good heat records from the data pool, and artificially inflated the number of maximum temperature records (and thus, the max to min ratio). In other words, many of the maximum temperature records since 1950 would not be daily records for the entire period of record for these stations.
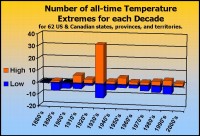
Meehl et al. calculate the max-to-min record ratio for each decade, but the difference (max MINUS min) is more illustrative (and not influenced by choice of denominator). That chart clearly shows the dominance of maximum temperature records during the 1930’s, and that since then most decades have had more minimum records set, and since 1940 minimum records have outnumbered maximum records by a ratio of 3 to 2 (or 1.5 to 1, if you prefer). Meehl et al. achieved opposite ratios by removing the extremes of the 1930’s.
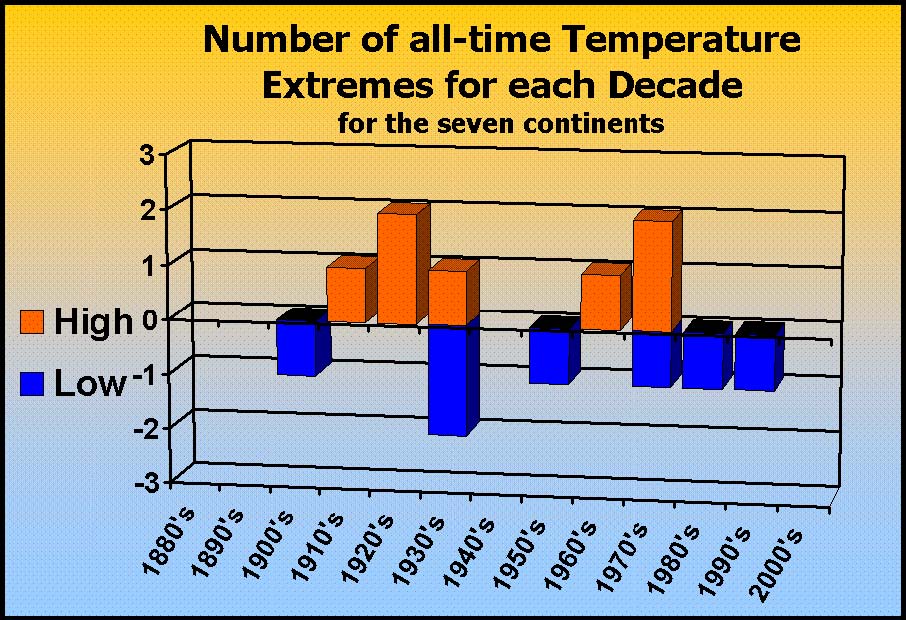
No doubt the cherry pickers will note that although most of North American is included in this analysis (and not just the US), I deftly left out the Yamal Peninsula, which, as we all know, is the true key to global climate. So I’ve created one more graph - a tally of the records for the seven continents, including Asia, which includes Siberia, where the Yamal Peninsula resides. What’s it show? Since 1950, 3 maximum and 4 minimum records have been set for the continents, a fairly even break.
Finally, although I consider linear trend lines somewhat useless and occasionally deceptive, I plotted those for each graph. In all cases, the trend line is virtually indistinguishable from the zero-value axis, so it is not shown. The bottom line is that if one wishes to express climate change by the varying number of temperature extremes, there has been no climate change for over 100 years.
Met Office to re-examine 160 years of climate data By Ben Webster, Times Online
The Met Office plans to re-examine 160 years of temperature data after admitting that public confidence in the science on man-made global warming has been shattered by leaked e-mails.
The new analysis of the data will take three years, meaning that the Met Office will not be able to state with absolute confidence the extent of the warming trend until the end of 2012.
The Met Office database is one of three main sources of temperature data analysis on which the UN’s main climate change science body relies for its assessment that global warming is a serious danger to the world. This assessment is the basis for next week’s climate change talks in Copenhagen aimed at cutting CO2 emissions.
The Government is attempting to stop the Met Office from carrying out the re-examination, arguing that it would be seized upon by climate change sceptics.
The Met Office works closely with the University of East Anglia’s Climatic Research Unit (CRU), which is being investigated after e-mails written by its director, Phil Jones, appeared to show an attempt to manipulate temperature data and block alternative scientific views.
The Met Office’s published data showing a warming trend draws heavily on CRU analysis. CRU supplied all the land temperature data to the Met Office, which added this to its own analysis of sea temperature data.
Since the stolen e-mails were published, the chief executive of the Met Office has written to national meteorological offices in 188 countries asking their permission to release the raw data that they collected from their weather stations.
The Met Office is confident that its analysis will eventually be shown to be correct. However, it says it wants to create a new and fully open method of analysing temperature data.
The development will add to fears that influential sceptics in other countries, including the US and Australia, are using the controversy to put pressure on leaders to resist making ambitious deals for cutting CO2.
The UN’s Intergovernmental Panel of Climate Change admitted yesterday that it needed to consider the full implications of the e-mails and whether they cast doubt on any of the evidence for man-made global warming. Read post here.
Icecap Note: How are they planning to deal with the ‘lost’ data. See also how they say it will be three years to assess the degree of warming. They are going into this assuming warming will be found, not unbiased. Note also how Brown and his party object to the 3 year study as they know, they wont be around in 3 years. See here how Brown and in the US the equally clueless Markey are heavily vested in action on global warming are attacking skeptics for actions to derail Copenhagen. It has the smell of panic and desparation.
It is crucial that scientists are factually accurate when they do speak out, that they ignore media hype and maintain a clinical detachment from social or other agendas. There are facts and data that are ignored in the maelstrom of social and economic agendas swirling about Copenhagen.
Greenhouse gases and their effects are well-known. Here are some of things we know:
• The most effective greenhouse gas is water vapor, comprising approximately 95 percent of the total greenhouse effect.
• Carbon dioxide concentration has been continually rising for nearly 100 years. It continues to rise, but carbon dioxide concentrations at present are near the lowest in geologic history.
• Temperature change correlation with carbon dioxide levels is not statistically significant.
• There are no data that definitively relate carbon dioxide levels to temperature changes.
• The greenhouse effect of carbon dioxide logarithmically declines with increasing concentration. At present levels, any additional carbon dioxide can have very little effect.
We also know a lot about Earth temperature changes:
• Global temperature changes naturally all of the time, in both directions and at many scales of intensity.
• The warmest year in the U.S. in the last century was 1934, not 1998. The U.S. has the best and most extensive temperature records in the world.
• Global temperature peaked in 1998 on the current 60-80 year cycle, and has been episodically declining ever since. This cooling absolutely falsifies claims that human carbon dioxide emissions are a controlling factor in Earth temperature.
• Voluminous historic records demonstrate the Medieval Climate Optimum (MCO) was real and that the “hockey stick” graphic that attempted to deny that fact was at best bad science. The MCO was considerably warmer than the end of the 20th century.
• During the last 100 years, temperature has both risen and fallen, including the present cooling. All the changes in temperature of the last 100 years are in normal historic ranges, both in absolute value and, most importantly, rate of change.
Contrary to many public statements:
• Effects of temperature change are absolutely independent of the cause of the temperature change.
• Global hurricane, cyclonic and major storm activity is near 30-year lows. Any increase in cost of damages by storms is a product of increasing population density in vulnerable areas such as along the shores and property value inflation, not due to any increase in frequency or severity of storms.
• Polar bears have survived and thrived over periods of extreme cold and extreme warmth over hundreds of thousands of years - extremes far in excess of modern temperature changes.
• The 2009 minimum Arctic ice extent was significantly larger than the previous two years. The 2009 Antarctic maximum ice extent was significantly above the 30-year average. There are only 30 years of records.
• Rate and magnitude of sea level changes observed during the last 100 years are within normal historical ranges. Current sea level rise is tiny and, at most, justifies a prediction of perhaps ten centimeters rise in this century.
The present climate debate is a classic conflict between data and computer programs. The computer programs are the source of concern over climate change and global warming, not the data. Data are measurements. Computer programs are artificial constructs.
Public announcements use a great deal of hyperbole and inflammatory language. For instance, the word “ever” is misused by media and in public pronouncements alike. It does not mean “in the last 20 years,” or “the last 70 years.” “Ever” means the last 4.5 billion years.
For example, some argue that the Arctic is melting, with the warmest-ever temperatures. One should ask, “How long is ever?” The answer is since 1979. And then ask, “Is it still warming?” The answer is unequivocally “No.” Earth temperatures are cooling. Similarly, the word “unprecedented” cannot be legitimately used to describe any climate change in the last 8,000 years.
There is not an unlimited supply of liquid fuels. At some point, sooner or later, global oil production will decline, and transportation costs will become insurmountable if we do not develop alternative energy sources. However, those alternative energy sources do not now exist.
A legislated reduction in energy use or significant increase in cost will severely harm the global economy and force a reduction in the standard of living in the United States. It is time we spent the research dollars to invent an order-of-magnitude better solar converter and an order-of-magnitude better battery. Once we learn how to store electrical energy, we can electrify transportation. But these are separate issues. Energy conversion is not related to climate change science.
I have been a reviewer of the last two IPCC reports, one of the several thousand scientists who purportedly are supporters of the IPCC view that humans control global temperature. Nothing could be further from the truth. Many of us try to bring better and more current science to the IPCC, but we usually fail. Recently we found out why. The whistleblower release of e-mails and files from the Climate Research Unit at East Anglia University has demonstrated scientific malfeasance and a sickening violation of scientific ethics.
If the game of Russian roulette with the environment that Adrian Melott contends is going on, is it how will we feed all the people when the cold of the inevitable Little Ice Age returns? It will return. We just don’t know when. Read more here.
A discussion of the November 2009 Climatic Research Unit e-mail hacking incident, referred to by some sources as “Climategate,” continues against the backdrop of the abortive UN Climate Conference in Copenhagen (COP15) discussing alternative agreements to replace the 1997 Kyoto Protocol that aimed to combat global warming.
The incident involved an e-mail server used by the Climatic Research Unit (CRU) at the University of East Anglia (UEA) in Norwich, East England. Unknown persons stole and anonymously disseminated thousands of e-mails and other documents dealing with the global-warming issue made over the course of 13 years.
Controversy arose after various allegations were made including that climate scientists colluded to withhold scientific evidence and manipulated data to make the case for global warming appear stronger than it is.
Climategate has already affected Russia. On Tuesday, the Moscow-based Institute of Economic Analysis (IEA) issued a report claiming that the Hadley Center for Climate Change based at the headquarters of the British Meteorological Office in Exeter (Devon, England) had probably tampered with Russian-climate data.
The IEA believes that Russian meteorological-station data did not substantiate the anthropogenic global-warming theory. Analysts say Russian meteorological stations cover most of the country’s territory, and that the Hadley Center had used data submitted by only 25% of such stations in its reports. Over 40% of Russian territory was not included in global-temperature calculations for some other reasons, rather than the lack of meteorological stations and observations.
The data of stations located in areas not listed in the Hadley Climate Research Unit Temperature UK (HadCRUT) survey often does not show any substantial warming in the late 20th century and the early 21st century.
The HadCRUT database includes specific stations providing incomplete data and highlighting the global-warming process, rather than stations facilitating uninterrupted observations.
On the whole, climatologists use the incomplete findings of meteorological stations far more often than those providing complete observations.
IEA analysts say climatologists use the data of stations located in large populated centers that are influenced by the urban-warming effect more frequently than the correct data of remote stations.
The scale of global warming was exaggerated due to temperature distortions for Russia accounting for 12.5% of the world’s land mass. The IEA said it was necessary to recalculate all global-temperature data in order to assess the scale of such exaggeration. In the IEA report there is a chart that shows that CRU’s selective use of 25% of the data created 0.64C more warming than simply using all of the raw data would have done. Given the huge area Russia represents, this significantly affects global land temperatures.
Global-temperature data will have to be modified if similar climate-date procedures have been used from other national data because the calculations used by COP15 analysts, including financial calculations, are based on HadCRUT research.
RIA Novosti is not responsible for the content of outside sources. Read story here. H/T Roger Pielke Sr. See PDF here.
ICECAP NOTE: recall it is in Soviet Union that the CRU, NOAA, NASA show the greatest warming. As this story implies, there was no obvious reason for these data centers to be selective about stations. It implies the stations often selected were urban and those with incomplete data, providing more opportuniuty for mischief.
See still more coverage here in the Daily Express.
---------------------------------
Extreme Cold Becoming Widespread - North America, China, Russia and Europe
Edmonton shatters cold record Edmonton Journal
Edmonton’s weather boasted two dubious distinctions Sunday: it was colder here than anywhere else in North America and it marked the coldest Dec. 13 in the city’s history. Environment Canada recorded a frigid minus 46.1 C (-51F), or minus 58.4 C with the wind chill, at the Edmonton International Airport at 5 a.m., said meteorologist Pierre Lessard. The old record of minus 36.1 C was set last year.
“To break a temperature by 10 degrees C (19F) is very exceptional,” said Lessard. The temperature record from Edmonton’s city centre was also broken Sunday, said meteorologist John McIntyre. Environment Canada recorded a temperature of minus 36.5 C downtown at 8 a.m. Sunday, beating the previous record for the day of minus 32.8 C in 1882, McIntyre said.
While Edmontonians may be wishing the weather gods would be a little less ambitious, there was at least one person in the city who could still see beyond the horrifying numbers on the thermometer. “(Sunday) it was beautiful with the hoar frost on all the trees and the light was really misty,” said Pamela Anthony, director of the Winter Light festival, a civic celebration of winter which launched last January and will run again from Jan. 6 to March 13 next year.
“It was almost cinematic. But it is hard to see if you are distracted by discomfort. The cold can be pretty intimidating. This is serious weather. You are a membrane of glass away from disaster and deep down, we all know it.”
But Edmonton is a winter city, and if last’s year launch was any indication, Edmontonians know how to embrace the cold and even thrive in it, she said. “Last year’s opening in January was very much like this. It was very cold. It was that it’s ‘too cold’ cold. We were so surprised that people came out and were cold with us.” People stuck it out in Churchill Square for a long time, taking in the outdoor blessing and watching artists perform before the event finally moved inside. “It was quite wonderful in that beautiful, odd Edmonton way,” Anthony said.
The city’s longest cold snap was in 1969 when the temperature never got warmer than -20 C for 26 consecutive days. The Journal handed out certificates to survivors.
Some flights scheduled to land at the Edmonton International Airport late Saturday night and early Sunday morning were diverted to Calgary because of the severe temperatures, said Edmonton International Airport spokeswoman Traci Bednard. There were some delays and a couple of cancellations for flights departing Edmonton as well on Sunday morning because of the cold, she said. “Different airlines and aircraft have different operating limits,” Bednard said.
The wait time for a tow truck in Edmonton on Sunday was 24 hours and eight hours for a light service call, said Alberta Motor Association spokesman Kent Dixon. The majority of light service calls have been for boosts, Dixon said. “Below -15 is when you should be plugging (your car) in. It’s absolutely necessary, it’s not a question,” he said. Even if people don’t plan on going outside in between parking cars in two heated garages, people should always dress for outside conditions, Dixon said. “It’s really severely cold out right now, and if, for whatever reason, you get stuck or have to wait in a vehicle or get out, you’re going to be thankful pretty quickly that you were dressed appropriately for outside temperatures,” Dixon said.
He recommends keeping a blanket and an emergency kit in all vehicles. “Act accordingly, be prepared and don’t put your safety at risk,” he said. See more here.
----------------------------
Delegates freeze as snow falls on global warming debates By Cathy Alexander, Sydney Morning Herald
World leaders will meet to tackle global warming - in the snow. The temperature in Copenhagen, where a landmark UN summit on climate change is taking place, is tipped to hit minus ten degrees Celsius this week. Snow is expected to start falling and continue through to the last day of the summit on Friday.
A white Christmas may please Denmark’s children but Copenhagen in the depths of winter is an odd setting to highlight the dangers of a warming world. Delegates from Africa, Asia and the Pacific are struggling with the freezing conditions. Some do not have the right clothes and are trying to minimise their time spent outside this week. Why UN organisers selected Copenhagen for the December summit remains a mystery. They might have had more success in drawing attention to the perils of hot weather if they had chosen Perth, where the temperature is forecast to reach 37 degrees this week, or Canberra where it will be 36.
A central issue at the summit is whether global warming should be limited to 1.5 degrees or 2 degrees. But some delegates are saying that Copenhagen in December might be more pleasant if it was about 15 degrees warmer. Copenhagen is also being criticised as the summit venue by delegates because it is very expensive. A cappuccino costs $A5, a beer at least $7, a small hot dog from a street stand $8, and a “cheap”, simple lunch dish can easily cost $30. Clothes are also expensive, making it difficult for delegates from the developing world to buy gear for the cold snap. Read more here.
Icecap Note: Over the next few weeks, very cold temperatures and snow will be in the news across southern Canada, the United States, Europe, the FSU and much of China. This was expected as a stratospheric warming event last few weeks led to building arctic high pressure now pressing south.
Today’s lows in Russia (degrees celsius), enlarged here.
Next Monday’s lows in China (degrees celsius), enlarged here.
Next Sunday’s lows in Europe (degrees celsius), enlarged here.
Last week was a truly memorable one too with a record breaking snow and cold outbreak. See summary of the many records set here.
-------------------------
See Mann throw Colleagues Under the Bus on WAPO By Roger Pielke Jr.
In today’s Washington Post, Michael Mann of Penn State University and CRU email fame, gives us some good news about climate science and some bad news about his colleagues.
The good news is that climate science in his view is not at all impeached by the release of the CRU emails.
The scientific consensus regarding human-caused climate change is based on decades of work by thousands of scientists around the world.
The bad news is that some of his colleagues exhibited “poor judgment”:
I cannot condone some things that colleagues of mine wrote or requested in the e-mails recently stolen from a climate research unit at a British university. . . Some statements in the stolen e-mails reflect poor judgment—for example, a colleague referring to deleting e-mails that might be subject to a Freedom of Information Act request—but there is no evidence that this happened. I doubt that Professor Mann will be getting many cheery Christmas cards from his CRU-email colleagues. See post and comments here.
------------------------
A Climategate Who’s Who
---------------------------
See Expert Videos Craig Idso, CO2 Science
As representatives of the nations of the world meet in Copenhagen to attempt to restrict the use of energy produced from coal, gas and oil in the guise of fighting global warming, many scientists and scholars are expressing grave concerns about what they are trying to do. Recognizing these concerns, we have posted a series of YouTube video vignettes in which such scientists and scholars present the reasons behind them.
We invite you to view the videos and do all you can to inform the public about their presence. Each of the videos can be accessed from the CO2 Science website, from the CO2Science YouTube channel , and other locations across the Internet, such as here. A categorized-list of the videos we have posted is presented on these sites. Wise decisions are made only when all pertinent aspects of an issue are examined. It is our sincere hope that the information presented in these videos will elucidate important truths that are presently ignored. See four posted videso with Dr. Lindzen, Dr. Soon, John Coleman and Joe D’Aleo on KUSI’s web site here.
See also audio interviews with many scientists on Its Rainmaking Time here.
-------------------------
Urban vs Rural in US
A comparison of data from urban and rural sites to see if there is an Urban Heat Effect. Data from NASA GISS. Graphs made with Microsoft Excel.
Odd things are going on at the Climate Research Unit at the University of East Anglia. Widely available data, existing in the public view for years, is now disappearing from public view.
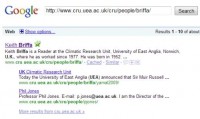
Google shows the link was once valid
For example this link to Keith Briffa’s Yamal data now redirects to a generic page of UEA. Try it yourself.
Now here is what that page says:
Climatic Research Unit
Due to the present high volume of visitors to this page, you will shortly be directed to the latest news about CRU on the main University of East Anglia website, or you can go there immediately by clicking on this link.
The cached page at Google is still available here, though none of the links to data or papers works there either.
I’ll point out that if indeed “traffic” is a concern, redirecting to another page on the UEA server system doesn’t do much for the load, it just moves it around. The data files are mostly text, and not that large, they don’t have that much more impact that some wab pages with graphics.
The news page that you get redirected to hasn’t much to say, and has not been updated since December 3rd. And it’s not just subfolders with data, it is the entire Climate Research Unit website that is shielded from public view. Try the main link which has been functional for years here.
In the last press release issued by UEA we read: “Professor Edward Acton, Vice-Chancellor said: “The reputation and integrity of UEA is of the upmost importance to us all.”
So now apparently, in this newly pledged period of “openness and transparency”, with the promise of releasing new data access, such as the Met office has done here
The access to important CRU data is simply denied? That’s a hell of a way to build public trust.
----------------------------
Tony Blair: The world must take action on climate change at Copenhagen even if the science is not correct By Louise Gray, in Copenhagen
Following the ‘climategate scandal’, Mr Blair said the science may not be “as certain as its proponents allege”. But he said the world should act as a precaution against floods, droughts and mass extinction caused by climate change, in fact it would be “grossly irresponsible” not to.
The first week of key UN negotiations on climate change saw clashes between the rich and poor world over the failure of countries like the US to commit to strict cuts in carbon dioxide. Later this week world leaders, including Gordon Brown and President Barack Obama, will arrive. Mr Blair admitted that the talks are “one of the toughest negotiations that international leaders will ever have been involved in.”
But despite sceptics claiming emails stolen from the University of East Anglia question the science, he said it was urgent to act now. “It is said that the science around climate change is not as certain as its proponents allege. It doesn’t need to be. What is beyond debate, however, is that there is a huge amount of scientific support for the view that the climate is changing and as a result of human activity,” he said.
“Therefore, even purely as a matter of precaution, given the seriousness of the consequences if such a view is correct, and the time it will take for action to take effect, we should act. Not to do so would be grossly irresponsible.” A new report from the ‘Breaking the Climate Deadlock Initiative’ found that the current commitments of rich countries would not be enough to stop global warming. But Mr Blair insisted that even a weak agreement would set the world on a path to a “low carbon future” by encouraging investment in green energy and he suggested a review every five years to toughen targets. Read more here and see more nonsense about the Precautionary Principle below.
----------------------------
The Precautionary Principle Run Amock By Harold Ambler, Talking About the Weather
In the December 9th New York Times, columnist Tom Friedman tells his readers that the precautionary principle demands that the world take aggressive action to curb the risks of damaging climate change, even if the likelihood of it is only one percent. To support his claim, he writes: “The evidence that our planet, since the Industrial Revolution, has been on a broad warming trend outside the normal variation patterns - with periodic micro-cooling phases - has been documented by a variety of independent research centers.”
Question: Does Tom Friedman know that the ocean-atmosphere system has been cooling since the Holocene Optimum?
Where to start?
Very few, if any, scientists contend that the beginning of the Industrial Revolution sparked a nearly instantaneous rise in temperatures. The rise in temperatures that most of the CRU scientists and most mainstream scientists consider to be non-normal is the one that began in 1975 and ended in 1998.
This is an important point, because although we did in fact start warming in approximately the year 1800, meaningful rises in CO2 would not occur for nearly a century and a half. Why did we begin warming in 1800? One answer is that it was time for the pendulum to swing back toward warm after the 550-year period known as the Little Ice Age. Internal dynamics and possibly solar variability likely brought our ocean-atmosphere system both into and out of the LIA.
The arguments about what falls within “normal,” temperature-wise and climate-wise, will continue for some time, largely because of reasonable disputes concerning tree-ring analysis. The tree-ring analysis that Michael Mann, Keith Briffa, Goddard Institute for Space Studies, and the Climatic Research Unit at the University of East Anglia all depend on to show the Modern Warm Period as troublingly pronounced is fraught with issues. Tree rings simply cannot be read with the omniscience they would require to provide a true record of temperature. Why not? Because individual trees growth is affected by too many variables: changing soil composition, changing numbers, of competitor trees in a stand, changing precipitation, changing levels of cloud, nearby volcanic eruptions (especially pertinent in Siberia from which many of the most significant tree-ring studies are drawn). This is only a partial list!
Tree-ring data, as a proxy for temperatures, will be laughed at within a generation. Some are laughing now.
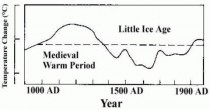
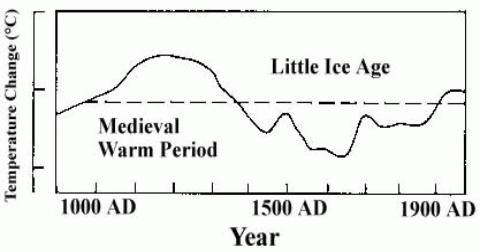
In the meantime, there is abundant evidence that the Medieval Warm Period lasted from roughly the year 1000 to the year 1300 and was warmer than today. Hundreds of articles produced by non-Big Oil funded scientists have confirmed the existence of, the worldwide character of, and the strength of the Medieval Warm Period (below by Lamb as seen in IPCC AR2, enlarged here).
Icecap Note: see confirmation of the MWP by 772 individual scientists from 458 separate research institutions in 42 different countries in the Medieval Warm Period project by CO2 Science here.
As Mr. Friedman insists that primarily (or only!) oil-funded science disputes the findings of global warming alarmism, perhaps he would like to name names? Or is this a conspiracy theory that cannot survive the light of day? In point of fact, the heroic scientists who look at climate with eyes that can see anything other than a disaster movie in the making generally do so at their career and financial peril. In the climate wars, Goliath is the scientists funded by governments (cashing checks worth billions). David is the important minority of scientists who have publication blocked by the antics described in the CRU e-mail release, who lose offices and tenure-track positions because of their heresy.
A final point. Not one climatologist questions that the decade just ended, touted as the warmest on record, is anywhere near as warm as the Holocene Optimum. (The Holocene interglacial, our quite gentle climatic nest, started 11,000 years ago.) The Holocene Optimum lasted from 8,000 to 5,000 years before present. The world ocean was higher; forests extended to the Arctic Ocean; sea level was at least a meter higher than today.
Why is a situation like the Holocene Optimum considered dangerous and out of control? Yet, we are not as warm as that now. And we may not get that warm again before the next Ice Age begins. If we do, why will intelligent men and women, many of them scientifically trained, believe that THIS TIME forests straining to move north toward the Arctic Ocean is part of a disaster movie, and last time it was a beautiful and Edenic part of nature?
As for the precautionary principle, it is wrongly applied here. As Bjorn Lomborg correctly points out, every dollar spent researching and “fighting” climate change is one less dollar that can be spent on something else. I, for one, would rather see clean-water systems installed in the Third World (and my own country, for that matter), before another 100 billion dollars are spent on computer modeling the effect of a trace atmospheric gas that has yet to generate a warming that exceeds the Holocene Optimum (and, likely, the Medieval Warm Period).
A comparison of data from urban and rural sites to see if there is an Urban Heat Effect. Data from NASA GISS. Graphs made with Microsoft Excel.
---------------------------
See Inhofe and Markey Clash over White House Copenhagen Agenda By Ben Geman, the Hill
Lawmakers at opposite poles of the congressional climate fight on Sunday offered diverging views of President Barack Obama’s right to pledge U.S. emissions cuts at the Copenhagen talks, and whether EPA regulation is inevitable if Congress doesn’t approve climate legislation.
Sen. James Inhofe (R-Okla.) said Obama should not proceed with his plan to offer a provisional U.S. emissions reduction target at the international talks. U.S. officials are floating a domestic cut of 17 percent by 2020 from 2005 levels, mirroring leading Democratic plans on Capitol Hill.
“The president can’t do that,” Inhofe said on “Fox News Sunday.” “The emissions reductions he has talked about are what you would find in Markey’s bill, and that isn’t going to happen. Of course that bill is dead, it will never even be brought up again.”
Inhofe, who calls global warming a “hoax,” debated Rep. Ed Markey (D-Mass.), who helms the Select Committee on Energy Independence and Global Warming. Markey co-sponsored the sweeping energy and climate bill the House narrowly approved in June.
Markey defended the White House right to offer a provisional U.S. emissions target at the talks, which are aimed at crafting a broad - though preliminary - international accord on climate change. Read more of the clueless Markey arguing with Inhofe over the future of legislation or regulation here.
-----------------------------
Copenhagen Commentary By David Warren, Ottawa Citizen
A good question for today would be whether a fraud on the scale of the one being consummated at the Copenhagen “Earth summit” has even been attempted before in human history. I’ve been trying to think of examples. Things like the fake Protocols of the Elders of Zion come to mind—a hoax out of Russia around the turn of the last century. It has been very consequential in the lives of Jews, and remains an issue in most Middle Eastern countries today, where state media continue to present this most vicious of all anti-Semitic slurs as historical fact.
But it is different from the “anthropogenic global warming” myth. It was published with murderous intentions, which takes us beyond fraud. Whereas, the numbers cooked up to support the global warming hysteria in such places as the Climate Research Unit at the University of East Anglia were for the purpose of extorting money, which is fraud in the more conventional sense.
This “man-made crisis” is the successor to many previous environmental scares, each designed as a means to shake down western taxpayers, and justify the creation of huge, intrusive, national and international bureaucracies for the benefit of their sponsors. One thinks of everything from the pioneering DDT scare of the early 1960s, forward—including the various Club of Rome forecasts from the 1970s, and even the “global cooling” scare of the previous generation, now conveniently buried in the mists of the world before Google.
Older readers will remember how we were going to run out of oil in the 1980s, among other commodities; or perhaps the “population bomb keeps ticking” mantra. And then there was “nuclear winter,” quite distinct from the impending Ice Age forecast, and successor to it. It has become harder to remember the profligate United Nations and other institutional efforts to mobilize planetary missions against these imaginary threats.
As these frauds have been perpetrated by largely the same class of people, each environmental scare has benefited from experience gained in publicizing the previous one, through supine liberal media. “Environmentalism” has moreover ballooned since the fall of the Berlin Wall, as the Reds of this world, defeated in the ambition to impose socialism directly, have turned Green in pursuit of the same end: the creation of an international command economy, under their own “expert” direction.
One might consider “private enterprise” frauds in passing—the great Ponzi schemes of history, from that of Charles Ponzi himself to the more recent efforts of Bernard Madoff. But at a mere $50 billion, this last and largest remains miniscule compared with “public sector” achievements. Consider the unfunded liabilities of all Western “social insurance” schemes—countless trillions of dollars owing in what have been, in accounting terms, very plain Ponzi schemes, made legal only because governments were doing it.
But there again, fraud requires active, conscious planning, not simply a general decay of moral and intellectual standards. The politicians who created the “welfare states” seldom had any clear idea what they were doing; and neither, really, did the generations of “Keynesian” economists who were advising them.
So the answer is probably no, nothing quite compares. Copenhagen takes the prize, for consummating the biggest fraud in history—a vast scheme of financial appropriation, premised upon rogue science, from tainted research. This conclusion has become irresistible after the exposure of thousands of e-mails and other documents, revealing the heart of the enterprise: the creation of convenient climate models from massaged numbers, after discarding raw data to make the findings uncheckable.
But what began as a method to extort research money has spread—through successive world political jamborees at Rio, Kyoto, and now Copenhagen—into something out of all proportion to conventional fraud. Parasitical vested interests (including now the organized kleptocracies of the Third World) have been assembled on such a colossal scale, that even the revelation of the original fraud can do nothing to break their momentum; any more than the 31,000-plus signatures of dissenting scientists on a U.S. petition last year could convince the media that there is no scientific consensus whatever behind the “anthropogenic global warming” propaganda.
The very premise is ludicrous: demonizing carbon dioxide as a “pollutant,” when it is a vital part of the Earth’s atmosphere, absolutely essential not only to plant life but everything that depends on plants.
This week, the U.S. Environmental Protection Agency, under the usual radical Obama appointment (Lisa P. Jackson), did something that could be fairly described as insane. It declared carbon dioxide and five other benign atmospheric “greenhouse gases” to be threats to public health, thus awarding itself extraordinary regulatory power over the entire economy, beyond reach of the U.S. Congress. Yet this is only one of innumerable strange and unnatural acts, being performed under the veil of Copenhagen.


.jpg)