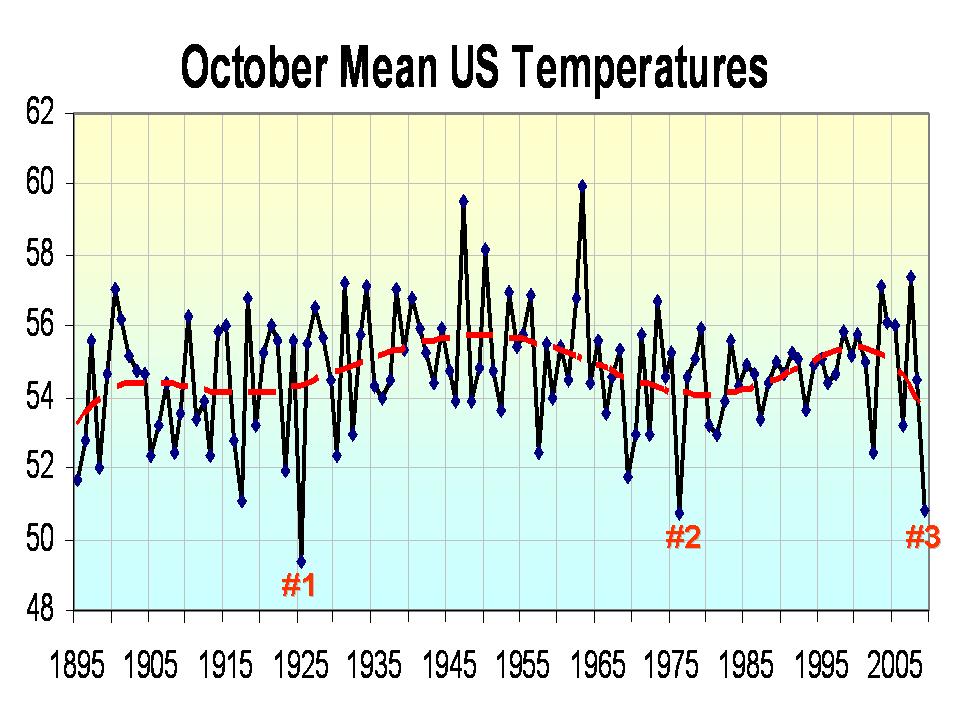
NCDC has compiled the October temperatures and it ended up the 3rd coldest in 115 years and the all-time wettest as well (see their analysis here). As we have shown it was cold over almost all the lower 48. Indeed only Florida came in above normal. Wet conditions were also widespread.
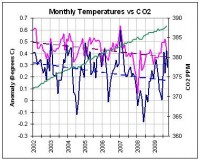
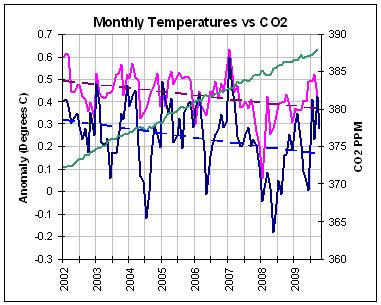
Also the University of Alabama global temperature is out and it is down this month. Hadley came in late for September but it was down. The trends since 2002 continue down for both even as CO2 rise.
The cold came just a few months after a cold July where 6 states were coldest in 115 years, four 2nd coldest and two 3rd coldest. See in this analysis on World Climate Report, how the first 10 months of the year followed a similar drop as 2008.
US was not alone. In the Southern Hemisphere, New Zealand had the coldest October in 64 years. Hat tip: Rod Van Koughnet, geophysicist and skeptic.
Temperatures may pop globally with the second surge in El Nino the next two months. A warm pool (depression of the thermocline) induced by a westerly wind burst last month with a negative Southern Oscillation Index has been pressing east. A prior surge had produced a first peak in El Nino in July. It weakened after with a cooling of the water in the eastern Pacific as the first warm surge was mixed out and cold water upwelling increased off South America. The same thing will happen after the El Nino comes to a second larger peak in early December. Typically in cold PDO phases, El Ninos, are truncated - that is they end early and tend to be weaker (up to moderate strength). See the similarity to other years in this post here.
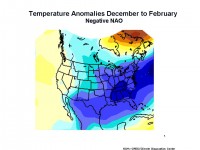
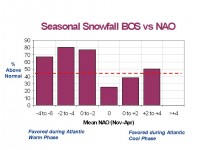
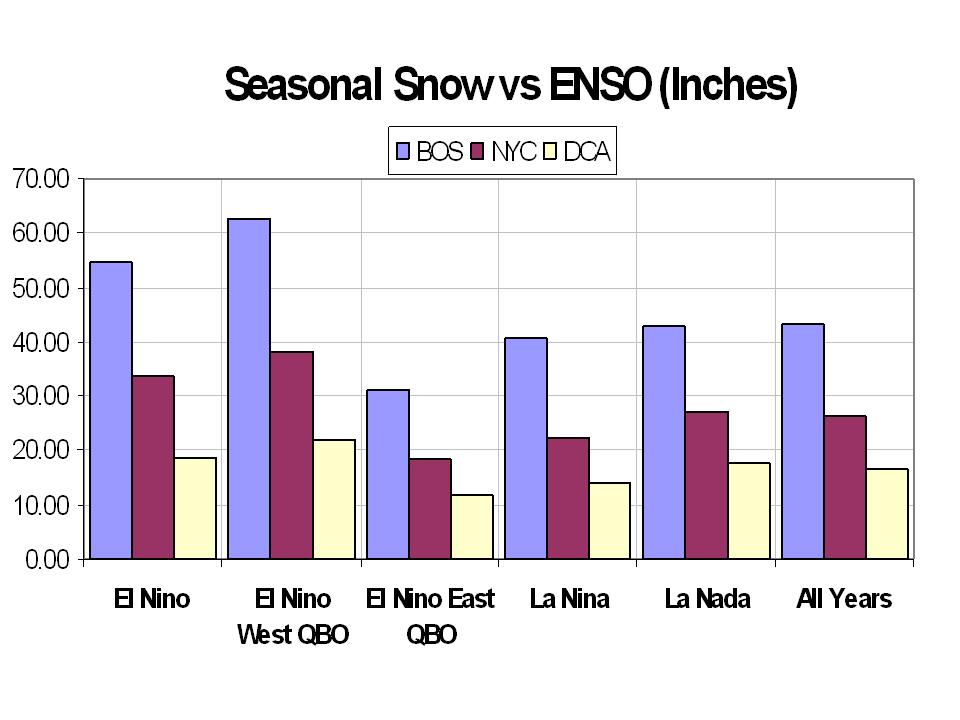
When you look at other years in cold PDO with a quiet sun and transition to an easterly QBO (Quasi-Biennial Oscillation) you get a cold winter especially in the east.
A stratospheric warming is more likely in these conditions, favoring high latitude blocking and cold air intrusions. We have seen much more blocking this year in part due to El Nino, in part to low solar and in part to high latitude volcanoes (Redoubt and Sarychev). See how a negative North Atlantic Oscillation (NAO) and Arctic Oscillation (AO) correlate with winter temperatures.
Big east coast storms for DC, New York or Boston are very likely in westerly QBO winters but not easterly. Since we will be transitioning from west to east, one might think we may still manage a few decent coastal storms and maybe a blockbuster, if the cold comes early and the QBO is slow to flip. Often in easterly winters, the snow is actually heavier south (like Norfolk).
The Scientific Alliance Newsletter of November 6, 2009
On 19th October, Gordon Brown made a high-profile speech on climate change policy to the Major Economies Forum in London. As a lead-in to the Copenhagen conference in December, this was widely reported in terms such as ‘50 days to save the world’. Of course, the Prime Minister did not exactly say that, but headline writers did not have to get too carried away to derive this from the actual statement: ‘In every era there are one or two moments when nations come together and reach agreements that make history because they change the course of history, and Copenhagen must be such a time. There are now fewer than 50 days to set the course for the next few decades, so as we convene here we carry great responsibilities, and the world is watching.’
In the language of international summitry, this is still pretty eye-catching, so it is perhaps interesting to analyse some of the rest of the speech, which makes the case for how vital it is to reach an agreement in Copenhagen.
‘If we do not reach a deal over the next few months, let us be in no doubt, since once the damage from unchecked emissions growth is done, no retrospective global agreement in some future period can undo that choice. By then it will be irretrievably too late, so we should never allow ourselves to lose sight of the catastrophe we face if present warming trends continue.’
This statement takes it as read that the assumptions on which the various climate models are built are unquestionably right. In reality, the key assumption in all of the models is that there is a positive feedback mechanism which enhances the actual relatively modest warming effect of additional atmospheric carbon dioxide. This is by no means proven, and there are equally plausible hypotheses which suggest that negative feedback mechanisms dominate. The reference to ‘present warming trend’ is also misleading. It is now generally accepted that there has been no warming for a decade. There is indeed a positive warming trend if the starting point is taken as the mid-70s, but this is far less evident if the baseline is the mid-30s. Trends depend on start and end points.
‘Only last week we saw new evidence of the rapid loss of Arctic Sea ice.’
Another misleading statement. Arctic sea ice varies to a very large extent from season to season. 2007 saw the largest summer loss in recent times, but 2008 was less extreme, and 2009 saw greater coverage again. Even the real drivers of these changes are not known, despite the glib assertions that the Arctic ice is sure evidence of human interference with the climate. Almost certainly ocean currents, wind patterns and sea temperature have a greater impact than air temperatures, and there is no clear evidence that any changes are driven primarily by carbon dioxide levels.
‘In just 25 years the glaciers in the Himalayas, which provide water for three-quarters of a billion people could disappear entirely. IPCC estimates tell us now that by 2080 an extra 1.8 billion people - equal to a quarter of the world’s current population - could be living and dying without enough water.’
Note the use of the conditional: ‘could’. This estimate comes from models using recent measurements for melt rate and precipitation together with assumptions for future emissions and consequent direct effects on surface temperatures and indirect effects on weather patterns. This is a worst case scenario, reliant on the all-important positive feedback assumption. There are already far too many people living with inadequate water supplies, because of low average rainfall, inadequate capture and storage facilities for intermittent rainfall or, as is the case in southern Africa, a pattern of periodic droughts. The possible contribution of climate change to this is unknown, but investment in water storage infrastructure could do a lot to alleviate this.
‘If the international community does nothing to assist the rainforest nations in protecting the world’s rainforests, the damage not just to climate but to biodiversity, to watersheds and to the livelihoods of millions of people will, as you know here, be incalculable.’
Deforestation can have a very significant effect on local or regional climate, as must certainly have been the case for prehistoric Europe as forests were cleared for farmland. In the case of tropical forests, there would also be a large negative impact on biodiversity. Current livelihoods would certainly be lost, but probably there would be many farming-related jobs created. Such wholesale changes would be regrettable, but the impact on global climate is still unclear: there is still debate about the carbon cycle and patterns of absorption and emission of carbon dioxide and methane from forests.
‘And the recent report of the Global Humanitarian Forum led by Kofi Annan suggests that 325 million people are already seriously affected by drought, disease, floods, loss of livestock, low agricultural yields and decline of fish stocks. A further 500 million are at extreme risk, and every year the effects of climate change are already killing 300,000 people, the numbers killed by Indian Ocean tsunami, and the toll could rise to 500,000 each year by 2030.’
This report has been widely criticised for the assumptions it makes and the conclusions drawn. In particular, the figure of 300,000 people killed by the effects of climate change has not been justified, and appears to have been an extreme estimate produced for political purposes. It is difficult to take anything else in the report seriously in view of its evident bias and subjectivity.
‘On Saturday, the President of the Maldives, whose concerns I share, held a Cabinet Meeting underwater to highlight the calamity that may engulf his islands. In the South Pacific nation of Kiribati, President Tong has requested international aid to evacuate his people before their land quite literally disappears.’
There is no evidence that the rate of sea level rise in the Pacific or elsewhere has increased in recent years from the fairly steady level apparent over the last century. Low-lying small island nations such as the Maldives and Kiribati are made up of a series of coral atolls, which are continually being eroded by wind and waves while new coral is being added. They appear historically to have been at about the same elevation above sea level as the waters have slowly risen. In short, although there are undoubtedly problems associated with population density and water extraction on the Maldives and elsewhere, there is no reason to suppose that the environment is any more vulnerable than it was a few decades ago. Publicity stunts such as the underwater Cabinet meeting may grab headlines, but they do not change the facts.
‘The extraordinary summer heat-wave of 2003 in Europe resulted in 35,000 extra deaths. On current trends such an event could become quite routine in Britain in just a few decades’ time. And within the lifetime of our children and grandchildren the intense temperatures of 2003 could become the average temperatures experienced throughout much of Europe.’
Despite attempts to draw parallels between extreme weather events and future weather patterns, such projections, we should remember, are based on incomplete computer models which all make essentially the same assumptions about the enhanced greenhouse effect, and which clearly deal in an inadequate way with the natural drivers of climate which have been dominant for at least the last decade.
In contrast to what he sees as the unsustainable and insecure path of ‘business as usual’, the Prime Minister extols the virtues of a decarbonised energy system: ‘Now, the other path leads to a low-carbon, high-cooperation future; a future too of economic growth, but growth powered by new energy sources and by energy efficiency, and bringing with it huge economic opportunities for developed and developing countries alike: new jobs and businesses; new technologies; new export opportunities.’
To many, this Brave New World probably sounds little different to what would happen anyway without specific policies to reduce greenhouse gas emissions. As fossil fuel prices rise, the incentive to use alternative energy supplies grows. At the same time, innovation makes some new technologies increasingly competitive so that their widespread adoption becomes an obvious choice. Which will be the winners in a generation’s time we simply do not know, but winners there will most certainly be.
In the meantime, if the arguments by political leaders for a binding post-Kyoto agreement in Copenhagen are based on such uncertain evidence as quoted by Gordon Brown, perhaps we would be better advised to take the business as usual path. Business as usual does not mean doing the same thing for ever, but innovating and progressing in the way that we and previous generations have done.
Salem, OR, (AgPR) - American Agri-Women (AAW) will present their highest honor, the Veritas Award, to Oregon Meteorologist George Taylor, at their 34rd annual convention in Salem, Oregon, November 13. The Veritas Award is given to individuals who have been public witness to the “pursuit of truth” in accordance with the principles expressed in the AAW statement of philosophy. Of specific interest are personalities of importance to agriculture, or responsible media coverage of agricultural issues and events.
George Taylor has been working in the field of meteorology and climatology for over 34 years. Taylor, who lives in Corvallis, Oregon, served for 19 years as Oregon’s climatologist and was elected president of the American Association of Climatologists in 1998. He now runs his own business, Applied Climate Service.
Through his research over the years Taylor has shown that global warming is a natural occurrence with minimal influence by man and that by looking back further than the past few decades, the data shows that warming and cooling periods are common. Taylor continually works to keep the public informed of the effects climate has on their lives by publishing over 200 reports, books and articles, and by writing a bi-weekly column in two local newspapers. He is also a popular speaker, standing up for what he knows to be the truth, even when it disagrees with the prevailing opinion. AAW president Marcie Williams notes that, “George Taylor’s credentials and his courage in speaking out makes him an outstanding Veritas Award winner and we are excited to be able to honor him in this way.”
Past Veritas recipients include Paul Harvey, Michael DeBakey, Julia Child, Dr. C. Everett Koop, and John Stossel, to name a few.
Come to the AAW convention to hear these informative and entertaining speakers. For information about the convention, or agenda and registration form, visit the American Agri-Women website.
ICECAP salutes the American Agri-Women and our colleague George Taylor, well deserving of this recognition for his hard work in service of his state and the science that unfortunately went unrecognized by the Governor, the university and media but greatly appreciated by true scientists and those in industry he served so well.
The following letter was sent to all 100 U.S. Senator’s on October 29, 2009 by a team of scientists. The letter is reproduced in full below:
A GAGGLE IS NOT A CONSENSUS
You have recently received a letter from the American Association for the Advancement of Science (AAAS), purporting to convey a “consensus” of the scientific community that immediate and drastic action is needed to avert a climatic catastrophe.
We do not seek to make the scientific arguments here (we did that in an earlier letter, sent a couple of months ago), but simply to note that the claim of consensus is fake, designed to stampede you into actions that will cripple our economy, and which you will regret for many years. There is no consensus, and even if there were, consensus is not the test of scientific validity. Theories that disagree with the facts are wrong, consensus or no.
We know of no evidence that any of the “leaders” of the scientific community who signed the letter to you ever asked their memberships for their opinions, before claiming to represent them on this important matter. We also note that the American Physical Society (APS, and we are physicists) did not sign the letter, though the scientific issues at stake are fundamentally matters of applied physics. You can do physics without climatology, but you can’t do climatology without physics.
The APS is at this moment reviewing its stance on so-called global warming, having received a petition from its membership to do so. That petition was signed by 160 distinguished members and fellows of the Society, including one Nobelist and 12 members of the National Academies. Indeed a score of the signers are Members and Fellows of the AAAS, none of whom were consulted before the AAAS letter to you.
Professor Hal Lewis, University of California, Santa Barbara
Professor Fred Singer, University of Virginia
Professor Will Happer, Princeton University
Professor Larry Gould, University of Hartford
Dr. Roger Cohen, retired Manager, Strategic Planning, ExxonMobil
List of 160 signers of the APS petition available here
Climate Depot’s Related Links:
Scientists Write Open Letter to Congress: ‘You Are Being Deceived About Global Warming’—‘Earth has been cooling for ten years’ - July 1, 2009
Climate Fears RIP...for 30 years!? - Global Warming could stop ‘for up to 30 years! Warming ‘On Hold?...’Could go into hiding for decades,’ peer-reviewed study finds - Discovery.com - March 2, 2009
In case you missed it live, Christopher Monckton spent an entire hour on the Glenn Beck program Friday on the topic of global warming, skepticism, and the Copenhagen Treaty. Joining them was John Bolton, former US Ambassador to the UN.
To see the proposed Copenhagen Treaty, see this essay on the subject here.
Parts 1-7 of the hour long video are below. YouTube has time limits on clips, so it is broken up into parts 1-7.
--------------------------
ICECAP NOTE: Here Monckton addresses a Tea Party in Houston, Texas in front of 14,000 Americans on November 2, 2009. You have to love that hat.
If you have the stomach for it, watch Katie clueless Couric interview hoaxster Gore on CBS here . When the low solar effect kicks in and the cold PDO/La Nina dominated cold era really kicks in, maybe Madoff will have another former millionaire as company to discuss the good lives they enjoyed at the expense of the many good people they hurt. In a surprise, ABC’a Diane Sawyer Hits Gore on Profits From Global Warming, Plays Glenn Beck Attack.
Gore appeared again this morning on Morning Joe on MSNBC hawking his new book and restating all the points proven wrong. He did get a question about whether his investment organization receiving a big chunk of money from the stimulus program was improper but he escaped it by stating it just made sense he would invest in any effort that he cared so much about. Of course that was our tax dollars he was investing without our permission. There was no follow up. He was asked about the loss of jobs that would result across the northern states, and Gore replied with the Green Job lie.
The interviewers have not done their homework that would have told them the ‘green jobs’ claim was disproved in Spain, Denmark, Germany and the UK. In Spain for example, for every green job created through heavily subsidized alternative energy projects, 2.2 real jobs were lost when companies feeling the steep increase in energy prices, laid off workers, or exported jobs and/or operations to places like India or China. For every 10 green jobs, only 1 was permanent. Unemployed reached 18.1%, highest in the European Union.
We are beginning to see it in the US. One example is in Maine, where the state is promising 300 new jobs for one wind project heavily subsidized by stimulus dollars. Looking in detail at the plans, most of those jobs are temporary during the construction phase with only 6 permanent, including some night watchmen/security probably at minimum wage. Given the proven unreliability of wind in windy Europe when energy is needed the most, you might as well burn those dollars for all the good they will do. Maine’s Governor Balducci’s pet project will gain him a 7 figure job in an energy project just as Obama advisor Cass Sustein did after Harvard let him go (he became a consultant for the same wind company in Maine for $2.5M/year for one day of his time per week before Obama snatched him up.)
---------------------------
NY Times excuses Gore’s climate profiteering
The New York Times and reporter John Broder get partial credit for spotlighting Al Gore’s climate profiteering on the front-page of today’s paper.
Unfortunately the article offers really lame justifications for Gore’s self-serving alarmism.
Gore only responded to the Times in an e-mail: Mr. Gore says that he is simply putting his money where his mouth is.
“Do you think there is something wrong with being active in business in this country?” Mr. Gore said. “I am proud of it. I am proud of it.” In an e-mail message this week, he said his investment activities were consistent with his public advocacy over decades. Or is it that he’s putting his mouth where his money is?
Don’t forget that Al Gore testified before the House last spring that he has no profit motive. As reported by Broder: “But at the hearing in April, he was challenged by Ms. Blackburn, who echoed some of the criticism of Mr. Gore that has swirled in conservative blogs and radio talk shows. She noted that Mr. Gore is a partner at Kleiner Perkins, which has hundreds of millions of dollars invested in firms that could benefit from any legislation that limits carbon dioxide emissions.”
“I believe that the transition to a green economy is good for our economy and good for all of us, and I have invested in it,” Mr. Gore said, adding that he had put “every penny” he has made from his investments into the Alliance for Climate Protection.
“And, Congresswoman,” he added, “if you believe that the reason I have been working on this issue for 30 years is because of greed, you don’t know me.”
It was apparently “a bridge too far” for Broder to notice that Gore’s House testimony is entirely inconsistent with Gore’s e-mail to the Times. Readers of this blog will recall that it was this Steve Milloy column in Human Events that prompted Rep. Marsha Blackburn to ask Gore about his profiteering. But rather than saying he was “putting his money where his mouth was,” Gore chose to dissemble, if not outright lie, to Congress.
And let’s not forget about Gore’s feigned ignorance before Congress of his relationship with Goldman Sachs. See post and comments here.
And let’s not forget the GORE EFFECT, where cold and snow follow him wherever he appears.
GORE EFFECT LIVES
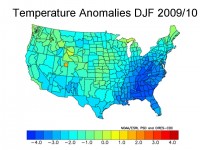
Gore is spending much of his time in the United States, hawking his new book and lobbying for Cap-and-Trade. Well Mother nature has again taken note. Here is how October ended up temperature wise. Virtually every part of the United States was below normal temperaturewise, with some record early snows. Temperature anomalies are displayed in degrees celsius so multiply by 1.8 to get degrees fahrenheit.
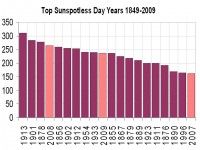
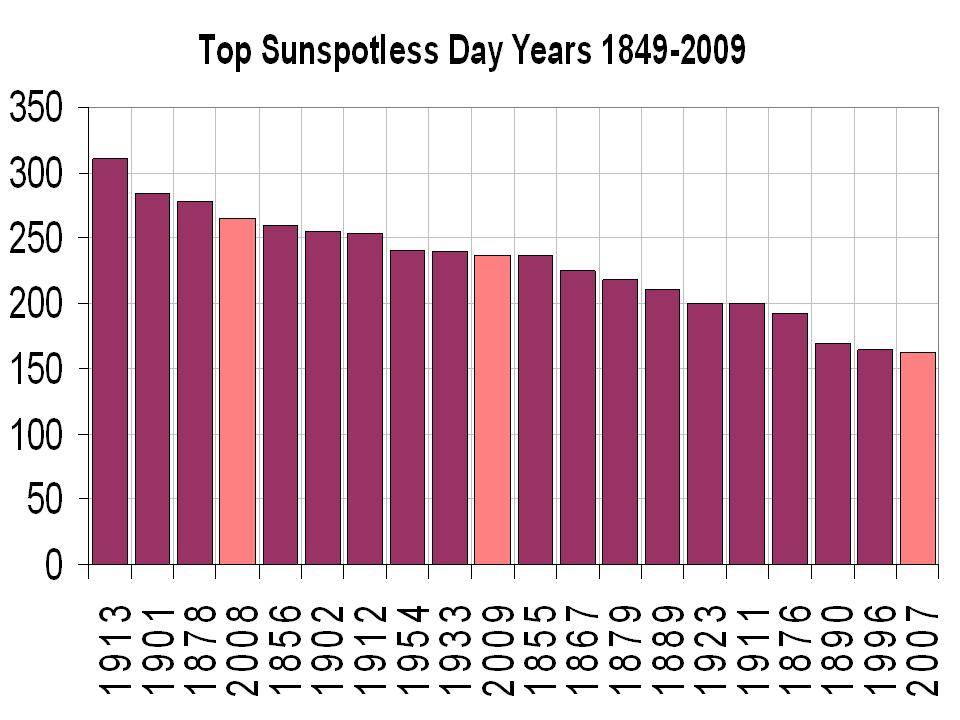
Sunspotless days this year have reached 237 today, moving 2009 into the top 10 of the most spotless day years. We are just 29 days short of 2008 which had 265 days, enough to rank 4th highest. For the solar minimum, we have reached 748 days, three times the number of recent cycle minima. Note 2007 was 20th.


