UPDATE: See Monckton’s defense of his sovereignty concerns in this video.
President Obama may be traveling again to the Danish capital in December to attend the U.N. COP15 Climate Change Conference. This agreement would commit the United States to punitive and expensive greenhouse gas regulations dictated by the United Nations without recourse.
COP stands for “Conference of the Parties” and the December Copenhagen conference will be the 15th under the United Nations Framework Convention on Climate Change (UNFCCC), hence COP15. According to their website, it will be one of the largest conferences ever held outside the New York or Geneva headquarters, with an anticipated attendance of over 10,000 people, including governmental representatives from 189 countries, industry groups, and other non-governmental organizations.
The theme of the December 7 - 18 conference is “Hope,” so perhaps Mr. Obama will have more luck this time. Instead of soliciting the International Olympic Committee with trite cliche and no payoffs, he will be doing something much easier: selling out our country. After all, ceding power, relinquishing billions in U.S. tax dollars and destroying U.S. economic competitiveness is a pretty easy sell to the countries that will benefit, and he has had a lot of practice doing the same thing here at home. He will have a hard time screwing this one up.
The Hope site optimistically pronounces: On 7 December, leaders from 192 countries gather for U.N. Climate Change Conference in Copenhagen and decide the fate of our planet…
Decide the fate of our planet… Do these people have any idea how mindlessly grandiose they sound? Of course not. They are out to save the planet, just like Nancy Pelosi! It is hard for a normal person to imagine making such proclamations without embarrassment. But this is today’s political class
This agreement will cede U.S. sovereignty permanently and irrevocably to the United Nations. So said British Lord Christopher Monckton at an event at Bethel University in St Paul, Minnesota this past Wednesday, October 14th.
Lord Monckton was former British Prime Minister Margaret Thatcher’s science advisor. He has lectured and written extensively on the issue, including an in-depth scientific critique to the 50,000 member American Physical Society, a serious side-by-side comparison slap-down of Al Gore’s global warming assertions, and a recent summary of the global warming issue. In introducing his topic at Bethel University, he states unequivocally:
...and I am going to show you the latest science, which now doesn’t leave the question unsettled any more, this is now settled science, it is now settled science that there is not a problem with our influence over the climate. The science is in, the truth is out, and the scare is over.
You can watch his entire 1 hour 35 minute presentation here - well worth the time if you can spare it. The slideshow he frequently points to in this presentation can be viewed along with the video, here. Lord Monckton presents a series of statistics, charts and studies making a compelling case that not only is global warming insignificant - if it exists at all - but is likely not manmade, and more importantly, that the global warming alarmists have repeatedly, blatantly, deliberately lied, suppressing the facts to promote the myth.
Despite his effective refutation of manmade global warming, his closing remarks about the Copenhagen treaty are chilling:
I read that treaty. And what it says is this, that a world government is going to be created. The word “government” actually appears as the first of three purposes of the new entity. The second purpose is the transfer of wealth from the countries of the West to third world countries, in satisfication of what is called, coyly, “climate debt” because we’ve been burning CO2 and they haven’t. We’ve been screwing up the climate and they haven’t. And the third purpose of this new entity, this government, is enforcement.
So, thank you, America. You were the beacon of freedom to the world. It is a privilege merely to stand on this soil of freedom while it is still free. But, in the next few weeks, unless you stop it, your president will sign your freedom, your democracy, and your humanity away forever. And neither you nor any subsequent government you may elect will have any power whatsoever to take it back. That is how serious it is. I’ve read the treaty. I’ve seen this stuff about [world] government and climate debt and enforcement. They are going to do this to you whether you like it or not.
Note to be ratified and supercede our constitution, such a treaty would have to receive the support of 2/3rds of the senate. This is unlikely as they would be ceding their control as well as the executive branch to the UN. A very scary scenario and one which I would imagine many senators would have second thoughts about. I could imagine Obama signing it in Copenhagen as a gesture of support knowing it is likely too fail similar to Clinton and Kyoto.
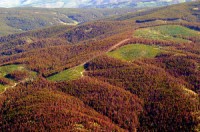
A tiny little bug about the size of a grain of rice has become a focal point in the debate about manmade climate change. Over the last 12 years, the mountain pine beetle has spread quickly through the Mountain West and Canada killing millions of acres of pine trees.
The beetle thrives when conditions are drier and warmer than average and some experts have blamed its spread on manmade climate change and a warming environment. From Canada south to Colorado, images of acres of dead, brown trees amongst their healthy neighbors make for a stark picture of what may be forests in decline.
Global warming activists have been quick to seize on the pine beetle ‘epidemic’ as a sign of things to come and an impending ecological disaster. In truth, drawing the line between manmade climate change and the pine beetle outbreak is a stretch that few experts make. Rather, most see the outbreak as a natural function of forests and in many ways it is Mother Nature correcting man’s previous mistakes.
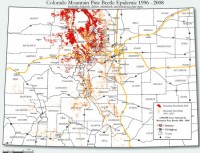
Colorado finds itself front and center in the battle against the mountain pine beetle. In the coming weeks the state’s forest service will be releasing its annual report and is expected to estimate that 2.5 million acres have been infected by the beetles since 1996 - the largest outbreak in state history. However, that represents a fraction of the state’s forest land and areas are being naturally rehabilitated after the infections pass.
The state’s forest service is reluctant to connect manmade climate change with the outbreak and studies have shown that while the outbreak is large, it is not entirely unprecedented. Sky Stephens, Forest Entomologist for the Colorado State Forest Service, says that while climate change is a hot topic, there “hasn’t been a well structured argument” connecting the two. Indeed, the state points to what it calls a ‘perfect storm’ of drought, recent warmer winters and forests that are denser than what nature intended. Any one of those factors could lead to an increase in beetle populations but coupled together, it becomes a difficult situation for foresters to manage.
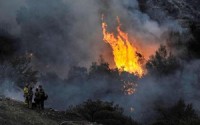
Man may indeed have played a large role in the spread of the mountain pine beetle but not in the way climate change activists portray. For the latter half of the 20th century as people settled in forested areas in greater numbers, forest fires drew more attention. While in centuries past fires burned unabated as part of a natural cycle of the earth, man now was coming to the “rescue” and putting out the fires. In doing so, an unintended consequence of forest overgrowth was realized. By eliminating the natural death and re-birth cycle that fire brings, forests became more dense and just as critically, they have matured to an age that is ripe for pine beetles to attack.
Stephens said that our desire to stamp out fires in unpopulated areas did more harm than good. “It set us up for a number events that have and are going to happen,” she said. Stephens said the forests were never meant to have the dense stands that we have grown accustomed to seeing and the more food there is for the beetles, the greater the impact when they attack.
Dave Thom, a natural resources officer with the Black Hills National Forest agrees with Stephens. Of trying to point the finger at manmade climate change, he told the Rapid City Journal last month, “It’s more complicated than that.” The drought and the dense forests play a big factor according to Thom. He said, “As the trees get more dense, they are less able to resist bark-beetle infestations. When you take increasingly dense trees and add the drought, the intersection causes weakened trees that are more susceptible to beetle attack. That phenomenon can happen regardless of a few degrees of change in climate, measured on a global scale.”
Researchers point to outbreaks in the past that killed millions of lodgepole pines, before global temperatures rises are thought to be having an effect. The Rocky Mountains suffered through outbreaks in the 1960s, the 1970s and the early 1980s. A different beetle, the spruce beetle, is known to have caused extensive damage in western Colorado in the 1940s.
Before outbreaks were documented, tree-ring evidence points to extensive outbreaks before the 20th century as well. As the CFRI study said, “Insect outbreaks are a natural occurrence in almost all of the different kinds of forests in Colorado. Outbreaks do not occur very frequently; the time interval between successive outbreaks in any given area is usually measured in decades. Nevertheless, outbreaks can be expected periodically in almost any place in the state where forests are found.”
A recent study completed by the Colorado Forest Restoration Institute (CFRI) in conjunction with the Colorado State Forest Service and area universities flatly stated that the current outbreak is not unusual. “There is no evidence to support the idea that current levels of bark beetle or defoliator activity in Colorado’s lodgepole pine and spruce-fir forests are unnaturally high,” the study said. CFRI as well pointed to the age of the current forest as a factor in the outbreak. “Widespread burning in the late 1800s that resulted in extensive cohorts of relatively similar age that now are entering a stage that is susceptible to bark beetle outbreaks,” the study said.
The ravages of the mountain pine beetle are evidenced by anyone that travels in the Rocky Mountains. The damage occurs over a short period of time and can encompass large areas thus making the outbreaks seem unusual. However, the reality appears to be that the pine beetle, much like fire, is simply a natural process forests go through. And while the current outbreak is larger than we remember, Stephens summed it up by saying, “The beetles haven’t read the textbooks.” See full story here.
This “stunning” development (link to au.com story here) citing lake sediment and some midges “proves” everything. Glad that’s settled. See thoughts at the end. But here is the University of Colorado press release that started it all. Note that in no place in the release do they use the word “proof”.
Arctic Lake Sediment Record Shows Warming, Unique Ecological Changes in Recent Decades - October 19, 2009
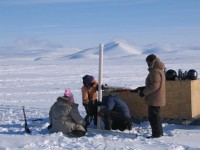
An analysis of sediment cores indicates that biological and chemical changes occurring at a remote Arctic lake are unprecedented over the past 200,000 years and likely are the result of human-caused climate change, according to a new study led by the University of Colorado at Boulder. A University of Colorado at Boulder-led analysis of a 200,000 year-old sediment core from a Baffin Island lake indicates warming temperatures in the Arctic due to human activity are overriding a natural cooling trend in the region. Photo by Jason Briner, University at Buffalo
While environmental changes at the lake over the past millennia have been shown to be tightly linked with natural causes of climate change - like periodic, well-understood wobbles in Earth’s orbit - changes seen in the sediment cores since about 1950 indicate expected climate cooling is being overridden by human activity like greenhouse gas emissions. The research team reconstructed past climate and environmental changes at the lake on Baffin Island using indicators that included algae, fossil insects and geochemistry preserved in sediment cores that extend back 200,000 years.
“The past few decades have been unique in the past 200,000 years in terms of the changes we see in the biology and chemistry recorded in the cores,” said lead study author Yarrow Axford of CU-Boulder’s Institute of Arctic and Alpine Research. “We see clear evidence for warming in one of the most remote places on Earth at a time when the Arctic should be cooling because of natural processes.”
The study was published Oct. 19 in the Proceedings of the National Academy of Sciences. The study included researchers from CU-Boulder, the State University of New York’s University at Buffalo, the University of Alberta, the University of Massachusetts and Queen’s University in Kingston, Ontario. The sediment cores were extracted from the bottom of a roughly 100-acre, 30-foot-deep lake near the village of Clyde River on the east coast of Baffin Island, which is several hundred miles west of Greenland. The lake sediment cores go back in time 80,000 years beyond the oldest reliable ice cores from Greenland and capture the environmental conditions of two previous ice ages and three interglacial periods.
The sediment cores showed that several types of mosquito-like midges that flourish in very cold climates have been abundant at the lake for the past several thousand years. But the cold-adapted midge species abruptly began declining in about 1950, matching their lowest abundances of the last 200,000 years. Two of the midge species adapted to the coldest temperatures have completely disappeared from the lake region, said Axford. In addition, a species of diatom, a lake algae that was relatively rare at the site before the 20th century, has undergone unprecedented increases in recent decades, possibly in response to declining ice cover on the Baffin Island lake.
“Our results show that the human footprint is overpowering long-standing natural processes even in remote Arctic regions,” said co-author John Smol of Queen’s University. “This historical record shows that we are dramatically affecting the ecosystems on which we depend.” The ancient lake sediment cores are the oldest ever recovered from glaciated parts of Canada or Greenland. Massive ice sheets during ice ages generally scour the underlying bedrock and remove previous sediments. “What is unique about these sediment cores is that even though glaciers covered this lake, for various reasons they did not erode it,” said study co-author Jason Briner of the University at Buffalo. The result is that we have a really long sequence of sediment that has survived Arctic glaciations.”
Axford emphasized the multiyear research project required expertise from each of the five institutions involved in the PNAS study. “This was a team effort all the way around, and each of the institutions has a unique set of skills that allowed us to carry out this study,” she said. “We needed people who understood algae, insects, glaciers and geochemistry, not to mention how to drive snowmobiles and extract the cores.” The study was funded by the National Science Foundation, the Natural Sciences and Engineering Research Council of Canada and the Geological Society of America.
A study published in Science magazine last month that involved CU-Boulder researchers and reconstructed past temperatures in the Arctic using ice cores, tree rings and lake sediments concluded that recent warming around the Arctic is overriding a cooling trend caused by Earth’s periodic wobble. Earth is now about 0.6 million miles further from the sun during the Northern Hemisphere summer solstice than it was in 1 B.C. - a trend that has caused overall cooling in the Arctic until recently. INSTAAR researcher and CU-Boulder geological sciences Professor Gifford Miller was a co-author on both the PNAS study and the recent Science study.
-------------------------------
A scientist on a mailing list I subscribe to put it in perspective this way:
1. “Several types of mosquito-like midges that for many thousands of years thrived in cold climate surrounding the lake suddenly began declining at around 1950” - Have they accounted for the use of DDT, then? Seems to me that DDT on Baffin Island could have been very popular among trappers and the military in the 50s. Possibly pertinent too: DDT and its breakdown products are transported from warmer regions of the world to the Arctic by the phenomenon of global distillation, where they then accumulate in the region’s food web. Thus there might be a human impact on this parameter, but of another kind.
Beyond that, though, if the authors are suggesting that CO2 has caused a mosquito or midge shortage up north, they should consult caribou herds, whose route of wandering is traceable to wind direction, so desperate are these animals to escape the floating bloodsuckers. In the Canadian Arctic, researchers who bared their arms, legs, and torsos in an experiment reported as many as 9,000 [mosquito] bites per minute. Who knows, then? Changing wind patterns and a consequent shift of caribou migration (the supporting host) or DDT usage might account for the decline of midge bodies in this particular study of Ayr Lake. But CO2?
2. “The Earth is now some 600,000 miles (966,000 kilometers) further from the sun during the Northern Hemisphere summer solstice than it was at the time of Jesus Christ” - A sad example of allegation that’s already become a repeated “fact” simply because no one’s bothered to investigate it. I have, and find no indication that this million km claim is true. - Alan
--------------------------------
Just a note on DDT from Wikipedia: “First synthesized in 1874, DDT’s insecticidal properties were not discovered until 1939. In the second half of World War II, it was used with great effect to control mosquitoes spreading malaria and lice transmitting typhus among civilians and troops, resulting in dramatic reductions in the incidence of both diseases. The Swiss chemist Paul Hermann Muller was awarded the Nobel Prize in Physiology or Medicine in 1948 “for his discovery of the high efficiency of DDT as a contact poison against several arthropods.” After the war, DDT was made available for use as an agricultural insecticide, and soon its production and use skyrocketed.
Here’s a 2008 study on DDT in penguins that sums it up pretty well: POPs (Persistent organic pollutants) accumulate in the Antarctic and Arctic via repeated cycles of evaporation and condensation as they move poleward through the atmosphere from the tropical and temperate zones where most are released.
2005 TORONTO (CP) - Seabird droppings are leaving more than a foul mess in the Arctic they’re contaminating northern lakes and ponds with extremely high levels of mercury and DDT, Canadian researchers have found. Concentrations of the chemicals were found to be as much as 60 times higher in bodies of water on Devon Island, Nunavut, than in other Arctic areas, says a study to be published Friday in the journal Science.
No, no it couldn’t be DDT killing those midges, it has to be global warming since 1950.
Journalism is dead, science may not be far behind.
See post here. See the real story about the arctic by the real arctic data experts at the International Arctic Research Center, University of Alaska, Fairbanks here and below.
International Arctic Research Center, University of Alaska, Fairbanks
RECENT RESULTS
* The Arctic/North Atlantic climate system displays large-amplitude multidecadal variability
* Understanding the key mechanisms influencing the Arctic/North Atlantic multidecadal variability is essential for developing robust climatic forecasts.
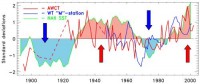
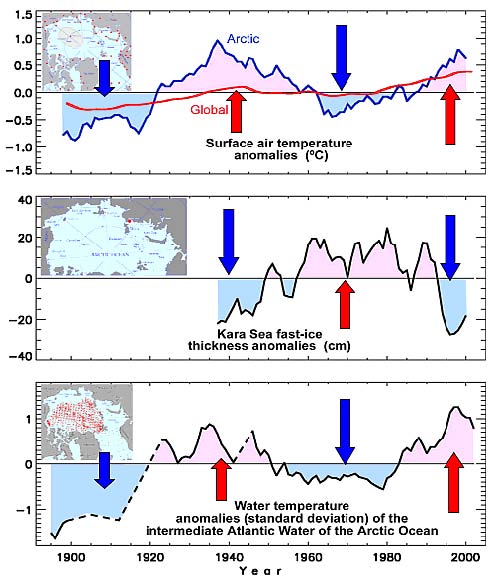
Arctic air temperature, fastice thickness, and intermediate Arctic Ocean layer temperature exhibit strong coherent multidecadal variations.
Arctic (blue) and global (red) surface air temperature anomalies (top), fastice thickness (middle), and intermediate Arctic Ocean water temperature (AWCT, bottom) are show. See larger image here.
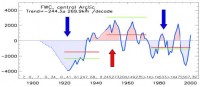
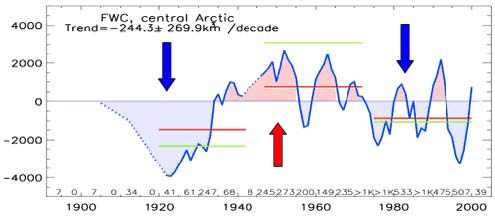
6-yr running mean Arctic Ocean freshwater content (FWC, blue line with shades) anomalies (km3). See larger image here.
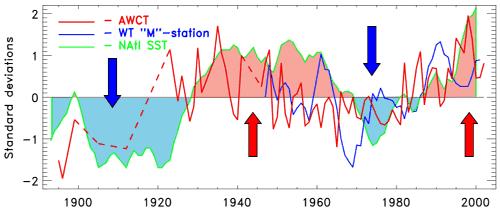
Low-frequency variability in the Arctic and North Atlantic is linked.
Normalized North Atlantic sea surface temperature (SST) anomalies (0-90oN, 290-30oE, green with red and blue shades), intermediate Arctic Ocean water temperature (AWCT, red), and normalized 6-yr running mean 10m water temperature (WT) anomalies from ocean weather station ``Mike’’ at 66oN, 2oE (Norwegian Sea, blue), are shown.See larger image here.
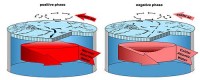
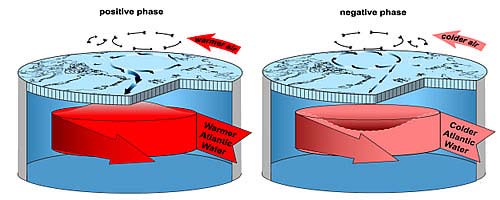
Positive and negative phases of arctic multi-decadal variability.
During the positive phase, there is an increase of transport of warmer air and water from the North Atlantic into the Arctic. The anticyclonic Beaufort Gyre is weakened/ strengthened, and cyclonic circulation in the eastern Arctic is intensified/suppressed during positive/negative phases of multi-decadal variability. Increased cyclonicity under the positive phase of multi-decadal variability causes divergence of ice drift and surface circulation, leading to doming of the Atlantic Water. The well-developed Arctic High, evident during negative phases, results in intensified anticyclonic ice drift and surface circulation, convergence of surface currents and a depression in the Atlantic Water.
Summary
Multidecadal fluctuations in the Arctic/North Atlantic climate system should be taken into account when assessing long-term climate change and variability. Understanding the key mechanisms influencing the Arctic/North Atlantic multidecadal variability is essential for developing robust climatic forecasts.
Accusations of cherry-picking - that is, carefully choosing data to support a particular point - are constantly being hurled around by all sides of the climate change debate. Most recently, accusations of cherry-picking have been levied at analyses describing the recent behavior of global average temperature. Primarily, because claims about what the temperature record says run the gamut from accelerating warming to rapid cooling and everything in between -depending on who you ask and what point they are trying to make.
I am often asked as to what is the “right” answer is. What I can say for certain, is that the recent behavior of global temperatures demonstrates that global warming is occurring at a much slower rate than that projected by the ensemble of climate models, and that global warming is most definitely not accelerating.
Choice of Cherries
But as to questions concerning just how far beneath climate model predictions the rate of warming is, or for just how long the average temperature of the world has not warmed at all, the answers depend on several things, among them the dataset you want to use and the time period over which you examine - i.e., which cherries you wish to pick.
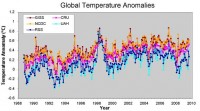
Figure 1 illustrates the various cherry varieties that you have to choose from. It shows the global temperature history during the past 20 years as compiled in five different datasets (three representing surface temperatures, and two representing the temperatures in the lower atmosphere as measured by satellites - the latter being relatively immune form the data handling issues which plague the surface records).
See larger here.
Figure 1. Global temperature anomalies from September 1989 through August 2009 as contained in five different data compilations. The GISS (Goddard Institute for Space Studies), NCDC (National Climate Data Center), and CRU (Climate Research Unit) data are all compiled from surface records, while the RSS (Remote Sensing Systems) and UAH (University of Alabama-Huntsville) data are compiled from satellite observations of the lower atmosphere.
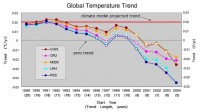
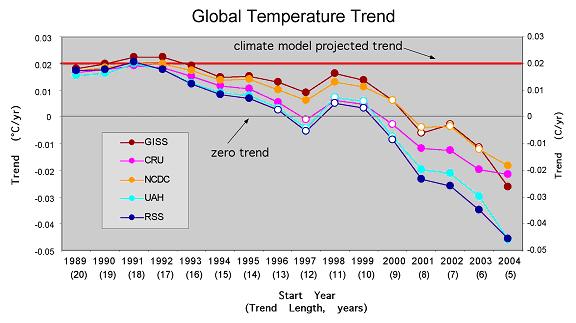
To give you some guidance as to which cherries to use to make which ever point you want, I have constructed a Cherry-Pickers Guide to Global Temperature Trends (Figure 2).
See larger here.
Figure 2. Cherry-Pickers Guide to Global Temperature Trends. Each point on the chart represents the trend beginning in September of the year indicated along the x-axis and ending in August 2009. The trends which are statistically significant (p<0.05) are indicated by filled circles. The zero line (no trend) is indicated by the thin black horizontal line, and the climate model average projected trend is indicated by the thick red horizontal line.
It shows the current value (though August 2009) of trends of various lengths from all of the five commonly used global temperature compilations. I compute the trends as simple linear least-squares fits through the monthly global average temperature anomalies for each dataset (from Figure 1). Each point in Figure 2 (for each dataset) represents the trend value for a different length period, beginning in September in the year indicated along the horizontal axis and ending in August 2009.
Starting in September of particular year and ending in August of this year produces a trend with a length expressed in units of whole years. For example, a trend starting in September 1999 and ending in August 2009 include 120 months, or 10 complete years. The values for the 10-yr trend for each dataset are plotted on the chart directly above the value on the horizontal axis labeled 1999. If the trend value is statistically significant at the 1 in 20 level (p<0.05), I indicate that by filling in the appropriate marker on the chart.
I also include several other items of potential interest to the cherry harvesters; first is the dotted horizontal line representing a trend of zero—i.e., no change in global temperature, and second, the thick red horizontal lines which generally indicates the average trend projected to be occurring by the ensemble of climate models. Bear in mind that red line only represents the average model expectation, not the range of model variability. So it shouldn’t be used to rule out whether or not a particular observed value is consistent with model expectations, but does give you some guidance as to just how far from the average model expectation the current trend lies (a cherry picker is not usually worried about the finer details of the former, but, instead, the coarser picture presented by the latter).
General Conclusions
Here are a few general statements that can be supported with using my Cherry-Pickers Guide:
• For the past 8 years (96 months), no global warming is indicated by any of the five datasets.
• For the past 5 years (60 months), there is a statistically significant global cooling in all datasets.
• For the past 15 years, global warming has been occurring at a rate that is below the average climate model expected warming
And here are a few more specific examples that the seasoned cherry-picker could tease out:
• There has been no (statistically significant) warming for the past 13 years. [Using the satellite records of the lower atmosphere].
• The globe has been cooling rapidly for the past 8 years. [Using the CRU and satellite records]
Or on the other side of the coin:
• Global warming did not 'stop' 10 years ago, in fact, it was pretty close to model projections. [Using the GISS and NCDC records beginning in 1998 and 1999]
• Global warming is proceeding faster than expected. [Using the GISS record starting in 1991 or 1992 - the cool years just after the volcanic eruption of Mt. Pinatubo]
I am sure the more creative of you can probably think of many others. Read full report here.


