The smell of manure hangs over Greeley as it has for half a century. These days it’s more than just a potent reminder of the region’s agricultural roots and the hundreds of thousands of cattle raised on the city’s outskirts. The stench smells like an opportunity.
Investors are lining up to support a planned clean energy park that eventually will convert some of the methane gas released from the manure piles into power for a cheese factory and other businesses. JBS, which runs two of the largest feed yards and the local slaughterhouse, is testing a new technology that heats the cattle excrement and turns it into energy. “What once used to be a waste stream that was just a byproduct ... they are now recognizing has value,” said Bruce Biggi, the economic development coordinator for the city of Greeley, which received an $82,000 grant from the governor’s energy office this year for the park.
The idea is to lure new business to the area with what Biggi likes to call its renewable natural gas - the endless supply of methane from cheap manure. By reducing the amount of the potent greenhouse gas released into the air, the projects also potentially could turn cow dung into dollars, if a climate bill before Congress becomes law. “Agriculture and agribusiness is what Greeley is all about,” Biggi said. “We needed to take that strong traditional economic base and ... merge it with emerging renewable energy and technology.” Waste may be the new energy crop in these parts. But elsewhere, communities are looking anew at power sources such as the sun and wind that may exist in their own backyards.
The shift is being driven partly by legislation in Congress that would reduce the gases linked to global warming. The legislation, experts acknowledge, would do little to stem the heating up of the planet if other countries don’t take similar action. Should President Barack Obama sign the bill, it would put a price on each ton of carbon dioxide released. That would drive up the cost of polluting fossil fuels such as oil and natural gas and lead to investment in cleaner sources of energy.
Getting into the game now - like JBS and the investors eyeing Greeley’s energy park are doing - could potentially reap profits: selling credits generated by reducing greenhouse gases now into the emissions-trading market the bill would create. That market could prove lucrative for projects that reduce methane, which is 20 times more potent than carbon dioxide when it comes to trapping heat in the earth’s atmosphere.
The fear in Greeley, and elsewhere, is what else the legislation would change. In the city and surrounding Weld County, the worry is it would raise energy and fertilizer costs for farmers. They need to pump water to irrigate their crops and rely on cheap manure - the same manure that will be tapped for energy - when high natural gas prices drive up the cost of fertilizer. For the oil and gas industry, which produces more oil in Weld County than any other in the state, a shift to cleaner sources of energy could take away good-paying jobs. And it’s not clear whether all those will be replaced by the new green jobs that supporters are banking on.
“I can’t think of another place in the country like Weld County, where all the various interests are at play,” said John Christiansen, a spokesman for Anadarko Petroleum Corp., which produces oil and gas from 4,600 wells in the county. Many are on fields planted with feed corn, which also is being used to produce ethanol for gasoline locally. The confluence of different interests has made Weld County a frequent stop for members of Congress interested in how climate legislation is playing outside of Washington. Sen. Michael Bennet, D-Colo., Rep. Betsy Markey, D-Colo., and House Agriculture Committee Chairman Collin Peterson, D-Minn., all made visits over the summer.
“Our rural communities aren’t sold on this yet, there is a lot of uncertainty. But I think in the long run it will stabilize energy prices,” Markey said in an interview. Markey voted for the climate bill when it passed the House in June. Her vote could play a role in her re-election race next year in the largely Republican district. On an August afternoon, Markey and three other members of the state’s congressional delegation were singled out for their climate bill vote. A billboard covered with signatures and topped with the words “Shame on you!” stood at the entrance of the lunchtime event, organized by the American Petroleum Institute. The event drew about 600 people to a cavernous exhibit hall outside of Greeley for a pep rally opposing the legislation. API is a Washington, D.C.-based lobbying organization for the oil and gas industry.
“Why would we do anything to drive up their cost of doing business? It makes no sense,” local radio host Amy Oliver Cooke told the crowd. Many wore shirts that said, “Congress, Don’t Take Away my Job.” I can’t afford the legislation and neither can you,” she said. David Eckhardt, a fourth-generation Weld County farmer, is struggling with the math. Despite meeting with Bennet and Agriculture Secretary Tom Vilsack, Eckhardt remains skeptical of an Agriculture Department’s analysis of the House climate bill that says farmers stand to make more money from trapping carbon in their soil and crops than they will pay out in higher energy prices.
“I know my fuel will go up, I know my chemicals will go up. And the question that was asked at the meeting we had with them was how much? And their answer was not as much as you think it will,” said Eckhardt. “That’s not an answer.” For Eckhardt, a climate law could change what crops he plants. Read more here.
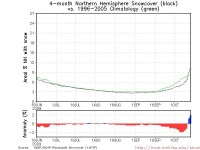
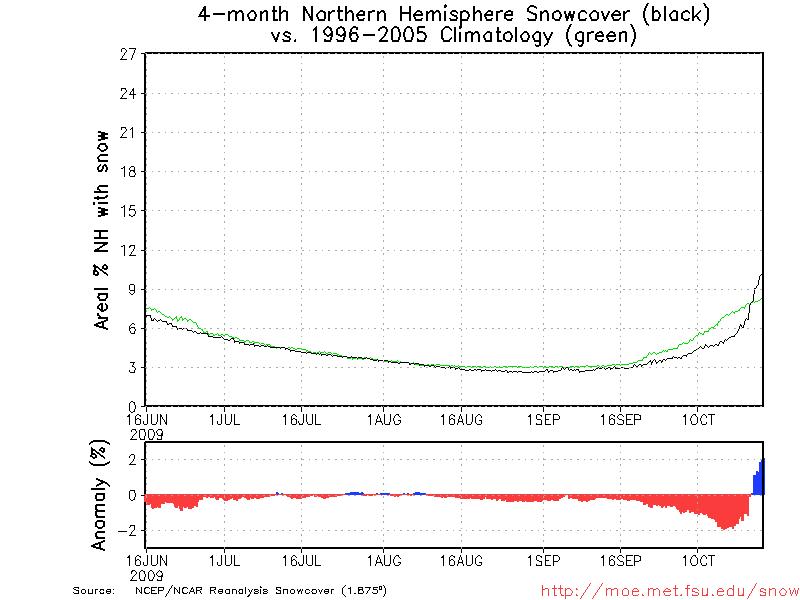
Icecap Update: The US snowcover has as Anthony has shown jumped to nearly 20% of the US in the last week, high for this time of year. This has helped to cause a big jump in the Northern Hemisphere snowcover which had been 2% below normal to 2% above normal in a week’s time.
This time of year there is a lot of variability in snowcover as early snowstorms have their thin snowpack disappear. Later on snow will be more stable. Thanks to Bob Hart at FSU which maintains this data base here.
Another possible DMSP/SSMI sea ice sensor failure? By Anthony Watts, Watts Up With That
Readers may recall that I brought an issue with NSIDC’s sea ice data to their attention back in February 09. The official response from Walt Meier then was “its not worth blogging about”. Shortly afterwards that tune changed when it was announced:
Not only was the glitch I pointed out part of the sensor failure real, there was also a long term drift in the sensor readings. Cryosphere Today followed soon afterwards, pulling the plug on their data plot.
This image here is what prompted me to bug NSIDC about the issue, the downspike was highly atypical of the dataset.
The glitch seen above turned out to be a “catastrophic failure” of the SSMI sensor on the Defense Meteorological Program (DMSP) satellite that NSIDC (and many others, including Cryosphere Today) also use. Here’s a look at the problem in more detail that WUWT covered in June.
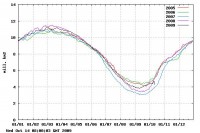
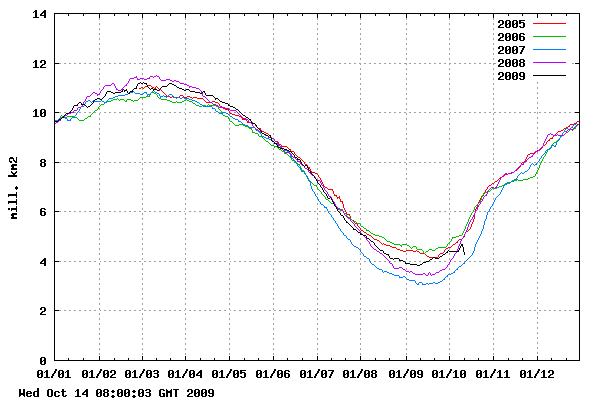
So today, I was advised in an email that I should have a look at the data from Danish Meteorological Institute (DMI), which also uses DMSP SSMI data to make their web graphic presentation. To quote Yogi Berra, it was “deja vu all over again”. Here’s the DMI image from today:
The sea ice extent value from JAXA is 6.5 million km2. The sea ice extent value from DMI is of course much lower, around 4.4 million km2. That is due to DMI choosing to plot “where areas with ice concentration higher than 30% are classified as ice”, while NSIDC, CT, and JAXA plot an area with at least 15 % sea ice. So the absolute difference isn’t what concerns me, it’s that darn glitch again.
NSIDC and CT have taken steps to filter out such things in their own records. DMI obviously hasn’t. The fact that such abrupt downward glitches are still observable in the DMSP SSMI data makes me concerned for the integrity of the dataset. In May 2009, NANSEN also had problems with SSMI data.
Nansen Corrects Sea Ice Data - Sea Ice Extent Now Greater, Near Normal for Most of April/May
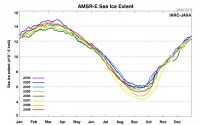
So the biggest names in sea ice data on the web, NSIDC, Cryrosphere Today, NANSEN, and now DMI, all of which use SSMI data, have had problems with it. The IARC-JAXA data has held steady. This is why I prefer using the JAXA AMSRE data from the AQUA satellite to look at current and recent history sea ice events. The newer AMSRE sensor has not shown any such errors, drifts or glitches during its history.
It would seem to me that the time has come for these agencies to consider switching to the more reliable AMSRE/AQUA platform and splicing the older SSMI data set with appropriate considerations to make an accurate longer term record of sea ice since 1979. Read post here.
It has been nearly three decades since I first wrote that “global warming” was a hoax and I have had to repeat myself countless times since then. Along the way I met many of the so-called “deniers” and dissenters. I had correspondence with others. We all knew that Al Gore was lying. We all know that President Obama is lying.
And yet the lies continue. The most amazing aspect of the hoax is that, despite a decade of global cooling, the mainstream media, print and electronic, relentlessly continue to write about “greenhouse gases” as if they have anything to do with the Earth’s climate.
The primary greenhouse gas in the Earth’s atmosphere is 95% WATER VAPOR. The primary source of warming and cooling on Earth is the SUN. The claim that carbon dioxide (CO2) has anything to do with the climate, other than to react to changes in it hundreds of years after they occur, is totally discredited, but I still read magazines like Business Week or The Economist, Time and Newsweek, as well as newspapers, whose reporters and editors demonstrate an astonishing ignorance - a willful ignorance - by continuing to publish global warming lies saying that CO2 emissions must be reduced..
Even the advocates of global warming began to speak and write about “climate change” several years ago in order to avoid the obvious fact that the Earth began cooling in 1998.
Climate change!
As if the Earth’s 4.5 billion year history is not one long record of climate change! As if there would be any life on Earth without carbon dioxide, the plant food of all vegetation that in turn sustains animal life.
Led by Joseph Bast, The Heartland Institute, a non-profit, free market think tank has been at the forefront of the battle for truth for many years. In 2008 and 2009, the Institute brought together the finest minds from the world of meteorology and climatology in conferences that were a marathon of scientific symposia that laid waste to the bogus claims of global warming.
I attended both conferences and had an opportunity to meet some of the “deniers”. In the beginning there were a handful such as Dr. Richard S. Lindzen, the Alfred P. Sloan Professor of Meteorology, Department of Earth, Atmospheric and Planetary Sciences at the Massachusetts Institute of Technology. He does not suffer fools easily.
Others who joined the struggle against an avalanche of lies about “global warming” included Drs. Patrick J. Michaels, Robert Balling, Tim Ball, and S. Fred Singer, an atmospheric physicist at George Mason University and founder of the Science and Environmental Policy Project, a think tank on climate and environmental issues.
There were other academics that included Dr’s Willie Soon, Joseph D’Aleo, Vincent Gray, and William Gray, all meteorologists and climatologists of international repute, as well as Howard Hayden, an Emeritus Professor of Physics.
In time, a handful of skilled science writers translated the data for the public. They include Christopher C. Horner, Marc Morano, Steven Milloy, Jay Lehr, and Paul Driessen. Dennis T. Avery, a senior fellow of the Hudson Institute, wrote articles that gained favor with the mainstream media and did much to undermine the global warming lies.
Think tanks such as The Heartland Institute, the Hudson Institute, the Competitive Enterprise Institute, and the Business & Media Institute all deserve praise for taking leading roles in disputing and debunking the global warming hoax.
Editor’s note: There are others unnamed for purposes of length, but who are no less deserving of honor.
The propaganda war to smear these men continues to this day. A favorite tactic to discredit them was to post “biographies” on Wikipedia suggesting they were all in the pay of corporations and could not be trusted.
The work of these think tanks and individuals is hardly over. The horrid “Cap-and-Trade” bill, its name changed in the Senate to deceive everyone into believing it’s about the foolishness of so-called “clean energy”, is a nightmare of taxation on energy use and a vast transference of billions to near useless “renewables” (solar and wind).
At the same time, access and use of America’s vast energy reserves of coal, natural gas, and oil continues to be denied by a Congress and administration that is hell bent on destroying the nation’s economy.
The “deniers” are being vindicated by Mother Nature. The truths they have been telling are showing up this year in America and around the world in early snowfalls, icy road conditions, and blizzards to come that will bring entire cities to a standstill. Spring and summer may be a little late in 2010.
In time, the “deniers” will be honored for their service to humanity, for their courage, and for hopefully saving this nation and others from the torrent of deceit coming out of the United Nations Intergovernmental Panel on Climate Change and every environmental organization in America and worldwide.
See more here.
As the alarmists stage their dramatic pretense at shock and surprise over what is widely being described as a revelation and conversion by South Carolina senator Lindsey Graham, readers of Red Hot Lies will recall the following passage that keeps things in perspective:
“In a March 2008 speech to the Nuclear Energy Institute [Graham] observed ‘The one way to gather support for nuclear energy is to embrace climate change because there’s no way anyone can deny nuclear’s place at the table as it provides a source of energy that doesn’t pollute the planet.’ Yes, Senator, they figured that out some time ago.”
Sen. Graham quite rightly seeks a path forward for the nuclear energy industry, victimized itself by environmental alarmism to the point that its future remained very much in doubt (an explanation for the nukes’ effort to ride this bandwagon, if the very opposite of an excuse). And this longtime sidekick of longtime cap-and-trade enthusiast Sen. John McCain sees a deal on cap-and-trade as that path forward.
Which is all that his current preening represents. To the extent it informs us of anything, it is about Senator Graham, not the merits of cap-and-trade.
AUSTRALIANS are warming to the idea of nuclear power, with almost one in two saying it should be considered as an alternative source of energy to help combat global warming. An Age/Nielson poll found 49 per cent of Australians believed nuclear should be on the nation’s list of potential power options, while 43 per cent were opposed outright. The finding marks a big shift of public opinion from 2006, when a Newspoll showed just 38 per cent in favour of nuclear power and 51 per cent opposed.
The survey came as political haggling in Canberra over emissions trading drew a sharp rebuke from former government climate adviser Ross Garnaut. ‘’This whole process of policymaking has been one of the worst examples of policymaking we’ve seen on major issues in Australia,’’ he said.
Despite the poll findings showing more support for nuclear power, the Rudd Government yesterday restated its total opposition to it as an option to help Australia meet its future carbon reduction targets. During the 2007 election campaign, after prime minister John Howard put nuclear power on the agenda, then opposition leader Kevin Rudd said: ‘’If you elect a Labor government, there will be no nuclear reactors in Australia, full stop.’’
Supporters of nuclear power say it is the only practical low-emissions alternative to coal for generating baseload electricity - the minimum required by industry and residential users. Arguments against focus on safety - the risk of accidents and the fact that radioactive waste must be stored securely for thousands of years. Opponents also say it would take too long develop a nuclear power industry.
Ziggy Switkowski, who chairs the Australian Nuclear Science and Technology Organisation, said: ‘’[We must] provide for the next generation of baseload electricity generation with clean energy. The only way to do that is with nuclear power.’’ Support for considering nuclear was strongest among Coalition supporters (58 per cent), and opposition was strongest among Greens voters (62 per cent). ALP voters were evenly divided, with 46 per cent in favour and 46 per cent opposed.
Survey respondents were told: ‘’The introduction of nuclear power has been suggested as one means to address climate change’’, and then asked: ‘’Do you support or oppose the Federal Government considering the introduction of nuclear power in Australia?’’
Federal Energy Minister Martin Ferguson restated the Government’s opposition to nuclear power. He also cast doubt on the viability of photovoltaic solar power as a future energy resource. He said the renewable sector kept falsely insisting it could be an alternative to coal as baseload power. But he believed solar thermal technology, which uses the sun’s heat to boil liquids to power turbines, was a more likely answer.
Victorian Energy Minister Peter Batchelor dismissed nuclear power as an option for the state. He said increased reliance on lower-emitting gas, clean coal and renewable energy sources were the way ahead. However, hopes for a cleaner future for Victoria’s power industry received a setback last month with the abandonment of a ‘’carbon capture’’ project at a proposed power station near Morwell, which instead is to become a gas-fired station. In another setback for the renewables sector, Solar Systems, which was to have developed a 154-megawatt solar photovoltaic power station near Mildura, was put into administration.
Meanwhile, the annual Lowy Institute poll has found that climate change is dropping as a priority for Australians. The poll, released today, found Australians have gone from ranking climate change in 2007 as the equal most important foreign policy goal to putting it seventh out of 10 possible goals. The issue fell 10 points since last year and 19 points from 2007.
Senator Xenophon said Treasury was acting politically. He said he could not support the Government’s scheme unless it included changes to the way the electricity sector was treated. There was a risk the Government’s model would cause energy security problems, including blackouts. The Seven Network reported an analysis commissioned by the NSW Government from Frontier last year on the Rudd Government scheme said that in the long term it could lead to real wages 8 per cent below the level they would otherwise reach, if long-run unemployment was to be avoided.
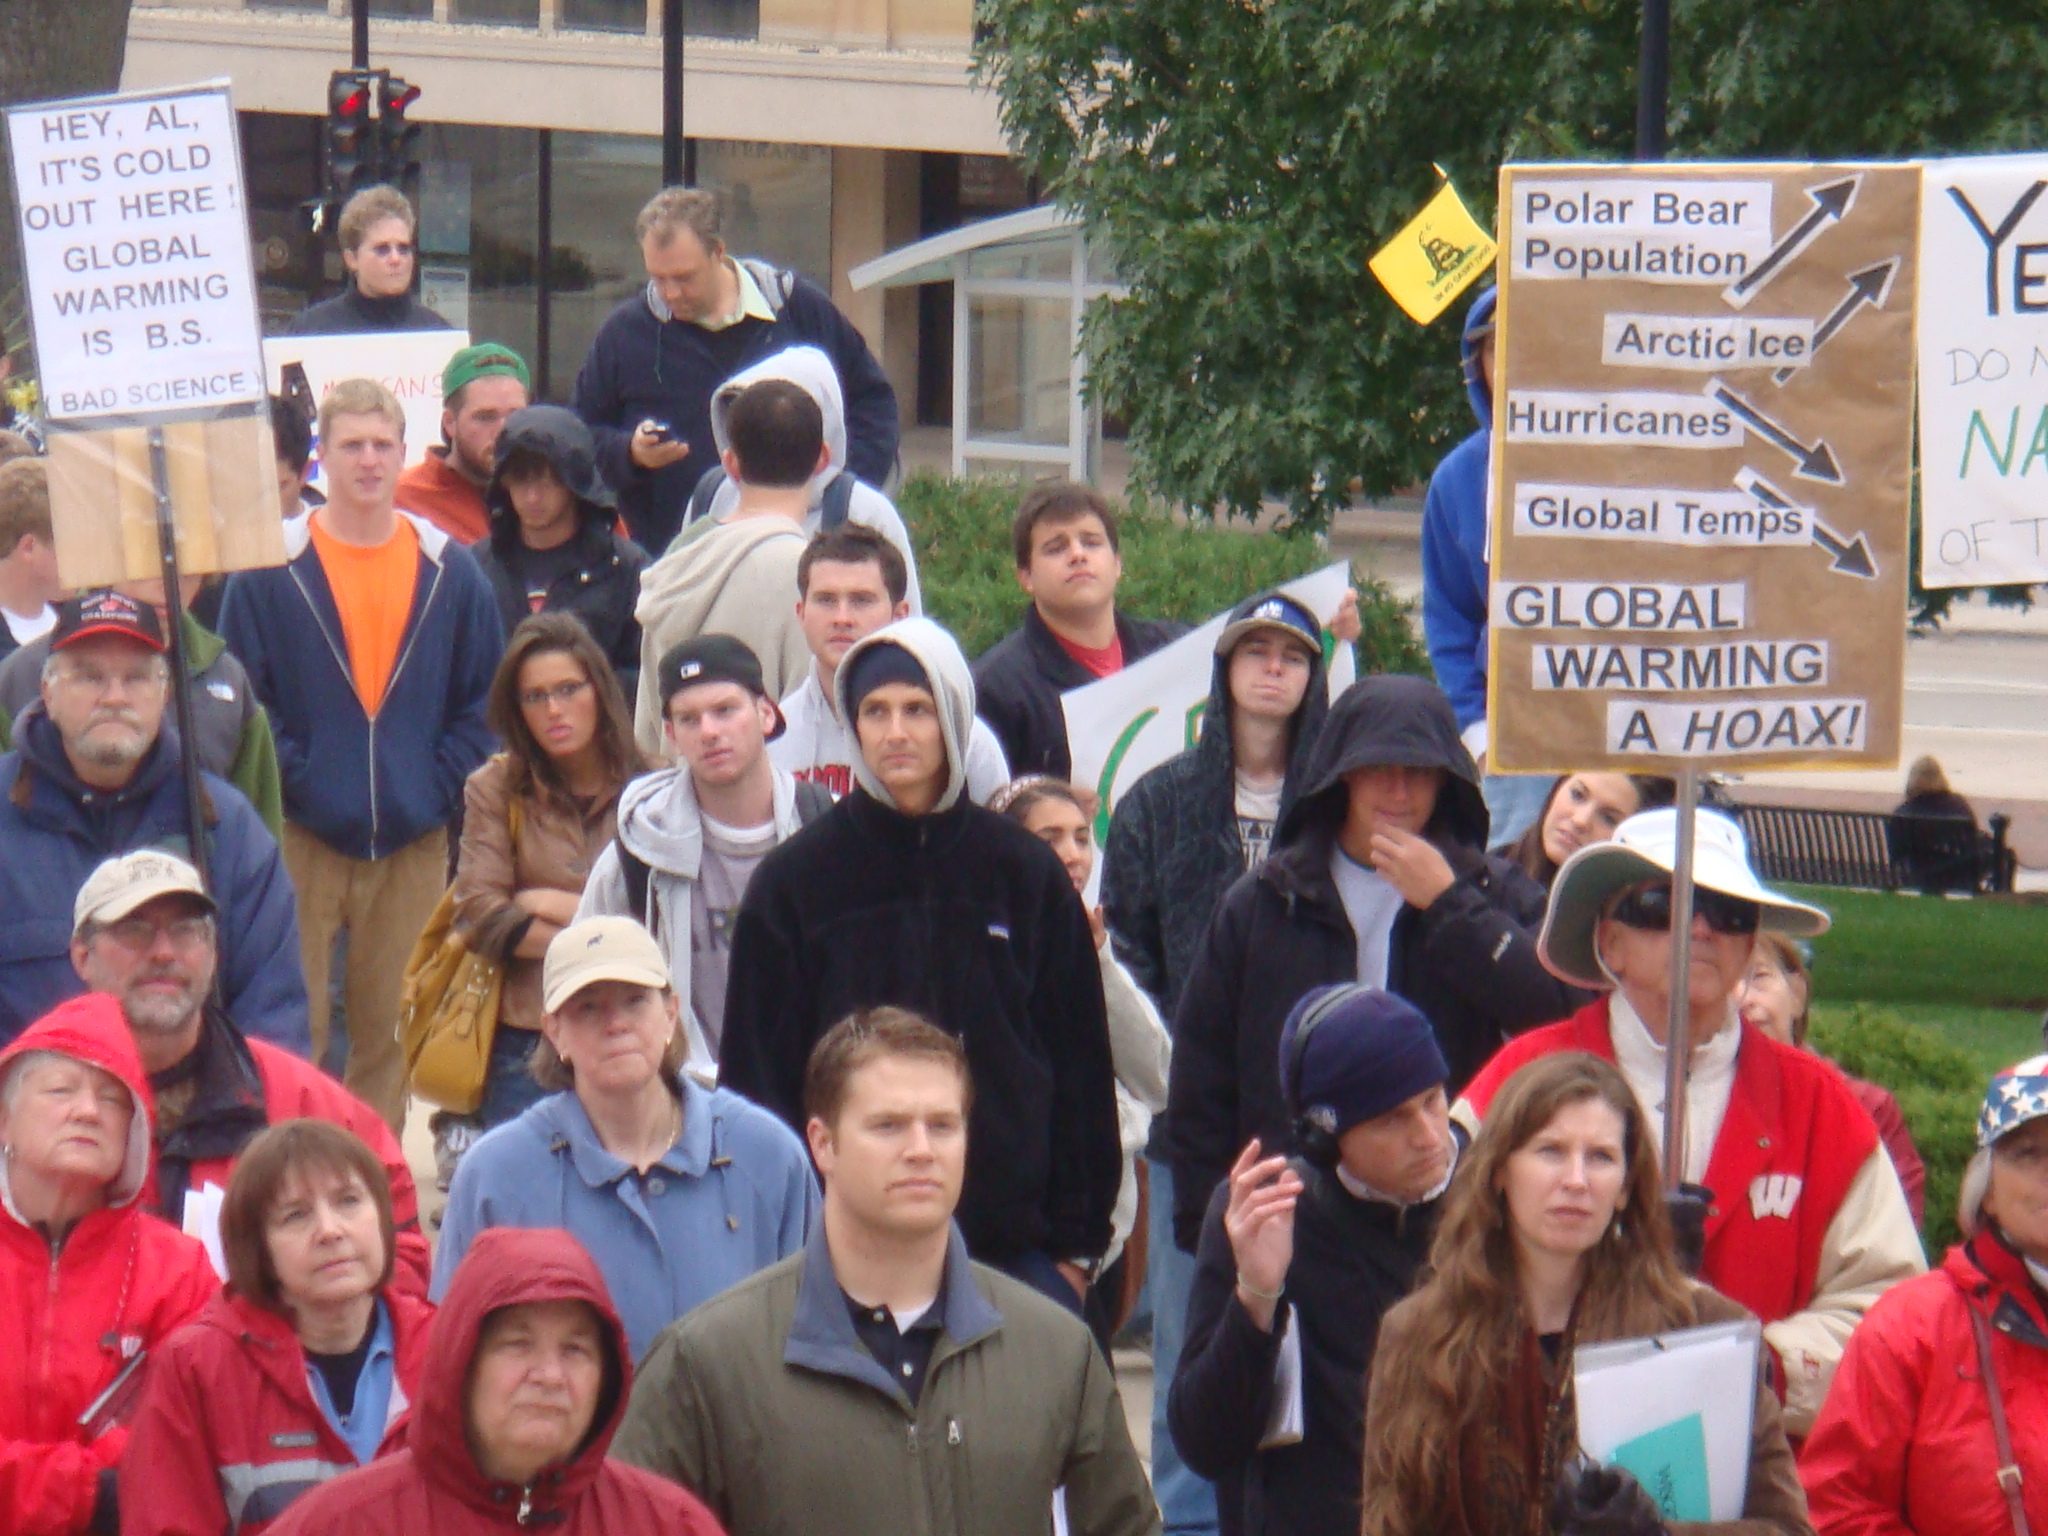
By Christina Wilson, Collegians for a Constructive Tomorrow
Madison, WI: October 10, 2009
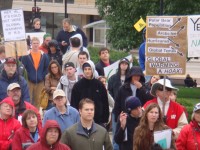
Today hundreds gathered in at the State Capitol in Madison, Wi to oppose Al Gore and his alarmist Climate Change policies. Despite the cold, an enthusiastic crowd gathered to send Al Gore a clear message: “Don’t Fry Our Economy!”
“It was an amazing turnout, even though rain and cold usually keeps people away. We were out to tell Al Gore and his friends that Cap and Trade will kill our economy, take jobs away, and tax American families out of their homes,” said UW CFACT president Alex Hansen.
Senator Glenn Grothman and Representative Jim Ott both spoke on the truth about climate change and the affect this legislation would have on Wisconsin families.
Congressman Jim Sensenbrenner, and Phelim McAleer (director of the film Not Evil Just Wrong) who were attending the conference Al Gore spoke at, dropped by to say hi to the friendly crowd and also comment on the devastation Cap and Trade will bring to the U.S. economy.
“People are concerned. These policies affect real human beings, real families. If enacted, especially globally, they will kill people. Countries cannot develop industry using solar and wind power alone. These policies will keep these countries back, and move the United States in the wrong direction for progress,” says CFACT Upper Midwest Director Christina Wilson.
Cap and Trade will cost over 1 million jobs average per year. These are American jobs that will not come back, they will be gone forever. Students at UW and members of the Madison community gathered to show their opposition to Cap and Trade. Chants of “Stop Cap and Trade” and “Save Our Jobs” echoed throughout the Capitol square. We hope this message reaches ears all over the U.S.
As yet another iteration of the GORE EFFECT, the first snowshowers of the season occurred on Saturday and temperatures dropped to 25 after Al’s talk. Al’s itinerary works better than the forecast and climate models. See more here.
See post here. See what happened when Phelim McAleer questioned Gore here. See Newsbusters recount of Gore’s non-answer and failed memory here.
I recently enjoyed a reunion of my University of Wisconsin undergraduate school roommates last month in beautiful northern Wisconsin. Here is a picture from way back in the middle of the last cold PDO. Yours truly bottom right.
In those frigid winters, we went ice boating on Lake Mendota. That is me on the left.
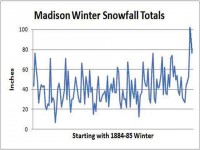
Madison has had two incredibly snowy winters the last two years in the new cold PDO, including the snowiest ever on record.


