The Chairman of the Carbon Sense Coalition, Mr Viv Forbes, today called for Liberals who oppose the ALP Ration-N-Tax Scheme Bill (the RATS Bill) to leave the Liberals and join the Nationals. Forbes explains:
“Barnaby Joyce has become the real leader of the Opposition and deserves to be supported. Malcolm Turnbull no longer serves liberal values and actually promotes the interests of big business mates who aim to do very well out of trading carbon credits. The Liberal leadership has lost all idea of their philosophical base and are now the paralysed party of the extreme centre. They should have learnt from the history of Don Chipp’s Democrats and The Australia Party that parties of the extreme centre end up standing for nothing and are abandoned by their supporters.”
‘The Liberal Party is now on that dead-end road. “Mr Turnbull should also ponder the philosophical goals of the deep green zealots who promote the Green Religion. He will find them consistent with the philosophies of Mao and Stalin, and totally opposed to the beliefs of freedom supporters such as Menzies, Thatcher and Reagan. Once our Parliaments held people like Bert Kelly and John Hyde of the Liberals and Peter Walsh and Michael Costa of the ALP who supported the freedom philosophy for both business and workers. Today, liberty finds few friends in Parliament.
“Mr Turnbull determines his policies by “Business Feedback”. He should talk to more than organisations such as the Business Council of Australia, where 60% of the membership has no direct carbon tax liability and many of them expect to benefit greatly by participating in the new Bubble Business to be created from trading hot air certificates. “Big banks, national law firms, transnational accounting firms, Wall Street traders and the merchant bank millionaires are not the real industry of Australia - they are the froth and bubble floating on the real rivers of productive industry.
“Since the days of the Wool Boom and the Gold Rush, Australian prosperity has always rested on the primary wealth created by its outback industries. Mr Turnbull needs to pull on his RM Williams boots, don a hard hat and venture out of the air conditioning to find the opinion of the real businesses of Australia. He should talk to farmers and graziers, fishermen and foresters, miners and explorers, those who process our minerals and food into things of real value, and those who run the trucks, trains and planes that keep the swarming cities functioning.
“Far from the genteel cocktail circuit of the Sydney-Melbourne Clubs, the Nationals have sensed the growing grassroots revolt against the Rudd road to carbon penury. They have done what every good politician does - find out where the people are heading and jump in front calling “Follow Me”. Many others will now join that revolt.
“Barnaby Joyce is right. The RATS Bill cannot be made acceptable - it must be destroyed in the Senate.”
Here is how they plan to turn up the heat. We can model our efforts to theirs. Recall they were able to defeat the bill the first time through their senate.
There has been much press and advertising lately about “green jobs” being, or about to be, created by construction of wind farms and other renewable energy sources. President Barack Obama, in fact, has used Spain as a model for pursuing sustainable energy projects.
But for every four green jobs created in Spain, less than one was made permanent, according to a study released by Spain’s Universidad Rey Juan Carlos in March 2009. Spain’s experience also shows for every permanent green job created, nine permanent jobs were destroyed. Creating green jobs, then, is touted as a “Bridge to the Future,” but it looks like a “Bridge to Nowhere.”
Maine faces a similar, if not more tenuous, situation than Spain. A report released last week by the American Center for Capital Formation noted that Maine could face an additional 6,000 to 9,000 job losses if federal “cap and trade” legislation is passed, the mechanism by which many of these green jobs will be created. Cap and trade, essentially, would tax emitters of carbon dioxide, and use the revenue - about $15 billion - to fund renewable, sustainable energy development.
Maine’s most recent unemployment figures say there are about 59,000 now, up from 37,000 a year earlier. There are approximately 700,000 people total in Maine’s workforce, for an unemployment rate of around 8.4 percent. Passing cap and trade could drive Maine’s unemployment rate above 10 percent, adding about 7,500 to the ranks of the unemployed.
To do this in a deliberately destructive government policy would be simply unacceptable. Cap and trade legislation that uses Spain as a model for the United States will be considered this fall by the Senate. Reps. Chellie Pingree and Mike Michaud have already voted yes on such legislation, earlier this summer.
Heavy electricity users like L.L. Bean, National Semiconductor, Fairchild, IDEXX, and others could face steep increases in energy costs in the near future, if this legislation is passed. Their employees would face further downsizing, or cuts in benefits, as new rules are implemented.
These companies already are dealing with higher than average electricity costs, because of legislation like the Regional Greenhouse Gas Initiative passed a few years ago. The United States could also face a situation where much of our steel, aluminum and metallurgy - which takes a great deal of electricity - would be outsourced to countries like Brazil, China and Australia, which are opting-out of such economically destructive policies.
The report on Spain’s experience noted that tax credits, government debt, and electricity rate increases were used to spur development of renewable or sustainable energy sources. This is just like the Obama administration and organizations like the Natural Resources Council of Maine are pushing in Maine.
The intentional misallocation of societal resources in the form of tax credits for construction, higher utility costs, and government debt, have put Spain behind in the race for new and innovative ways to solve the energy demand, and in the ability to recover from the current recession.
For every megawatt of wind-power constructed, permanent back-up power sources are needed. Wind and solar power are not reliable electricity producers. They are kind of like alcoholics in the workforce - always calling in sick just when you need them, forcing more reliable workers to pick up the slack.
Spain’s experience also showed that spending societal resources on wind power actually increased its carbon-footprint. Ironically, Spain’s annual emissions of carbon dioxide have increased by nearly 50 percent since the launch of the subsidized “green jobs” program, as noted recently by the Institute for Energy Research, the U.S. Energy Information Administration (EIA). Conventional fossil fuel energy sources were needed to keep electricity flowing when the wind abated.
Groups like the NRCM claim, “Wind power emits no mercury, no air pollution, no carbon dioxide, no need to mine coal, and alleviate the demand for natural gas!” But the experiences of countries that have actually invested heavily in wind power like Spain, Germany, and Denmark prove the opposite.
The National Post has reported, “Denmark, the most wind intensive country with 6000 turbines generating 19% of electricity from wind power, they have not been able to close one fossil fuel plant and to their dismay, 50% more electricity was needed to cover wind’s unpredictability, and CO2 emissions rose 36%.”
“Niels Gram of the Danish Federation of Industries says, “windmills are a mistake and economically make no sense.” Aase Madsen, the Chair of Energy Policy in the Danish Parliament, calls it “a terribly expensive disaster.”
“The German experience is no different,” reported the National Post. Der Spiegel reported that “Germany’s CO2 emissions haven’t been reduced by even a single gram,” and additional coal and gas-fired plants have been constructed to ensure reliable delivery.”
So, if wind power does not decrease the use of coal or gas, does not decrease CO2 emissions, does not produce permanent job gains, and in fact destroys jobs, increases electricity costs, and increases CO2 production, what does it do?
One begins to wonder if cap and trade is the equivalent of economic self-mutilation. See post here
The guys over at Chilling Effect offer their take on the U.S. Chamber of Commerce’s wonderful petition of the EPA demanding a bit of a trial on the premise for its “endangerment” finding that anthropogenic global warming (AGW) is real, threatening, and proven - or sufficiently proven to justify regulation, even if nothing the U.S. can do through regulation would do anything about the purported warming.
The EPA is of course ducking the opportunity to finally and for the first time make its case. To this point, they have appealed to authority of the IPCC, which says on its web page that it doesn’t perform any research. That should tell you as much as you need to know about their confidence in the case: it’s nonexistent, and they are filled with terror over the thought of having to defend their stance.
The beauty of the regulatory process for them is the presumption, or “deference,” granted whatever they do. They lose that in a trial, and as a matter of substance, cannot make up for it. I made this case in my comments to the EPA on its recent Clean Air Act finding, and focused on the inescapable fact that the proposed regulatory (and in fact legislative) agenda is premised on rigged and scientifically unsupportable computer-model projections, which are proven wrong by observations.
They can’t win, which is why they don’t fight. They are cowards, and the more hysterical and threatening their rhetoric gets in the face of this refusal, the more they prove far too much. The public needs to get the Republican opposition to learn to shoot straight and guarantee that this is an issue in the 2010 elections: promise a vote under the Congressional Review Act to veto any executive-branch effort to slip this agenda into place. At a recent Senate Foreign Relations Committee hearing, even Richard Lugar vowed support for a measure telling the EPA that it cannot get away with this without Congress having clearly stated that it may, as opposed to leveraging some 5-4 SCOTUS majority to conjure the authority (in what Justice Scalia accurately noted in his dissent was a predetermined conclusion).
Come on, EPA. You say there is overwhelming evidence for AGW. Fight. Put the skepticism to bed. Or don’t, and give anyone who cares every reason they need to question - and reject - your attempt to ram through the agenda without making your case. Read post here.
As reported in The New York Times, 25 August 2009 by Michael Burnham of ClimateWire here, the nation’s largest business group is asking U.S. EPA to hold a public debate on climate change science—or face litigation—as the agency prepares to regulate greenhouse gas emissions under the Clean Air Act.
In April, EPA said it planned to declare that emissions of carbon dioxide, methane, nitrous oxide, hydrofluorocarbons, perfluorocarbons and sulfur hexafluoride from new automobiles and their engines contribute to air pollution that endangers public health and welfare. The proposal, which does not include any regulations, comes in response to the Supreme Court’s 2007 Massachusetts v. EPA ruling.
The U.S. Chamber of Commerce filed a 21-page petition with EPA today, asking the agency to approve an on-the-record proceeding with an independent trier of fact who would allow EPA and environmental and business groups to engage in a “credible weighing” of the scientific evidence that global warming endangers human health.
EPA has hosted two public hearings and received more than 300,000 public comments on the matter already.
“They don’t have the science to support the endangerment finding,” Bill Kovacs, the chamber’s vice president for environment, regulatory and government affairs, said in an interview. “We can’t just take their word for it.”
Kovacs envisions the EPA proceeding as a modern-day “Scopes Monkey Trial,” where the science of global warming—rather than evolution versus creationism—would be debated. The 1925 trial, which pitted prominent defense attorney Clarence Darrow against three-time presidential candidate Williams Jennings Bryan, centered on the prosecution of John Scopes for violating a Tennessee law by teaching evolution in a high school classroom.
Much is at stake in the modern climate change debate. Declaring greenhouse gases as pollutants from automobiles would trigger Clean Air Act regulation of other emission sources, such as power plants and oil refineries, Kovacs said.
“An endangerment finding would make EPA the regulator of the U.S. economy,” he warned.
Roger Pielke Sr. has posted on the EPA action in this post on his Climate Science blog here.
There was a news article in the LA times on August 25 2009 by Jim Tankersley entitled “U.S. Chamber of Commerce seeks trial on global warming”. “The U.S. Chamber of Commerce, trying to ward off potentially sweeping federal emissions regulations, is pushing the Environmental Protection Agency to hold a rare public hearing on the scientific evidence for man-made climate change.”
I do not know if a “trial” is effective, however, it is certainly clear that the EPA ruling is scientifically very flawed, as I wrote in a series of posts:
“In conclusion, the EPA Endangerment findings is the culmination of a several year effort for a small group of climate scientists and others to use their positions as lead authors on the IPCC, CCSP and NRC reports to promote a political agenda. Now that their efforts have reached the federal policy decision level, Climate Science urges that there be an independent commission of climate scientists who can evaluate the assessment process that led to the EPA findings as well as the climate science upon which it is constructed.” The Chamber of Commerce statement further documents that independent assessments of the EPA findings are required.
--------------------
Meanwhile see “The White House muzzles a global warming skeptic” in this Washington Times story called Bury the Messenger.
If you can’t muzzle the whistleblower, try to marginalize him. That seems to be the strategy of the Obama administration, which is showing that its commitment to liberal ideology trumps its pledge to foster open government.
In June, the Competitive Enterprise Institute made waves by releasing internal e-mails from the Environmental Protection Agency. In those messages, a top administrator told a key researcher that the researcher’s new report would not be released. Why? Because it does “not help the legal or policy case” for a controversial decision to treat global warming as a health hazard. In short, because researcher Alan Carlin’s conclusions differed from the administration’s political agenda, his research was ignored.
Mr. Carlin, who holds a doctorate in economics with an undergraduate degree in physics, examined numerous studies on global warming. His scorching message to his political bosses at EPA: “I have become increasingly concerned that EPA has itself paid too little attention to the science of global warming. EPA and others have tended to accept the findings reached by outside groups… as being correct without a careful and critical examination.” That examination shows, Mr. Carlin said, that “available observable data… invalidate the hypothesis” that humans cause serious global warming.
With the administration so heavily invested in a regulatory scheme to combat supposed warming, this message was far from welcome. Hence the effort to bury the report, an effort that was thwarted when Mr. Carlin posted the report on a personal Web site.
The administration struck back. Mr. Carlin works for the EPA’s National Center for Environmental Economics. On Friday, Inside Washington Publishers reported that “Obama EPA officials are said to be considering scrapping” the center’s role in scientific analysis. Never mind the reality that doing so would undermine the entire reason for its existence, namely (citing the article) “researching environmental health issues to improve risk assessment data used in economic analyses for [new regulatory] rules.”
If the office can’t analyze the science in order to determine a regulation’s economic effects, it won’t have any basis for figuring out those effects. Hiding scientific research is not what Americans expect from a president who boasted that his administration would “restore science to its rightful place.” And for a president who promised to “strengthen whistleblower laws,” this attempt to marginalize a true whistleblower smacks of insincerity. Its implications for economic and environmental policy are dangerous.
See this video response by Carlin to this EPA action (below and enlarged here):
Read much more on this and why its the global warminista’s greatest fear here.
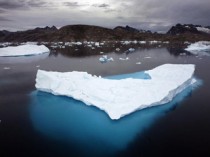
Global warming alarmists have suggested that the ice sheets of Greenland and Antarctica may collapse, causing disastrous sea level rise. This idea is based on the concept of an ice sheet sliding down an inclined plane on a base lubricated by meltwater, which is itself increasing because of global warming.
In reality the Greenland and Antarctic ice sheets occupy deep basins, and cannot slide down a plane. Furthermore glacial flow depends on stress (including the important yield stress) as well as temperature, and much of the ice sheets are well below melting point. The accumulation of kilometres of undisturbed ice in cores in Greenland and Antarctica (the same ones that are sometimes used to fuel ideas of global warming) show hundreds of thousands of years of accumulation with no melting or flow. Except around the edges, ice sheets flow at the base, and depend on geothermal heat, not the climate at the surface.
It is impossible for the Greenland and Antarctic ice sheets to ‘collapse’. In these days of alarmist warnings about climate warming, the ice sheets of Greenland and Antarctica have an important role. Many papers have described their melting at the present times, and dire predictions of many metres of sea level rise are common. Christoffersen and Hambrey published a typical paper on the Greenland ice sheet in Geology Today in May, 2006.
Their model, unfortunately, includes neither the main form of the Greenland Ice Sheet, nor an understanding of how glaciers flow. They predict the behaviour of the Ice Sheet based on melting and accumulation rates at the present day, and the concept of an ice sheet sliding down an inclined plane on a base lubricated by meltwater, which is itself increasing because of global warming. The same misconception is present in textbooks such as The Great Ice Age (2000) by R.C.L. Wilson and others, popular magazines such as the June 2007 issue of National Geographic, and other scientific articles such as Bamber et al. (2007), which can be regarded as a typical modelling contribution. The idea of a glacier sliding downhill on a base lubricated by meltwater seemed a good idea when first presented by de Saussure in 1779, but a lot has been learned since then.
In the present paper we shall try to show how the mechanism of glacier flow differs from this simple model, and why it is impossible for the Greenland and Antarctic Ice Sheets to collapse. To understand the relationship between global warming and the breakdown of ice sheets it is necessary to know how ice sheets really work. Ice sheets do not simply grow and melt in response to average global temperature. Anyone with this naïve view would have difficulty in
explaining why glaciation has been present in the southernn hemisphere for about 30 million years, and in the northern hemisphere for only 3 million years.
Conclusion
The global warming doomsday writers claim the ice sheets are melting catastrophically, and will cause a sudden rise in sea level of many metres. This ignores the mechanism of glacier flow which is by creep: glaciers are not melting from the surface down, nor are they sliding down an inclined plane lubricated by meltwater. The existence of ice over 3 km thick preserving details of past snowfall and atmospheres, used to decipher past temperature and CO2 levels, shows that the ice sheets have accumulated for hundreds of thousands of years without melting. Variations in melting around the edges of ice sheets are no indication that they are collapsing. Indeed ‘collapse’ is impossible. Read PDF here.
Icecap Note: See this powerful video in which Gerd Leipold, the outgoing leader of Greenpeace, admitted that his organization’s recent claim that the Arctic Ice will disappear by 2030 was “a mistake.”
The coverage has exposed hundreds of thousands of people to one small kernel of truth about global warming hysteria, but that’s just a start. All of those people, and millions more, need to see “Not Evil Just Wrong” to absorb the depth of the deception by radical environmentalists. See more on this here.