Aug 31, 2010
How Harvard’s Code of Ethics Differs from UVA and Penn State with respect to Michael Mann
By Charles Battig, MD
An insight into the apparent difference in how “scientific misconduct” at Harvard University is handled, and how it has been handled at Penn State and the University of Virginia in the matter of climatologist Michael Mann is now available.
Harvard professor of psychology Marc Hauser was found “solely responsible for eight instances of scientific misconduct” involving the “data acquisition, data analysis, data retention, and the reporting of research methodologies and results” according to the August 20, 2010 statement by Harvard dean Michael D. Smith. This finding was issued based on a faculty investigating committee study. The report noted that it began with an “inquiry phase” in response to “allegations of scientific misconduct.” It seems that there were allegations of “monkey business” in his research on monkey cognition. Three papers by Hauser, presumably peer reviewed, will need to be corrected or retracted according to Dean Smith. The academic fate of the professor is yet to be decided.
In contrast, the two reviews of the behavior of climatologist Michael Mann at Penn State seemed primarily focused on his data housekeeping habits and openness to sharing his data and analysis methodology. He was found to have acted within the ‘accepted practices within the scientific community for proposing, conducting, or reporting research.” The issues of data acquisition and analysis validity were not pursued; the number of awards and publications Mann received was cited as evidence of the validity of his work.
At the University of Virginia an “inquiry phase”, such as noted in the Harvard protocol, was initiated by Virginia Attorney General Ken Cuccinelli into the possible misuse of public funds by Mann in his pursuit of employment by the University and his use of such funds in his research activities there. Virginia state law gives wide discretion to the AG in the initiation of investigations into suspected misuse of state funds. This request was met with claims of impingement on sacred academic freedom, and chilling the environment for academic research in general by the university and its various supporters. Rather than welcome the chance to dispel the suspicion of scientific misconduct and protect its academic reputation, the university enlisted a high powered D.C. legal team to fight the AG request in court.
While this legal process plays out, the court of public opinion must wonder why the openness and direct dealing with such allegations exhibited by Harvard is not the model for the University of Virginia. Harvard is shown to be a scientifically open and self policing university; UVa is hiding behind its self -righteous claims of academic freedom and legal barricades. Whose research will the public more likely trust?
Charles Battig, M.D.
President, Piedmont Chapter
Virginia Scientists and Engineers for Energy and Environment
Charlottesville, VA
Aug 31, 2010
11 Year Cycle in Hot Summers
By Joseph S. D’Aleo, CCM
We have seen hot summers in 1933, 1944, 1955, 1966, 1977, 1988, 1999, 2010. Notice a pattern? The years are 11 years apart.
This 11 year cycle may be a coincidence but if so a 1 in 256 chance one. In some years the heat was concentrated in one month (1966 it was July), in others it was throughout.
What else has an 11 year cycle? - the sun of course. The solar cycles average 11 years. When new solar cycles begin the new spots are in higher solar latitudes and gradually move equatorward. During transitions you typically have old cycle spots near the equator and new cycle spots at higher latitudes.
The 11 years above have been during these transitions. A coincidence? We’ll leave it to our solar expert readers to speculate whether this is solar driven and possible mechanisms. Other common elements in some of the years include an El Nino winter giving way to a La Nina summer and strong rebound from a very negative winter negative Arctic Oscillation (AO) pattern.
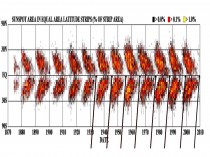
See so-called butterfly diagram with positions of sunspots by year enlarged here.
Compositing those years gives you this warm summer signal.
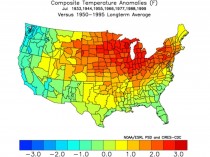
See enlarged here.
The actual anomalies through August 30 showed the warmth further south. This may be because of a continuation of strong high latitude blocking (negative NAO) as evidenced by the warmth in northeast Canada.
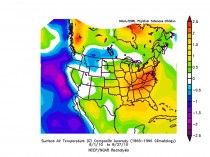
See enlarged here.
Indeed a plot of the daily NAO as obtained from NOAA CPC shows a predominant negative NAO. This forces everything else further south in North America and the Atlantic.
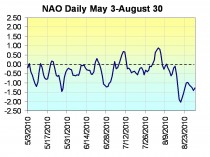
See enlarged here.
In July, a negative NAO means a hot southeast. By winter, it means cold.
A continuation of this blocking may make the upcoming La Nina winter more interesting. The winters tend to be cold in the west and north, warmer in the southeast. See more here.
Aug 30, 2010
Himalayan glaciers melting deadline ‘a mistake’
By Pallava Bagla in Delhi
The UN panel on climate change warning that Himalayan glaciers could melt to a fifth of current levels by 2035 is wildly inaccurate, an academic says.
J Graham Cogley, a professor at Ontario Trent University, says he believes the UN authors got the date from an earlier report wrong by more than 300 years.
He is astonished they “misread 2350 as 2035”. The authors deny the claims.
Leading glaciologists say the report has caused confusion and “a catalogue of errors in Himalayan glaciology”.
The Himalayas hold the planet’s largest body of ice outside the polar caps - an estimated 12,000 cubic kilometres of water.
They feed many of the world’s great rivers - the Ganges, the Indus, the Brahmaputra - on which hundreds of millions of people depend.
‘Catastrophic rate’
In its 2007 report, the Nobel Prize-winning Inter-governmental Panel on Climate Change (IPCC) said: “Glaciers in the Himalayas are receding faster than in any other part of the world and, if the present rate continues, the likelihood of them disappearing by the year 2035 and perhaps sooner is very high if the Earth keeps warming at the current rate.
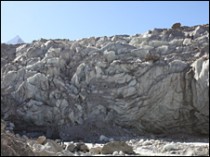
It is not plausible that Himalayan glaciers are disappearing completely within the next few decades
Himalayan glaciers’ ‘mixed picture’
“Its total area will likely shrink from the present 500,000 to 100,000 square kilometres by the year 2035,” the report said.
It suggested three quarters of a billion people who depend on glacier melt for water supplies in Asia could be affected.
But Professor Cogley has found a 1996 document by a leading hydrologist, VM Kotlyakov, that mentions 2350 as the year by which there will be massive and precipitate melting of glaciers.
“The extrapolar glaciation of the Earth will be decaying at rapid, catastrophic rates - its total area will shrink from 500,000 to 100,000 square kilometres by the year 2350,” Mr Kotlyakov’s report said.
Mr Cogley says it is astonishing that none of the 10 authors of the 2007 IPCC report could spot the error and “misread 2350 as 2035”.
“I do suggest that the glaciological community might consider advising the IPCC about ways to avoid such egregious errors as the 2035 versus 2350 confusion in the future,” says Mr Cogley.
He said the error might also have its origins in a 1999 news report on retreating glaciers in the New Scientist magazine.
The article quoted Syed I Hasnain, the then chairman of the International Commission for Snow and Ice’s (ICSI) Working group on Himalayan glaciology, as saying that most glaciers in the Himalayan region “will vanish within 40 years as a result of global warming”.
Scientists say Himalayan glaciers need more study
When asked how this “error” could have happened, RK Pachauri, the Indian scientist who heads the IPCC, said: “I don’t have anything to add on glaciers.”
The IPCC relied on three documents to arrive at 2035 as the “outer year” for shrinkage of glaciers.
They are: a 2005 World Wide Fund for Nature report on glaciers; a 1996 Unesco document on hydrology; and a 1999 news report in New Scientist.
Incidentally, none of these documents have been reviewed by peer professionals, which is what the IPCC is mandated to be doing.
Murari Lal, a climate expert who was one of the leading authors of the 2007 IPCC report, denied it had its facts wrong about melting Himalayan glaciers.
But he admitted the report relied on non-peer reviewed - or ‘unpublished’ - documents when assessing the status of the glaciers.
‘Alarmist’
Recently India’s Environment Minister Jairam Ramesh released a study on Himalayan glaciers that suggested that they may be not melting as much due to global warming as it is widely feared.
He accused the IPCC of being “alarmist”.
India says the rate of retreat in many glaciers has decreased in recent years
Mr Pachauri dismissed the study as “voodoo science” and said the IPCC was a “sober body” whose work was verified by governments.
But in a joint statement some the world’s leading glaciologists who are also participants to the IPCC have said: “This catalogue of errors in Himalayan glaciology… has caused much confusion that could have been avoided had the norms of scientific publication, including peer review and concentration upon peer-reviewed work, been respected.”
Michael Zemp from the World Glacier Monitoring Service in Zurich also said the IPCC statement on Himalayan glaciers had caused “some major confusion in the media”.
“Under strict consideration of the IPCC rules, it should actually not have been published as it is not based on a sound scientific reference.
“From a present state of knowledge it is not plausible that Himalayan glaciers are disappearing completely within the next few decades. I do not know of any scientific study that does support a complete vanishing of glaciers in the Himalayas within this century.”
Pallava Bagla is science editor for New Delhi Television (NDTV) and author of Destination Moon - India’s quest for Moon, Mars and Beyond.
Aug 30, 2010
Blame Lies With Sun, Not Global Warming
By Julian Morris, Moscow Times
Millions are suffering and thousands have died from flooding in Pakistan and China. An extraordinary heat wave in Russia sparked fires that caused dreadful pollution and wiped out swathes of the wheat crop. Are these weather-related disasters caused by global warming?
In its most recent report, the UNís Intergovernmental Panel on Climate Change asserts that as the world becomes warmer, “flood magnitude and frequency are likely to increase in most regions.” This seems plausible. A warmer world is also likely to be a wetter world, as more water evaporates from the oceans into the atmosphere. But, although rainstorms put out some of the fires, Russia has a drought.
The UN panel also claims that droughts are more likely in a warmer world - and that they have become more frequent since the 1970s, partly because of reduced precipitation. In fact, the number of droughts reached a low point between the mid-1970s and mid-1980s. Evidence shows that there has been no statistically significant increase in droughts since the 1950s. Given that global temperatures appear to have risen considerably since then, it seems a stretch to blame the Russian drought on global warming.
Underpinning both the floods in Pakistan and China and the drought in Russia is a change in the usual pattern of the jet stream. Each hemisphere has a “polar” jet (seven to 12 kilometers above sea level) and a “subtropical” jet (at 10 to 16 kilometers). In the northern hemisphere, the polar jet pushes cooler air south and induces rain in mid-latitudes, while the subtropical jet pushes warm air north. But in mid-June, a kink appeared at the intersection, causing warm air to remain further north and east than normal and causing more cold air and rain to fall over northern Pakistan and China.
To make matters far worse, this kink in the jet stream was kept in place by a phenomenon called a “blocking event.” This kept the Russian heat wave going for nearly two months and massively exacerbated the precipitation in Pakistan and China.
Such blocking events are rare, and there is no evidence of links with global warming. However, an explanation has been proposed by Professor Mike Lockwood, an astrophysicist at the University of Reading in Britain, who shows in a recent paper that blocking events in the winter are related primarily to solar activity. (Although he cautiously said in an e-mail to me that he “cannot say much (yet) about summer conditions as most of our work to date has been on wintertime, which shows relatively strong solar effects in the Eurasian region").
So the culprit is quite possibly the sun, not human emissions of greenhouse gases.
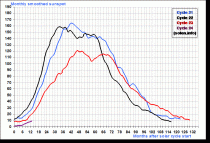
Comparison of the last four solar cycles, note how cycle 23 was long and our recovery out of it into cycle 24 very slow. This is more like the cycles in the early 1900s and especially the early 1800s.
As for remedies, the current disasters demand a major humanitarian response. Worst affected is Pakistan, where an estimated 6 million people face cholera and other waterborne diseases unless they urgently get potable water. Pakistanís government responded slowly, making immediate national and international philanthropy even more important.
But what of the longer term? Floods, droughts and other weather disasters have plagued mankind for all of history. But deaths from such natural disasters have fallen by more than 90 percent in the past 100 years despite dramatic population growth. Why? Because higher wealth and better technology enable people better to cope. This is a silver lining to this summer’s natural disasters. See post here.
Julian Morris is a visiting professor at the University of Buckingham and executive director of International Policy Network, London, an independent economic think tank. Richard Lourie will return to this spot in September.
Aug 29, 2010
Al Gore’s global-warming crusade shrinks
By Matt Patterson, Washington Times
Poor Al Gore. As if an im- pending divorce and allegations of sexual misconduct from an Oregon masseuse weren’t bad enough (he has since been cleared of wrongdoing), the apparent collapse of “cap-and-trade” legislation in the U.S. Senate has driven the former vice president to despair.
As reported by Steve Milloy on his blog Green Hell, Mr. Gore recently admitted to supporters in a conference call, “[T]his [cap-and-trade] battle has not been successful and is pretty much over for this year.” Mr. Gore blamed everyone and their monkey for the failure of Congress to pass comprehensive climate legislation, including his former colleagues: “The U.S. Senate has failed us,” he lamented, “the federal government has failed us.”
The fortunes of Mr. Gore’s global-warming crusade certainly are in decline: A recent Rasmussen poll found that just 34 percent of respondents “feel human activity is the main contributor” to global warming and that the percentage of those who consider global warming a “serious issue” has “trended down slightly since last November.”
Mr. Gore himself is to blame for at least some of the public backlash against global-warming orthodoxy: Using bad science to justify bad policy will inevitably rub people the wrong way. And Mr. Gore has not helped his cause by consistently expressing outrageous falsehoods ("the debate is over") and shamelessly trying to shield his assertions from legitimate criticism by claiming “settled science.” All the while, he has enriched himself and pushed a left-wing economic agenda.
Take, for example, the infamous “hockey stick” graph, a version of which was featured prominently in Mr. Gore’s documentary “An Inconvenient Truth.” The graph appeared to show global temperatures relatively flat for a millennium and then suddenly spiking upward in the late 20th century - proof, according to Mr. Gore and his acolytes, of man-made global warming caused by industrial carbon emissions.
Temperature records for the past century are based on instrumental data: thermometers, satellites, etc. For prior centuries, however, scientists rely on proxy data; in the case of the original hockey-stick graph, researchers relied on tree rings. But as Roy Spencer, former senior scientist for climate studies at NASA’s Marshall Space Flight Center, writes in “The Great Global Warming Blunder,” “the most recent tree-ring data do not even show the warming that occurred in the second half of the 20th-century, but appear to indicate a cooling instead.” Because tree rings do not show the recent warming that we know occurred, it follows that tree rings are not an adequate proxy by which we can accurately gauge past temperatures.
The unreliability of tree-ring data has long been known. Nevertheless, the hockey-stick graph was embraced enthusiastically by Mr. Gore and the global-warming crowd, for it conveniently dispensed with two significant climate events: the Medieval Warm Period (10th to 13th centuries) and the Little Ice Age (14th to 19th centuries). The former saw temperatures in the North Atlantic warm enough that vikings could settle and flourish in a lush Greenland, the latter temperatures so low that people routinely ice-skated on a frozen River Thames. Both of these climate events, for which there are masses of historical evidence, began before the Industrial Revolution and therefore are unattributable to man-made carbon emissions.
That’s why the global-warming crowd was so desperate to hide them: If people realize that temperature fluctuations occur naturally and cyclically, they are less likely to embrace the draconian, job-killing energy taxes favored by Mr. Gore and his ilk as punishment for their own carbon sins.
The hockey stick conveniently hid this natural temperature variation - for a while. Fortunately, thanks largely to the tireless work of independent researchers Steve McIntyre and Ross McKitrick, the flaws in the statistical methodology used to create the various hockey-stick graphs have received widespread attention, and the once-iconic symbol of global warming has since been largely marginalized in the climate-change debate.
But not before it helped Al Gore to earn an Academy Award, a Nobel Peace Prize and an undeserved reputation as a scientific guru. As The Washington Post once noted of Mr. Gore’s academic credentials: “For all of Gore’s later fascination with science and technology, he often struggled academically in those subjects. The political champion of the natural world received [a] sophomore D in Natural Sciences 6 ... and then got a C-plus in Natural Sciences 118 his senior year.”

Imagine: We nearly let this former politician, who barely passed sophomore science at Harvard, persuade us to acquiesce to the monstrous statism of cap-and-trade, which would have resulted in higher energy and food prices and imposed yet another economic hardship on the poorest members of our society. All in the name of bad science.
Shame on him. And thank God he failed.
Matt Patterson is editor of Green Watch, a publication of the Capital Research Center.
|


