Nov 22, 2012
By Benghazi Illogic, Try This: “CIA Finds Hurricane Sandy Caused By Obscure Anti-Gore Movie”
Larry Bell
Well, ok...they didn’t come right out and say that, because, as you know, a lot of that intelligence is classified. But c’mon people! Wake up and smell the latte! We’re witnessing a major security breach here. Just look at the evidence.
First, you got a president who originally promised to heal the planet and slow the rise of the oceans, and then just days before the election, WHAMMO, that storm hits, causing possible doubt in some quarters that he was entirely successful.
He couldn’t really blame Bush for this, or global warming either. According to the United Kingdom’s national weather Meteorological Office (MET), although temperatures have gone up and down, there hasn’t been any statistical average temperature change over the past 16 years. On top of that, the frequency of major U.S. hurricane strikes over the past several decades is down about one-third compared with the first half of the 20th century. And as for those of Category 3 or higher, only one (Gloria in 1985) has made landfall in our nation’s Northeast since 1960, while five occurred in that region during the 1930s through 1950s. Sandy was a Category 1.
The CIA must have known about all of that. They’re really smart; and they have calendars. There’s obviously something else operating here. Something that was leaked to the New York Times...which is the go-to-place if you want to leak some really secret government information.
And there it is. We now find out that the CIA commissioned a study by the National Research Council (NRC) which was released just 10 days after the storm hit. And although it cites global warming as a contributing factor, the report concludes that there were other influences as well. As lead author John Steinbruner stated in a Times article: “You can debate the specific contribution of global warming to that storm. But we’re saying climate extremes are going to be more frequent, and this was an example of what they could mean. We’re also saying it could get a whole lot worse than that.”
Ahaaa! So other contributing factors are involved...like what? Hmmm. Well, what about that blasphemous anti-global warming religion U Tube video...the really offensive one made years ago which recently turned up again. Yeah, the one which portrays high priest Albert Gore as a sinister figure who brainwashes penguins and bores movie audiences by blaming the Mideast crisis on evil fossil fuel use. Obviously, that must be what stirred up the climate gods. The CIA wouldn’t have missed this clear connection, and certainly must have reported it to the White House as a top security matter.
And why did they sit on this information until ten days after the election? Why indeed! Here you’ve got lots of weather people out there claiming that Sandy was a well-organized storm attack rather than a spontaneous out-of-the-blue event. And, on the other hand, you had the Goracle warning us all along, that unless we switched to windmills and sunbeams right away, global warming would wreak devastating climate crisis havoc. Yet the White House hadn’t responded rapidly enough to avert this man-caused tragedy. Another trillion dollars in green subsidies had been needed, yet the administration failed to deliver.
In fact immediately after Sandy struck, Al lost no time figuring out where to place the blame. Writing in the Huffington Post, he admonished once again that: “Scientists tell us that if we do not reduce our emissions, these problems will only grow worse… Hurricane Sandy is a disturbing sign of things to come. We must heed this warning and act quickly to solve the climate crisis. Dirty energy makes dirty weather.”
And why did the CIA commission a climate study in the first place? Is this really a national security issue? Hey, it must be since, as the Times article notes, the Defense Department has already spent billions of dollars on plans to adapt to climate change because “...the United States is ill prepared to assess and prepare for the catastrophes that a heated planet will produce.” It also observes that the NRC study isn’t the first to link climate change and national security concerns. For example, “[T]he National Intelligence Council produced a classified national intelligence estimate on climate change in 2008 and has issued a number of unclassified reports since then.”
Yup, all of that got started in 2007 when Senate Armed Services Committee members Hillary Clinton (D-NY) and John Warner (R-VA) snuck some language into the National Defense Authorization Act which got our military into the climate protection business...whether they wanted to or not. The amendment required the Department of Defense to consider the effects of climate change upon their facilities, capabilities and missions.
And exactly what U.S. national security threats are they worried about? One that security planners highlighted in 2009 revolves around concern that global warming will melt the massive Himalayan ice mass. In theory, that would cause the rivers fed by Himalayan glaciers to flood. Then they would dry up after the glaciers retreated, endangering tens of millions of people in lowland Bangladesh. Retired Air Marshal A.K. Singh, a former commander in India’s air force, foresaw resulting mass migrations across national borders, with militaries (including ours) becoming involved.
This dire Himalayan glacier calamity was predicted by a preeminent international climate science organization, none other than the United Nations Intergovernmental Panel on Climate Change (IPCC). And that threat wasn’t premised on any obscure U Tube video either. Nope, as it turned out, and as the IPCC later admitted, that Himalayan prediction wasn’t based upon anything. It was just made up with absolutely no supporting science by a fellow who worked for the IPCC’s director. So you’d think that top Pentagon officials would be able to sleep better now knowing this… provided, of course, that someone has finally informed them.
This threat determination was first codified in 2007 and 2009 reports issued by the Center for Naval Analysis Military Advisory Board (CNAMAB). The latter, titled Powering America’s Defense, mandates military development and use of renewable fuels.
As former Chief of Naval Operations, Admiral Thomas Hayward, USN (Ret) told me, this is nonsense. He recounted that the CNAMAB dutifully arrived at that decision after being briefed primarily by personnel from organizations that embrace the man-made climate alarm thesis, including Dr. James Hansen, director of NASA’s Goddard Institute for Space Studies. As a consequence, the U.S. Navy is pursuing expensive and inappropriate programs which are virtually ensured to limit and restrict, if not block, essential applications of abundant indigenous fossil fuel sources.
A proudly featured program example was a $12 million, 450,000 gallon, Navy purchase of algae biofuel for aircraft, which calculates out at about $26.67 per gallon. Although Navy Secretary Ray Maybus has said they will really pay about $15 per gallon, this is hardly a bargain, since it will perform the same as standard JP-5 aircraft jet fuel that costs less than $3 per gallon. The good news is that the total fuel price will be only about five times more (rather than 9 times) after it is mixed with the standard stuff.
Admiral Hayward and his colleague Captain Donald (Deke) Forbes (USN Ret.) don’t think this is a particularly keen idea. In a January 2010 article they published in the periodical Navy, they question the defensibility of implementing costly and counterproductive energy-related interventions...all premised upon combating hypothetical and illogical climate impacts.
But, of course, combatting climate change wasn’t the only reason that DOD had in mind. That would be pretty dumb, given that it seems that the climate has changed back and forth at least once or twice before...and maybe a few times more than that. No, the 2010 Quadrennial Defense Review (QDR) which sets DOD priorities specifically includes provisions to “...investigate alternative concepts for improving operational energy use”...and increase use of renewable energy supplies and reduce energy demand to “improve operational effectiveness, reduce greenhouse gas emissions in support of U.S. climate change initiatives, and protect the Department from energy price fluctuations.”
Since the Navy biofuel contract is being promoted as a demonstration program, which is actually dubbed the “Great Green Fleet Carrier Strike Force”, you might imagine that it represents a terrifyingly comical flagship strategy for a kinder, gentler military campaign to defeat malevolent oil-exporting Middle Eastern adversaries. We can provoke them to die of laughter.
As for reducing energy demand and protecting the DOD from energy fluctuations, a study undertaken at the Pacific Northwest National Laboratory investigated some key conditions that will have to be met if biofuel algae were to replace 17% of U.S. petroleum as President Obama has proposed. The research looked specifically at production farms using open, outdoor fresh water ponds applying current technology, and considered such factors as suitable land use, topographical features, weather patterns and sky conditions available in the contiguous U.S. states.
The authors’ conclusions, published in Water Resources Research, estimated that growing that much algae will require a land area roughly the size of South Carolina, and about 25% of all U.S water currently consumed for crop irrigation just to compensate for evaporation. The locations will have to be in regions with optimum sunlight conditions and close access to carbon dioxide sources (gasp). In addition, there will need to be access to large sources of energy to keep the ponds from freezing in cold winter climate areas, and for processing the algae into fuel. This, of course, will reduce net energy benefits.
In any case, it appears that our military and national security won’t have to depend upon that biofuel after all. According to recent International Energy Agency (IEA) projections, thanks largely to our enormous shale resources, the U.S. will become the world’s top oil producer within the next several years. IEA envisions U.S. production of 10 million barrels per day in 2015, growing to 11.1 million in 2020, surpassing Saudi Arabia. The U.S. Energy Information Administration is only slightly less optimistic, projecting U.S. output reaching 10.73 million barrels per day by 2020.
But wait...I almost forgot. Burning all that oil will heighten the military threat resulting from global warming. As a result we will need to provide more ships to combat it, which will burn even more fuel, further multiplying the threat...an endless cycle of accelerating despair. This must be why the Obama administration has seen the wisdom of clamping down on drilling, and now has about 14 different agencies looking at ways to curtail fracking of those shale oil and gas reserves.
Besides, if we just reduce the size of our Navy, then we won’t need all that fuel in the first place, thereby minimizing the climate threat. And again, isn’t it comforting to know that our president intends to do just that by slashing the defense budget by about a trillion dollars?
So now that our military strategy to combat climate change by cutting back on the military is in place, we can turn our attention to addressing that remaining threat. I’m referring, of course, to the person who created that irresponsibly skeptical U Tube video that caused Hurricane Sandy. After all, what else could possibly be to blame for such an extreme event?
Well, on second thought...weather maybe? Reprinted with prmision of author.
Nov 18, 2012
Reality denier: Raving warmist Jeff Masters, ignoring the latest peer-reviewed science on drought
Tom Nelson Blogspot
Dr. Jeff Masters’ WunderBlog : Lessons from 2012: Droughts, not Hurricanes, are the Greater Danger | Weather Underground/Weather Channel’s last stand
We should not assume that the 21st century global civilization is immune from collapse due to drought. If we continue on our current path of ever-increasing emissions of carbon dioxide, the hotter planet that we will create will surely spawn droughts far more intense than any seen in recorded history, severely testing the ability of our highly interconnected global economy to cope. The coming great drought disasters will occur at a time when climate change is simultaneously creating record rainfall and flooding in areas that happen to be in the way of storms. Global warming puts more heat energy into the atmosphere. That means more more water will evaporate from the oceans to create heavier rains and make storms stronger, and there will be more heat energy to increase the intensity of heat waves and droughts. It all depends upon if you happen to lie on the prevailing storm track or not which extreme you’ll experience. In the future, if you’re not being cooked in a record drought, you’re going to be washed away in a record flood.
Little change in global drought over the past 60 years : Nature : Nature Publishing Group
Justin Sheffield, Eric F. Wood & Michael L. Roderick
Nature 491, 435 to 438 (15 November 2012) doi:10.1038/nature11575
Received 23 July 2012 Accepted 11 September 2012 Published online 14 November 2012
ABSTRACT
Drought is expected to increase in frequency and severity in the future as a result of climate change, mainly as a consequence of decreases in regional precipitation but also because of increasing evaporation driven by global warming. Previous assessments (TH) of historic changes in drought over the late twentieth and early twenty-first centuries indicate that this may already be happening globally. In particular, calculations of the Palmer Drought Severity Index (PDSI) show a decrease in moisture globally since the 1970s with a commensurate increase in the area in drought that is attributed, in part, to global warming. The simplicity of the PDSI, which is calculated from a simple water-balance model forced by monthly precipitation and temperature data, makes it an attractive tool in large-scale drought assessments, but may give biased results in the context of climate change6. Here we show that the previously reported increase in global drought is overestimated because the PDSI uses a simplified model of potential evaporation7 that responds only to changes in temperature and thus responds incorrectly to global warming in recent decades. More realistic calculations (PM), based on the underlying physical principles that take into account changes in available energy, humidity and wind speed, suggest that there has been little change in drought over the past 60 years. The results have implications for how we interpret the impact of global warming on the hydrological cycle and its extremes, and may help to explain why palaeoclimate drought reconstructions based on tree-ring data diverge from the PDSI-based drought record in recent years.
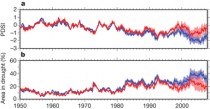
Enlarged a, PDSI_Th (blue line) and PDSI_PM (red line). b, Area in drought (PDSI <−3.0) for the PDSI_Th (blue line) and PDSI_PM (red line).
Nov 14, 2012
The Climate Change Lies Ramp Up Again
By Alan Caruba
Within days of the election, Rasmussen Reports said that “While there was little talk of climate change during the president campaign, the number of U.S. voters who see global warming as a serious problem is at an all-time high.
A survey reported on November 9th found that “68% of likely U.S. voters now say that global warming is at least a somewhat serious problem, including 38% who think it is very serious. Thirty percent (30%) don’t see global warming as a serious problem, with 12% who think it’s not serious at all.”
There’s nothing like a devastating Hurricane Sandy and a follow-up “nor’easter” to get people thinking that “climate” is changing, but the simple unadorned fact is that the Earth has been in a cooling cycle since 1998. It’s getting colder all over the world.
Meteorologist Tim Kelley says “Sandy is not an unprecedented storm. The 1938 hurricane was worse, and was followed by major hurricanes in 1944 and 1954; three major hurricanes in 16 years. We are fortunate to have gone nearly 60 years without a comparable storm here in the northeast.”
“The alarm and fear of anthropogenic (manmade) global warming is a major distraction,” said Kelley, “and a waste of resources that could otherwise go to helping humanity.” There are some simple truths that most people just don’t get. “Heat on Earth comes from our Sun and is stored in our oceans. Small fluctuations in solar and oceanic cycles draft any impact on climate when compared to the influence of anthropogenic CO2.”
“From a scientific perspective,” says Kelley, “it’s almost unfathomable that we have been duped into believing the scare generated by climate change alarmists.” And, yet, clearly a lot of people have been and continue to be duped.
So, like a zombie, climate change is back after the politicians managed to say nothing about it during the long campaign, plus three presidential debates and one vice presidential debate. It has been around since 1988. The greatest charlatan and buffoon the political class has produced, Al Gore, became the face of the global warming hoax. In 2009, when the emails between the Intergovernmental Panel on Climate Change (IPCC) scientists were exposed, it became clear that they were fearful that the new cooling cycle would end their grants and funding.
Headlines blared regarding the hoax and then they were forgotten, ignored.
No matter how many times the facts are presented, the global warming/climate change liars just produce some new report or study proclaiming that “97% of climate experts agree that humanity is causing global warming and other problematic climate change because of our greenhouse gas emissions.” That was the message of the Doran/Zimmerman global warming poll in April 2008 and published in January 2009. As Tom Harris of the International Climate Science Coalition pointed out, the survey has been thorough debunked. It doesn’t matter.
Just after the election, Environmental Defense Fund president, Fred Krupp, congratulated President Obama on reelection, saying he expects the 113th Congress to “make global climate change” a top priority.
Friends of the Earth, another environmental powerhouse, expressed similar thoughts. “In his acceptance speech, President Obama acknowledged the ‘destructive power of a warming planet.’ It is ironic that the outcome of a campaign so marked by the silence of both candidates would be definitively influenced by Superstorm Sandy, but history will show that the winds of Hurricane Sandy blew President Obama back into office.”
Surely some voters looked at the hurricane and concluded that it was “proof” of global warming and/or climate change. It was only proof that hurricanes have been occurring before and since the dawn of mankind.
It was proof of the gullibility, the ignorance of simple facts about the climate, that vast multitudes of Americans have been indoctrinated to believe when they attended school and by the constant media exposure of the repeated lies about global warming.
Ignored in the midst of this is the way such lies get translated into government policies that do immeasurable harm to the economy.
The Competitive Enterprise Institute called on President Obama to take reasoned steps
- Suspend and re-open the rulemaking process for the EPA’s greenhouse gas emissions regulations and other major Clean Air Act rules designed to close coal-fired power plants and raise electric rates and cancel the revised offshore drilling plan and revert to the much-more-ambitious 2008 plan.
- Open the coastal plain of the Arctic National Wildlife Refuge to oil exploration
- Approve the Keystone XL Pipeline
- Stop the EPA from interfering in state regulation of hydraulic fracturing.
- Suspend the Renewable Futures Standard for 2013 so corn prices can stabilize and
- Suspend, for obvious reasons, the Department of Energy’s loan guarantee program to “green” energy companies.
That’s the real impact of all the climate change hogwash. Hurricane Sandy left a wide swath of Americans in the dark prior to and during the election. The bunkum about greenhouse gas emissions will impede the steps the nation must take to ensure sufficient energy to keep the lights on from coast to coast.
Oct 31, 2012
It’s the AMO stupid
By Joseph D’Aleo, Weatherbell Analytics
We are already hearing that Sandy and any forthcoming wild winter weather relates to the post 1979 record arctic ice melt which alarmists incorrectly attribute to greenhouse gases. However, the fluctuations of arctic ice are the result of the same patterns (multidecadal in nature) that cause storms like Irene and Sandy and wild winters. Sandy broke the storm tide record for the Battery in NYC with a 13.88 foot AMLW level. The previous record was 11.2 feet set in the great hurricane of 1821 in the Dalton solar minimum. That storm was stronger than Sandy (1821 was a CAT3) but the surge came at low tide and with Sandy right at high tide, enhanced by a full moon. Also global see levels were a foot lower then. This was a comparable event. Of course back then there were no tunnels and subways, buses and cars, 100,000’s of people versus the 8 million today. So the event is not unprecedented as brainless bloggers, politicians and environMENTAL opportunists suggest.
Bill Clinton used “It’s the economy stupid” to help get elected in 2000.
My response to those in the met community and the left leaning trolls in the media that wants to put the blame for Irene and Sandy and any cold winters we have been getting on the melting of the arctic ice in summer due to greenhouse gases is: “It’s the AMO stupid”.
The AMO which goes through a 60-70 cycle favors more frequent hurricanes and more landfalls. We saw that in the period from the 1920s to around 1960 and again after 1995. In the first warm period mid century we had 11 major east coast hurricanes. We have had at least 8 since the AMO has warmed again in 1995. The last two years, the northeast got the brunt with irene and Sandy.
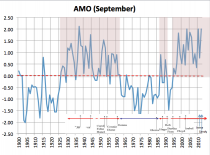
Enlarged
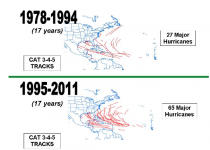
This is especially noticeable with major (CAT3+) hurricanes as JB and Ryan and my friend Dr. Bill Gray has shown.
Enlarged
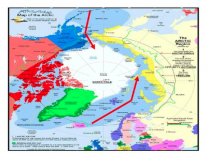
And for the arctic ice the University of Alaska Fairbanks has shown the Atlantic is the key to the extent of the ice in the arctic.
Enlarged
Atlantic water flows under the ice in the current sin the Kara and Barents sea (as does Pacific through the Bering Straits). When the AMO is -, the water is colder than normal and less melting occurs when the AMO is +.
The dips in arctic ice in 2007 and 2012 followed spikes in the AMO. The NSIDC which in 20007 was still a team of mainly objective scientists told it like it really is when they wrote:
“One prominent researcher, Igor Polyakov at the University of Fairbanks, Alaska, points out that pulses of unusually warm water have been entering the Arctic Ocean from the Atlantic, which several years later are seen in the ocean north of Siberia. These pulses of water are helping to heat the upper Arctic Ocean, contributing to summer ice melt and helping to reduce winter ice growth.Another scientist, Koji Shimada of the Japan Agency for Marine-Earth Science and Technology, reports evidence of changes in ocean circulation in the Pacific side of the Arctic Ocean. Through a complex interaction with declining sea ice, warm water entering the Arctic Ocean through Bering Strait in summer is being shunted from the Alaskan coast into the Arctic Ocean, where it fosters further ice loss. Many questions still remain to be answered, but these changes in ocean circulation may be important keys for understanding the observed loss of Arctic sea ice.”

Enlarged
The International Arctic Research Center at the University of Alaska, Fairbanks showed how arctic temperatures have cycled with intrusions of Atlantic water - cold and warm.
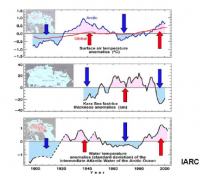
Enlarged
A similar and perhaps even more impressive melt occurred in the last +AMO phase whn the US Submarine Skate surfaced at the North pole in the summer AND winter.
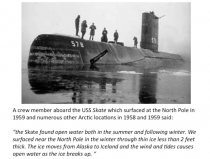
Enlarged
In 2007, NASA scientists reported that after years of research, their team had assembled data showing that normal, decade-long changes in Arctic Ocean currents driven by a circulation known as the Arctic Oscillation was largely responsible for the major Arctic climate shifts. These periodic reversals in the ocean currents move warmer and cooler water around to new places, greatly affecting the climate. The AO was at a record low level 2009-2010 explaining the record cold and snow in middle latitudes. A strongly negative AO pushes the coldest air well south while temperatures in the Polar Regions are warmer than normal under blocking high pressure.
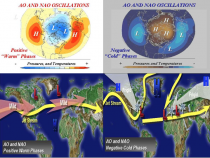
Enlarged
See how the warm tripole led to negative North Atlantic Oscillation (NAO), a component if the AO in the 1960s) and the cold a positive in the 1980s.
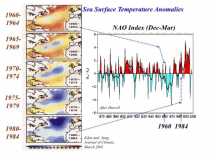
Enlarged
The NAO has declined after the AMO went positive in 1995 in winter.
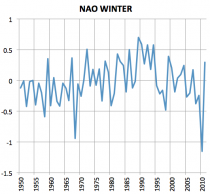
Enlarged
After the 2010/11 winter, the decadal trend numbers were astounding as to the degree of winter cooling in the US - ALL REGIONS. In December 2010, the UK had its second coldest December. in the entire record since 1659 in the LITTLE ICE AGE. The lower 48 was left out last winter though records for cold and snow were set in Alaska and parts of Eurasia.
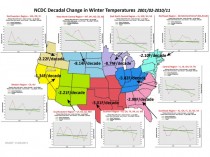
Enlarged
Even with the warming rebound winter in the lower 48, the 15 year trend continues down at 2.07F/decade.
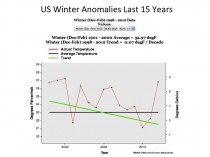
Enlarged
And that is true again for all regions.
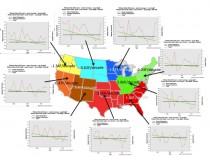
Enlarged
Winters have been snowier too in the US and the hemisphere.
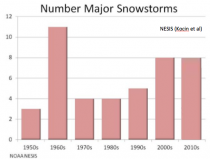
Enlarged
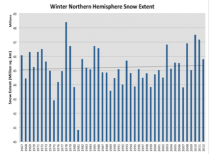
Enlarged
RANKINGS
#1 1977/78
#2 2009/10
#3 2010/11
#4 2007/08
#5 2002/03
So more landfalling storms in the Atlantic Basin and low arctic ice and cold winters are the result of a warm multidecadal cycle in the Atlantic not CO2. Its natural and cyclical. The world and our climate did not begin in 1979 when we could first watch from the sky in detail the arctic ice.
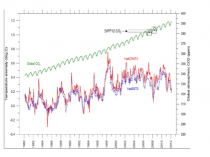
Enlarged
The stasis in global annual mean temperatures is due to a cold Pacific and a sun entering a slumber. They are fighting the last holdout, the warm AMO.

Enlarged
When the AMO goes cold in 5 years or so and cycle 24 gives way to dud cycle 25, Katy bar the door.
SUMMARY
(1) Irene and Sandy were overdue landfalling storms in the northeast during the warm multidecadal Atlantic mode that started in 1995. This is similar to the active priod from 1938-1960 when 11 landfalling impactful hurricanes occurred in the east (8 so far since 1995).
(2) The arctic ice responds to the same multidecadal Atlantic cycle and the Pacifical Decadal Oscillation. Ice in the 1950s was probably even lower than present as US submarines surface at the pole in winter and summer
(3) The warm AMO favore ths negative state of the NAO and AO which translates into colder and often snowier winters in the US and Eurasia.
(4) Its the AMO stupid.
Oct 28, 2012
Significant storm surge will impact New York City and surrounding areas
By Michael Barak, Weatherbell Analytics
Significant storm surge will impact New York City and surrounding areas during the landfall of Hurricane Sandy. The projected landfall will place NYC in an onshore wind flow through several tide cycles. Given the geometry of the New York/New Jersey coast, water will be funneled into New York Harbor. Our chief meteorologist at WeatherBELL, Joe Bastardi, has been frantically warning the public that the highly perpendicular angle at which Sandy is approaching will allow for a far more significant surge event than Hurricane Irene.
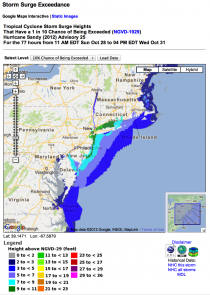
Enlarged
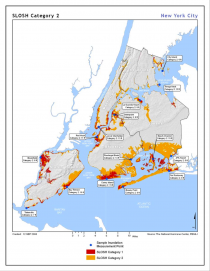
SLOSH modeling shows the areas that have the potential to be flooded during this event.
Enlarged
It is important to take note of the unusually low atmospheric pressure of Hurricane Sandy. The Saffir-Simpson hurricane scale is based entirely on maximum sustained winds near the hurricanes center. However, Sandy’s structure is not typical of hurricanes that exist in the deep tropics. A typical category 1 hurricane would only have hurricane force extending several tens of miles from the center. Sandy’s wind field is not concentrated near the center and hurricane force winds extend over 200 miles from the eye. As a result, significantly more seawater that normal is being driven toward the coast. The central pressure of the storm would be more indicative of a Category 2 or Category 3 hurricane.
Enlarged
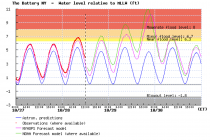
NOAA is forecasting over 10 feet of storm surge into New York Harbor. Keep in mind that the storm surge during Hurricane Irene was approximately 3.5-4.6ft. The graphic below depicts just how dire the situation will become.
Enlarged
Similarly, Stevens Institute modeling is also forecasting a historic storm surge for NYC.
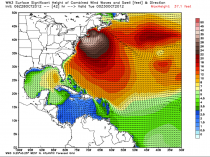
There will also be tremendous wave action (swells over 20 feet) superimposed on the rise in sea level.
This is a life-threatening situation for the New York and New Jersey coastline. All state and local governments should take maximum precautionary measures to ensure the safety of the people.
Follow us at www.weatherbell.com for storm updates.
-------------
Unsolicited comment on Forbes.com
Jonathan Nichols 1 hour ago
It would be good for all readers to know that Joe Bastardi and Joe D’Aleo have been on top of this since before it was even a ‘tropical storm’. They also were also the first at dismissing the GFS when it was taking Sandy out to sea, insisting that it would be captured for an east coast hit more than ten days ago. I am a subscriber to Weatherbell premium and find it to be a fascinating, informative and educational site on the weather. As a farmer, I really appreciate their long term outlooks. As an investor, I have started to make some moves to try to leverage the good information they put out. Full disclosure: I don’t stand to gain anything personally by point out that WeatherBell is amazing.
|


