Jan 16, 2011
Trenberth UPDATE - great embarrassment to AMS - replaces lifted text on AMS talk
By Steve McIntyre
UPDATE: See SPPI compilation from Eschenbach, Motl & McIntyre here. See Donna Laframboise’s excellent post on IPCC Nobel Laureates Lack Scientific Credibility here.
Donna concludes: “To sum up, therefore, a significant number of IPPC insiders believe many of their colleagues possess inferior scientific credentials. They believe these people’s participation in the IPCC is a result of concerns that have nothing to do with science. Instead, they were chosen because they are of the right gender or the right nationality. They were chosen because they are pals with the person who makes such decisions in a particular country. They were chosen because they are considered politically “safe” by their own governments. All of these people - no matter how little they actually contributed to the IPCC process - are now Nobel laureates.
----------
On January 14, 2011, I reported here that Trenberth’s AMS presentation had lifted text verbatim or near-verbatim from Hasselmann 2010 with no citation in most cases and, in the one case where Hasselmann 2010 was cited, the citation was insufficient under standard academic practices given the lengthy near-quotation. Trenberth’s original presentation is here.
This post has obviously been brought to Trenberth and/or AMS’s attention, as they have deleted the original version of Trenberth’s presentation and replaced it with an amended version, without a change notice.
The amended version picks up most of the problems raised in the previous CA post. Here are the points raised in the CA post and Trenberth’s changes:
Trenberth originally stated:
Scientists make mistakes and often make assumptions that limit the validity of their results. They regularly argue with colleagues who arrive at different conclusions. These debates follow the normal procedure of scientific inquiry.
The amended version:
Hasselmann (2010) further notes that scientists make mistakes and often make assumptions that limit the validity of their results. They regularly argue with colleagues who arrive at different conclusions. These debates follow the normal procedure of scientific inquiry.
Trenberth’s original statement about tactics to use against “deniers”:
It is important that climate scientists learn how to counter the distracting strategies of deniers. Debating them about the science is not an approach that is recommended.
The amended version:
It is important that climate scientists learn how to counter the distracting strategies of deniers (Hasselmann 2010). Debating them about the science is not an approach that is recommended.
Trenberth originally stated:
The main societal motivation of climate scientists is to understand the dynamics of the climate system (both natural and human induced), and to communicate this understanding to the public and governments.
The amended version:
The main societal motivation of climate scientists is to understand the dynamics of the climate system (both natural and human induced), and to communicate this understanding to the public and governments (Hasselmann 2010).
Trenberth did not feel obligated to restate everything that Hasselmann had stated. For example, Trenberth did not repeat Hasselmann’s observation that:
Individually, most climate scientists have the goal of establishing a scientific reputation and, if possible, attaining more public funding for climate research.
Trenberth originally stated:
They [climate scientists] have faith in the scientific method and the efficacy of the established peer-review process in separating verifiable scientific results from baseless assertions.
The amended version:
As Hasselmann (2010) further notes, they have faith in the scientific method and the established peer-review process in separating verifiable scientific results from baseless assertions.
As to the lengthy introductory paragraph which was lifted near-verbatim from Hasselmann, but with no indication that large sections were verbatim: the original Trenberth version was:
Three investigations of the alleged scientific misconduct of the Climate Research Unit at the University of East Anglia - one by the UK House of Commons Science and Technology Committee, a second by the Scientific Assessment Panel of the Royal Society, chaired by Lord Oxburgh, and the latest by the Independent Climate Change E-mails Review, chaired by Sir Muir Russell - have confirmed what climate scientists have never seriously doubted: established scientists depend on their credibility and have no motivation in purposely misleading the public and their colleagues. Moreover, they are unlikely to make false claims that other colleagues can readily show to be incorrect. They are also understandably (but inadvisably) reluctant to share complex data sets with non-experts that they perceive as charlatans (Hasselman 2010)
The amended version is:
As noted by Hasselmann (2010), three investigations of the alleged scientific misconduct of the Climate Research Unit at the University of East Anglia - by the UK House of Commons Science and Technology Committee and by the Lord Oxburgh and Sir Muir Russell reviews - have confirmed that established scientists depend on their credibility and have no motivation in purposely misleading the public and their colleagues. Moreover, they are unlikely to make false claims that other colleagues can readily show to be incorrect. They are also understandably (but inadvisably) reluctant to share complex data sets with non-experts that they perceive as charlatans (Hasselman 2010).
Note here that Trenberth removed the absurd Hasselmann characterization of the Oxburgh inquiry that had passed muster with the editors of Nature Geoscience - that it was the “Scientific Assessment Panel of the Royal Society”. A point also raised in comments in the CA post.
Trenberth did not submit a comment to Climate Audit thanking us for enabling him to mitigate the problem prior to the actual formal presentation of his speech or otherwise thank us at the AMS webpage at which the changes were made.
Even as amended, Trenberth’s use of extended near-quotations without quotation marks must surely still be at the edge of acceptable practice, if not over it.
In appraising whether inadequate citation rises to being academic misconduct, it seems to me that one needs to consider whether there is a claim or implied claim of originality and how such incidents are handled in the field. Trenberth’s speech was not the same thing as a master’s thesis. Trenberth had lifted text, but AMS appears to have decided that the situation could be more or less coopered up by providing more citations to Hasselmann; that the inadequacy of the citations did not entail that the entire speech be withdrawn; or that AMS was obliged to file a complaint against Trenberth for academic misconduct.
It’s also interesting what Trenberth chose to change and not to change. Plagiarism is an issue that is uniquely central to the academic world and Trenberth moved quickly to erase any evidence of plagiarism. The non-academic world would be less concerned about plagiarism and more concerned about Trenberth’s use of the offensive term “denier” and whether Trenberth’s Empire Strikes Back attitudes are a useful contribution to the post-Climategate debate. Although Trenberth was also criticized on these counts, Trenberth made no concessions or changes to this aspect of his speech.
In closing, I note that copying of text has been subject to considerable recent attention following the USA Today about Raymond Bradley’s academic misconduct complaint that “text was just lifted verbatim from my book and placed in the Wegman Report”. See CA discussion e.g. here and here - posts which included criticism of the Wegman Report in respect to its citation of Bradley, while, at the same time, observing that the section in question was “boilerplate” description of tree rings and did not affect the statistical report and that Bradley himself had lifted text verbatim from Fritts’ 1976 text on tree rings.
See the firestorm of other posts about Trenberth who has become an embarrassment to NCAR and the AMS here.
See how Trenberth may be the UN’s Gatekeeper to keep peer review publications out of the literature that could harm the UN scientist’s reputation or what is left of that, and much more on Trenberth here.
See also this insightful post on WUWT by Willis Eschenbach, “Unequivocal Equivocation - an open letter to Dr. Trenberth”.
The AMS also gave an award to Hansen who has gone unhinged in his alarmism as reported here.
The AGU is just as corrupted and the National Academy of Sciences under Cicerone has entirely lost its way. The once august group founded by President Lincoln is now a joke. See the Climategate Reloaded emails here from the group as they like the AMS and AGU rent seeking ‘scientists’ talk about winning the communications battle to convince the public that cold is really warm, wet is really dry.
Jan 13, 2011
Hansen Unhinged: US Democracy Not Competent, Calls on Communist China to “Save Humanity”
Haunting the Library
UPDATE: See Pat Michaels discussion of Hansen’s efforts in this new Washington Post article.
The NASA scientist at the heart of the global warming fiasco seems set to stir more controversy after declaring in an op ed piece for The South China Morning Post and a personally published follow-up that American democracy is not competent to deal with global warming, and communist China now represents the world’s “best hope”.
In the op ed piece for the Chinese newspaper, which he entitled Chinese Leadership Needed to Save Humanity (published as The Price of Change) Hansen placed the blame for the vast majority of Co2 emissions supposedly causing global warming on his home country of America, and appealed to China not to follow the same path. Hansen said that China was the world’s “best hope” and called for them to “lead the world through the most dangerous crisis that humanity and nature have ever faced”.
In a follow-up article published on his website Hansen calls Americans “barbarians” and slams American democracy, calling for China to raise tariffs on American-made products until such time as America falls into line.
He recalls with some bitterness how the findings on fuel efficiency that he and his “A-Team” (as he calls it) of crack scientists came up with were held up for years by the democratic and judicial process in the United States:
We “won” the court case, yet appeals stretched the time of action for years. I came away feeling that not only is it nearly impossible to get effective legislation through Congress, but that the special interests can prevent implementation almost interminably. Democracy of the sort intended in 1776 probably could have dealt with climate change, but not the fossil-money - ‘democracy’ that now rules the roost in Washington.

James Hansen, China and the Barbarians.
The declaration that American ‘democracy’ (as he sarcastically refers to it as) cannot cope with climate change, and that the world must look to the Chinese communist dictatorship to “lead” is bound to be controversial.
What is potentially even more controversial is that Hansen goes on to condemn the current democratic system in America as “dysfunctional” as it will not enact the carbon taxes he has been calling for. All is not lost, though, as he advises the Chinese government what to do about Congress in a truly incredible passage in his letter:
However, there is a way around that, which becomes obvious with the realization that an initially modest carbon fee is in China’s own interest. After agreement with other nations, e.g., the European Union, China and these nations could impose rising internal carbon fees. Existing rules of the World Trade Organization would allow collection of a rising border duty on products from all nations that do not have an equivalent internal carbon fee or tax.
The United States then would be forced to make a choice. It could either address its fossil fuel addiction with a rising carbon fee and supportive national investment policies or it could accept continual descent into second-rate and third-rate economic well-being.
My reading of this is that Hansen is advising a foreign, communist dictatorship how to circumvent American democracy and “force” (his word) America into either kow-towing over carbon taxes, or “accepting continual descent”. It is truly breath-taking that a federal employee seems able to get away with such seemingly unpatriotic activity without any reprimand or disciplinary action.
Hansen concludes his remarkable personal advice by expressing his hope that China will be able to find “good barbarians” (i.e. compliant Westerners) to help it “participate in effective policy”. As he observes, the great thing about China is that they are not bound by the inconveniences of democracy, such as elections and accountability and can simply impose decisions by diktat:
I have the impression that Chinese leadership takes a long view, perhaps because of the long history of their culture, in contrast to the West with its short election cycles. At the same time China has the capacity to implement policy decisions rapidly.
Hansen also claimed that if no action was taken, and all fossil fuels were burnt, then sea levels would rise by 75 metres (246 feet).
Read more here.
See the excellent critique of the Hansen and IPCC model forecasts here in ALARMING WARMING? Reality Trumps Dire Predictions here
Jan 12, 2011
December Update - Current USA Cooling Trend and Why It Should be Lights Out for Alarmism
By SBVOR
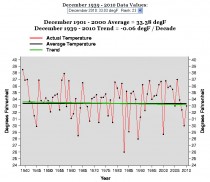
71 Year USA Cooling Trend for December.
Click here to enlarge it.
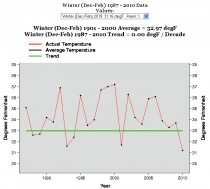
23 Winters with NO WARMING! Will this be winter number 24?
Click here to enlarge it.
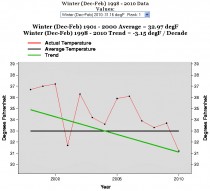
12 Winters of RAPID COOLING! )(31.5F/century!) Will this be winter number 13?
Click here to enlarge it.
12 Years of Annualized RAPID COOLING!
Click here to enlarge it.
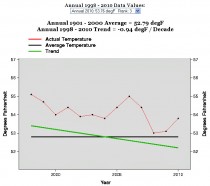
Please! Tell me again who thinks it is a good idea to utterly waste $45 TRILLION in order to pretend we can micromanage climate change. Kyoto has already PROVEN that we can waste all the money we want and we will not even come CLOSE to changing the global temperature in any way which could even be measured.
Furthermore, history tells us that the estimate of $45 TRILLION would balloon into at LEAST a full order of magnitude above that figure.
See the post here. See similar post here.
---------
Phil Jones Proves ALL IPCC Computer Models are WRONG!
Quoting the U.K. Mail Online: “[Phil Jones, of ClimateGate infamy] said that for the past 15 years there has been no ‘statistically significant’ warming”. He also noted the globe had cooled 0.12C (0.22F) from 2002 to 2009.
Click here for the BBC Q&A.
The most overwhelming significance of this admission has been overlooked by EVERYBODY!
The alarmists at NOAA are on record admitting that: “The [computer model] simulations rule out (at the 95% level) zero trends [in global temperatures] for intervals of 15 yr or more, suggesting that an observed absence of warming of this duration is needed to create a discrepancy with the expected present-day warming rate.”
That’s it! Game OVER! The AGW Hysteria cult is officially DEAD and BURIED!
According to the very core of the alarmist cabal, the IPCC computer models—the SOLE SOURCE of all the hysterical predictions of climate catastrophe—have been invalidated!
----------
Yet after scurrying during recent cooling to find more warmth by eliminating UHI adjustments for the US (NOAA) and pretending bad siting did not matter (soon to be shown not to be the case) and NASA pretending it had superior arctic data and taking advantage of record blocking to extrapolate record warm all across the arctic (although Norway on the edge of the arctic had the coldest year since 1941), NOAA and NASA predictably announce 2010 was tied for the warmest year. As David Evans notes “They are cheating”.

Enlarged here
Predictably, dumb and dumber here reacted to proclaim its a wake-up call to move forward on the green (really red) cap and tax agenda. NOAA and NASA benefited from their advocacy efforts by getting a huge boost to $438M for 2011 for more global warming research (not including their shares from $600M from the 2009 Recovery Act).
“The prospect of domination of the nation’s scholars by Federal employment, project allocations, and the power of money is ever present - and is gravely to be regarded.” Dwight Eisenhower 1961 Farwell Address to the Nation has indeed proven prescient.
Jan 10, 2011
Customers face huge bill for wind farms that don’t work in the cold
By Tom Mcghie
The failure of Britain’s wind farms to produce electricity in the extreme cold will cost billions of pounds, create an economic crisis and lead to blackouts, leading industrialists have warned.
To cover up the ineffectiveness of wind farms the Government will be forced to build emergency back-up power plants, the cost of which will be paid by industry and consumers.
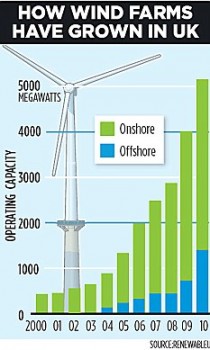
Enlarged here.
Jeremy Nicholson, director of the Energy Intensive Users Group, which represents major companies employing hundreds of thousands of workers in the steel, glass, pottery, paper and chemical industries, said the failure of wind power had profound implications.
Flawed: To cover up the ineffectiveness of wind farms the Government will be forced to build emergency back-up power plants, the cost of which will be paid by industry and consumers. He was speaking after new figures showed that during the latest cold snap wind turbines produced less than two per cent of the nation’s electricity.
Now Mr Nicholson predicts that the Government will encourage power companies to build billions of pounds worth of standby power stations in case of further prolonged wind failures.Last updated at 1:20 AM on 9th January 2011
And the cost of the standby generation will be paid for by industry and households through higher bills - which could double by 2020. Industry regulator Ofgem has already calculated that the cost of achieving sustainable energy targets - set by Brussels but backed by the British Government - will amount to 200 billion pounds, which will mean that annual household fuel bills will double to about 2,400 pounds on average within the next ten years.
In the last quarter ending December 23, wind turbines produced on average 8.6 per cent of our electricity, but the moment the latest bad weather arrived with snow and freezing temperatures, this figure fell to as low as 1.8 per cent.
The slack was immediately taken up by efficient, but dirty, coal-fired power stations and oil-fired plants. ‘What is so worrying is that these sort of figures are not a one off,’ said Mr Nicholson. ‘It was exactly the same last January and February when high pressure brought freezing cold temperatures, snow and no wind.’
In fact last year, the failure of wind power to produce electricity was even more profound. Then, over a few days, the lack of wind meant that only 0.2 per cent of a possible five per cent of the UK’s energy was generated by wind turbines. So little energy was generated then that the National Grid, which is responsible for balancing supply and demand of energy in the UK, was forced to ask its biggest users - industry - to ration supplies.
What really concerns industrial users is that it is Government policy to put wind power at the centre of its efforts to ensure that 30 per cent of electricity is generated by renewable resources by 2020. This means that the number of turbines now running - 3,140 - will have to be massively increased to well over 6,000 in ten years time.
But this huge surge in wind farm activity will come at the same time as an EU Directive will insist that we close down our coal-fired and oil-fired power stations. Mr Nicholson said: ‘We can cope at the moment because there is still not that much power generated from wind. But all this will change. What happens when we are dependent on wind turbines for 30 per cent of our power and there is suddenly a period when the wind does not blow and there is high demand?
‘We will be forced to switch off the gas and it could even lead to power cuts.’ The Government is aware of the dangers of relying on intermittent power sources and is working on plans to encourage energy companies through financial inducements to have stand-by generation.
Mr Nicholson said: ‘At least the Government is aware of the problem, but it will cost billions to put these measures in place and we will have to pick up the tab. A Department of Energy and Climate Change spokesman said: ‘Wind power provides a home-grown source of electricity that doesn’t produce carbon dioxide. The electricity system always has more generating capacity available than the expected demand. By having a diverse energy mix, we can manage the fact that some technologies are intermittent.’
The National Grid is also aware of the problem and has set up a team to look at solving the problem of erratic energy supplies. One of the solutions being considered is changing demand at times of crisis. For example, setting up systems to stop electricity supplies to millions of fridges for an hour or so. This would be possible by having ‘smart’ meters and would save massive amounts of energy.
Read post here.
In Maine, one wind turbine is delivering just 1/10th of the promised output. The wind company told the town they need to move it to a better location....and so need more money. The town will be throwing good money after bad. They should sue not reward the wind company.
--------
Coal takes the strain...again
By Paul Hudson, BBC
On BBC Look North on friday I reported that during the recent intense cold weather, it’s been our traditional coal and gas fired power stations that have been working flat out to keep our homes and businesses warm.
And for the third winter running, the intense cold has gone hand in hand with periods of little or no wind. This should come as no surprise since prolonged cold is invariably associated with areas of high pressure.
Peak demand also comes during summer heat waves - as we all turn on our air conditioning units - again usually associated with areas of high pressure, with little or no wind.
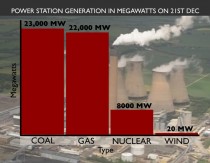
December 21st 2010 was one of the coldest days on record in Yorkshire. The bar chart below gives an idea of how much electricity was being generated by which type of power facility, when temperatures were at their lowest.
Enlarged here.
With much of the country experiencing very little wind, both onshore and offshore, wind turbines were largely inactive.
At the moment that is not a problem. Only 5% of electricity is currently generated by wind farms, and so other power stations can step in and ramp up output.
But in only 9 years time, the UK will legally have to generate around 30% of its electricity from renewable sources, of which 25% is expected to come from wind farms alone, as it is seen as a clean, carbon free energy source.
So what will happen then, when the wind doesn’t blow?
If a similar meteorological situation occurred in 2020, then almost 25% of power would have to come from sources other than wind.
This means that there would have to be some power stations - using coal or gas, since nuclear power output can’t be increased at short notice - that simply exist as a stand-by facility, in case the wind doesn’t blow.
And that’s a very expensive way of producing electricity.
And what happens if, as seems at least possible, the next 10-15 years sees an increase in the type of disrupted weather patterns that we have experienced recently, because of solar considerations?
Professor Mike Lockwood at Reading University thinks that the UK could indeed experience colder winters on average, compared with the last few decades because of the sun’s low activity.
This would lead to a higher frequency of ‘blocking’ weather patterns leading to less frequent windy conditions than would normally be expected if one looks at climatological averages - suggesting we would have to continue to rely on coal and gas fired power generation well into the future - and possibly more than is currently envisaged. Read more here.
Jan 09, 2011
“2010 was the Warmest Year on Record”
By Christopher Monckton of Brenchley on SPPI
Michael Steketee, writing in The Australian in January 2011, echoed the BBC (whose journalists’ pension fund is heavily weighted towards “green” “investments") and other climate-extremist vested interests in claiming that 2010 was the warmest year on record worldwide. Mr. Steketee’s short article makes two dozen questionable assertions, which either require heavy qualification or are downright false. His assertions will be printed in bold face: the truth will appear in Roman face.
1. BASED ON PRELIMINARY DATA TO NOVEMBER 30, SEA SURFACE TEMPERATURES AROUND AUSTRALIA WERE THE WARMEST ON RECORD LAST YEAR, AS WERE THOSE FOR THE PAST DECADE.
The record only began ten decades ago. As for sea temperatures, they are less significant for analyzing “global warming” than estimated total ocean heat content. A recent paper by Professors David Douglass and Robert Knox of Rochester University, New York, has established that - contrary to various climate-extremist assertions - there has been no net accumulation of “missing energy” in the form of heat in the oceans worldwide in the six years since ocean heat content was first reliably measured by the 3000 automated ARGO bathythermographs in 2003. This finding implies that the amount of warming we can expect from even quite a large increase in CO2 concentration is far less than the IPCC and other climate-extremist groups maintain.
2. THE WORLD METEOROLOGICAL ORGANISATION SAYS THE YEAR TO THE END OF OCTOBER WAS THE WARMEST SINCE INSTRUMENTAL CLIMATE RECORDS STARTED IN 1850 - 0.55 C ABOVE THE 1961-90 AVERAGE OF 14 C.
It is easy to cherry-pick periods of less than a calendar year and say they establish a new record. The cherry-picking of the first nine months of 2010 is particularly unacceptable, since that period was dominated by a substantial El Nino Southern Oscillation, a sudden alteration in the pattern of ocean currents worldwide that leads to warmer weather for several months all round the world. The last few months of the year, carefully excluded from Mr. Steketee’s statement, showed the beginnings of a La Nina event, which tends largely to reverse the effect of its preceding El Nino and make the world cooler. Indeed, the calendar year from January to December 2010, according to the reliable RSS and UAH satellite records, was not the warmest on record. Besides, what is important is how fast the world is warming. In fact, the rate of warming from 1975-2001, at 0.16 C per decade, was the fastest rate to be sustained for more than a decade in the 160-year record, but exactly the same rate occurred from 1860-1880 and again from 1910-1940, when we could not possibly have had anything to do with it. Since late 2001 there has been virtually no “global warming” at all.
3. THE LAST DECADE ALSO WAS THE WARMEST ON RECORD.
After 300 years of global warming, during nearly all of which we could not on any view have influenced the climate to a measurable degree, it is scarcely surprising that recent decades will be warmer than earlier decades. That is what one would expect. If one has been climbing up a steep hill for a long time, one should not be surprised to find oneself higher up at the end of the climb than at the beginning.
4. THE WORLD IS NOT COOLER COMPARED TO 1998.
Actually, it is cooler. There was a remarkable spike in global temperatures in 1998, caused not by manmade “global warming” but by a Great El Nino event - an alteration in the pattern of ocean currents that begins in the equatorial eastern Pacific and spreads around the globe, lasting a few months. In the first nine months of 2010 there was another substantial El Nino, but even at its peak it did not match the Great El Nino of 1998.
5. THE TRENDS HAPPEN TO FOLLOW CLOSELY THE PREDICTIONS OVER THE PAST 40 YEARS OF TEMPERATURE RISES RESULTING FROM INCREASED GREENHOUSE GAS EMISSIONS.
In the 40 years since 1970, global temperatures have risen at a linear rate equivalent to around 1.3 C/century. CO2 concentration is rising in a straight line at just 2 ppmv/year at present and, even if it were to accelerate to an exponential rate of increase, the corresponding temperature increase would be expected to rise merely in a straight line. On any view, 1.3 C of further “global warming” this century would be harmless. The IPCC is predicting 3.4 C, but since the turn of the millennium on 1 January 2001 global temperature has risen (taking the average of the two satellite datasets) at a rate equivalent to just 0.6 C/century, rather less than the warming rate of the entire 20th century. In these numbers, there is nothing whatever to worry about - except the tendency of some journalists to conceal them.
6. MOST SCIENTISTS AGREE THAT DOUBLING THE CARBON DIOXIDE IN THE ATMOSPHERE IS LIKELY TO LEAD TO WARMING OF 2-3 C.
It is doubtful whether Mr. Steketee had consulted “most scientists”. Most scientists, not being climate scientists, rightly take no view on the climate debate. Most climate scientists have not studied the question of how much warming a given increase in CO2 concentration will cause: therefore, whatever opinion they may have is not much more valuable than that of a layman. Most of the few dozen scientists worldwide whom Prof. Richard Lindzen of MIT estimates have actually studied climate sensitivity to the point of publication in a learned journal have reached their results not by measurement and observation but by mere modeling. The models predict warming in the range mentioned by Mr. Steketee, but at numerous crucial points the models are known to reflect the climate inaccurately. In particular, the models predict that if and only if Man is the cause of warming, the tropical upper air, six miles above the ground, should warm up to thrice as fast as the surface, but this tropical upper-troposphere “hot-spot” has not been observed in 50 years of measurement by balloon-mounted radiosondes, sondes dropped from high-flying aircraft, or satellites. Also, the models predict that every Celsius degree of warming should increase evaporation from the Earth’s surface by 1-3%, but the observed increase is more like 6%. From this it is simple to calculate that the IPCC has overestimated fourfold the amount of warming we can expect from adding greenhouse gases to the atmosphere. Take away that prodigious exaggeration, demonstrated repeatedly in scientific papers but never reported by the likes of Mr. Steketee, and the climate “crisis” vanishes.
Read the rest of Chris’s rebuttal here.
|


