Feb 27, 2009
Victoria Bushfires Stoked by Green Vote
David Packham, honorary senior research fellow at Monash University in the Australian
I have been a bushfire scientist for more than 50 years, dealing with all aspects of bushfires, from prescribed burning to flame chemistry, and serving as supervisor of fire weather services for Australia. We need to understand what has happened so that we can accept or prevent future fire disasters. That this disaster was about to happen became clear when the weather bureau issued an accurate fire weather forecast last Wednesday, which prompted me, as a private citizen, to raise the alarm through a memo distributed to concerned residents.
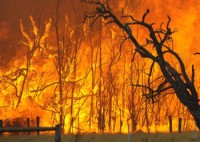
The decision to ignore the threat has been encouraged by some shocking pseudo-science from a few academics who use arguments that may have a place in political discourse but should have no place in managing our environment and protecting it and us from the bushfire threat. The conclusion of these academics is that high intensity fires are good for the environment and that the resulting mudslides after rains are merely localised and serve to redistribute nutrients. The purpose of this failed policy is to secure uninformed city votes.
Only a few expert retired fire managers, experienced bushies and some courageous politicians are prepared to buck the decision to lock up our bush and leave it to burn. The politicians who willingly accept this rubbish use it to justify the perpetuation of the greatest threat to our forests, water supplies, homes and lives in order to secure a minority green vote. They continue to throw millions (and no doubt soon billions) at ineffective suppression toys, while the few foresters and bush people who know how to manage our public lands are starved of the resources they need to reduce fuel loads.
It is hard for me to see this perversion of public policy and to accept that the folk of the bush have lost their battle to live a safe life in a cared-for rural and forest environment, all because of the environmental fantasies of outraged extremists and latte conservationists.
In a letter to my local paper, the Weekly Times, on January 25, I predicted we were facing a very critical situation in which 1000 to 2000 homes could be lost in the Yarra catchment, the Otways and/or the Strezleckies; that 100 souls could be lost in a most horrible and violent way; and that there was even a threat to Melbourne’s water supply, which could be rendered unusable by the ash and debris. Horrifically, much of this has come to pass, and it is not yet the end of the bushfire season.
In the face of this inferno, the perpetrators of this obscenity should have the decency to stand up and say they were wrong. Southeast Australia is the worst place in the world for bushfires, and we must not waste any time in getting down to the task of making our bush healthy and safe. But don’t hold your breath. Do you hear that lovely sound the warbling pigs make as they fly by? Read full letter here
See in this powerful news 3 New Zealand video and story here how a Family Fined for Firebreak Survived the Inferno.
Excerpt: Not everyone’s property was destroyed - the Sheahan family were able to save their house after deciding to stay and fight the fire. “If we hadn’t stayed we would have lost everything - we put out eight fires inside our house - eight!” says Liam Sheahan. It is somewhat ironic that the Sheahan’s home is the only one left standing for two kilometres. They were fined A$50,000 in 2002 for illegally clearing 250 trees near the Reedy Creek home to make a fire break. It was a decision that put them through seven years of hell - labelled lawbreakers and left emotionally and financially drained.
But today they feel vindicated. “[Being fined] was traumatic and humiliating. It broke us financially - we fought [the decision] because we are right. We still believe we are right,” says Mr Sheahan. Both Liam and Dale Sheahan have criminal records from bulldozing the trees and this meant Dale was targeted by airport security when returning home to New Zealand. “She then gets dragged across with Asian drug dealers and paedophiles and they ask what she has done. She says ‘get rid of trees’ and they say get out,” says Mr Sheahan. On Saturday night they faced the fire that so many others fled from.
Feb 27, 2009
Alarmism by the Numbers
By Tom Still, note to Benny Peiser
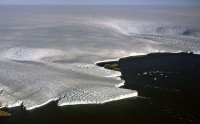
Global warming alarmists who study polar ice behavior delight in using very large numbers to scare the rest of us. In an AP report of a report by a spokesman for the Britian - based Scientific Committee on Antarctic Research says the ice down there is melting “faster than we thought.”
Quoting AP:
The melting “also extends all the way down to what is called west Antarctica,” said Colin Summerhayes, executive director of the Britain-based Scientific Committee on Antarctic Research.
By the end of the century, the accelerated melting could cause sea levels to climb by 3 feet to 5 feet - levels substantially higher than predicted by a major scientific group just two years ago.
Summerhayes said the biggest of the western glaciers, the Pine Island Glacier, is moving 40 percent faster than it was in the 1970s, discharging water and ice more rapidly into the ocean. The Smith Glacier, also in west Antarctica, is moving 83 percent faster than in 1992.
Together, all the glaciers in west Antarctica are losing a total of around 114 billion tons per year because the melting is much greater than new snowfall, he said. “That’s equivalent to the current mass loss from the whole of the Greenland ice sheet,” Summerhayes said. Looked at another way, it’s more weight than 312,000 Empire State Buildings.
End of quotations.
114,000,000,000 tons of ice/water per year. Run for the hills!!
But wait. By my computation the continent of Antarctica contains - get this—19,000,000,000,000,000 tons of ice. Assuming that 10% of the ice is West Antarctica Ice Sheet, it would take 167,000 years to melt all that ice at the alarming rate of 114 Bn tons per year.
The area of the oceans is 3,475,000,000,000,000 sq feet. By my calculation, if the WAIS is 10% of all the ice, then it would take 96 years to raise sea levels 12 inches at the alarming rate of 114,000,000,000 tons of melt per year (3,600,000,000,000 cuft).
Mr. Summerhayes says this rapid melt rate may have been going on since 1970 or 1993. But meanwhile a recent study by Woppelmann et al., cited at http://www.co2science.org/ indicates that sea level rise has been very constant since 1893.
“… since mean sea-level rose at a constant rate over the entire 114 years [up to and including 2007], it seems highly unlikely that the historical increase in the atmosphere’s CO2 content—which accelerated dramatically over this time interval—could have been the ultimate cause of the steady mean sea-level rise.” The rapid rate of melt since possibly 1970 (or 1993) apparently has been having no added effect on the rate of sea level rise.
So, from now on I will be very careful not to be frightened, at face value by reports of massive ice loss from Antarctica and Greenland. There really is a lot of ice at these two places. See PDF here.
CCNet is a scholarly electronic network edited by Benny Peiser. To subscribe, send an e-mail to listserver@ljmu.ac.uk ("subscribe cambridge-conference").
Feb 26, 2009
Ice Age or Global Warming?
By Alister Doyle
It looks more like an Ice Age than global warming. There is so much snow in Oslo, where I live, that the city authorities are resorting to dumping truckloads of it into the sea because the usual storage sites on land are full.
That is angering environmentalists who say the snow is far too dirty - scraped up from polluted roads - to be added to the fjord. The story even made it to the front page of the local paper (‘Dumped in the sea’).
In many places around the capital there’s about a metre of snow, the most since 2006 when it was last dumped in the sea. Extra snow usually gets trucked to sites on land, where most of the polluted dirt is left after the thaw. Those stores are now full - in some the snow isn’t expected to melt before September.
But are these mountains of snow a sign that global warming isn’t happening? Unfortunately, more snow might fit projections by the U.N. Climate Panel, which says that northern Europe is likely to get wetter and the south drier as temperatures rise this century. “By the 2070s, hydropower potential for the whole of Europe is expected to decline by 6 percent, with strong regional variations from a 20 to 50 percent decrease in the Mediterranean region to a 15 to 30 increase in northern and eastern Europe.” it said in its 2007 report. So people in northern Europe may have to buy more snow shovels than parasols to cope with global warming? How about where you live? Read post here. (H/T Benny Peiser)
Actually southern and central Europe has had it even worse than northern Europe with mountain snow depths and totals approaching historic levels.
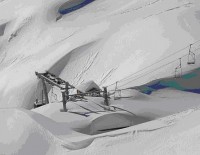
Snow has even fallen into northern Africa and now into coastal Turkey for the first time in decades.

Feb 26, 2009
Alarmists Blatant Calls for Continued Funding while Exagerrating Polar Ice Demise
Rueters
Excerpt: “...governments need to keep pumping money into North and South Pole research in order to keep tabs on global warming pressures...”
The Arctic and Antarctic regions are warming faster than previously thought (the new universal talking point - invariably a fabrication), raising world sea levels and making drastic global climate change more likely than ever, international scientists said on Wednesday. New evidence of the trend was uncovered by wide-ranging research in the two areas over the past two years in a United Nations-backed programme dubbed the International Polar Year (IPY), they said.
“Snow and ice are declining in both polar regions, affecting human livelihoods as well as local plant and animal life in the Arctic as well as global atmospheric circulation and sea-level,” according to a summary of a report by the researchers. An assessment of the findings of the research was still being refined, said the IPY’s “State of Polar Research” report.
“But it now appears certain that both the Greenland and the Antarctic ice sheets are losing mass and thus raising sea level, and that the rate of ice loss from Greenland is growing,” it said. “New data also confirm that warming in the Antarctic is much more widespread than it was thought prior to IPY.”
More than 63 countries and some 10,000 scientists took part in the $1.5 billion programme, which began in March 2007 and ends next month.
IPY experts told a news conference that melting appeared to be speeding up, especially in the Western Antarctic region that stretches to near the southern tip of Latin America and which had earlier been thought stable.
“One could expect to see quite dramatic changes in weather in Chile and Argentina as a result,” said Ian Allison, a co-chairman of the programme’s steering committee. Such a trend would be felt around the world. While the challenges to funding posed by the economic crisis, the report said governments need to keep pumping money into North and South Pole research in order to keep tabs on global warming pressures.
It was the fourth internationally coordinated scientific programme on the polar regions, following previous efforts undertaken in 1882-83, 1932-33 and 1957-58. The IPY was organised by the independent International Council for Science and the U.N.’s World Meteorological Organisation (WMO).
Just keep the money flowing boys. We’ll get you the story you paid us to find. Don’t pay attention to satellite telling us Antarctic ice extent has been well above normal the last few years or to the fact that we are reporting the icemelt (just as Tom Brokaw did a few years ago in his special referencing it as the “canary in the coal mine") at the peak of the melt season when it melts every year. If it didn’t they would be snow shoeing in Buenos Aires. Note that even with this unprecedented melting reported, the ice is at 30 year normal levels.
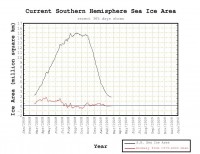
Larger image here.
Read this nonsense story here. See real story rebuttals on arctic here and Greenland here.
Feb 25, 2009
Disappearing Arctic Ice Is Latest Climate Falsehood
By Doug L. Hoffman
In May, 2008, the National Snow and Ice Data Center (NSIDC) predicted that the North Pole could be ice free during last years melt season.
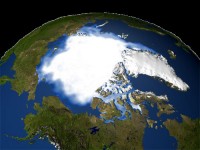
The disappearing northern sea ice has been pointed to by global warming alarmists as visible proof that the Earth was doing a melt down. However, the NSIDC announced that they have been the victims of “sensor drift” that caused them to underestimate the Arctic ice extent this winter by as much as 500,000 square kilometers. It turns out that the demise of the arctic ice was greatly exaggerated.
As with the NASA Russian temperature debacle last year and the forced recalculation of US surface temperatures for the last century in 2007, the latest problem was discovered after NSIDC received emails from puzzled readers, asking why obviously sea-ice-covered regions were showing up as ice free open ocean. A statement on the NSIDC web site, published February 18, 2009, explains the current faux pas this way:
“As some of our readers have already noticed, there was a significant problem with the daily sea ice data images on February 16. The problem arose from a malfunction of the satellite sensor we use for our daily sea ice products. Upon further investigation, we discovered that starting around early January, an error known as sensor drift caused a slowly growing underestimation of Arctic sea ice extent. The underestimation reached approximately 500,000 square kilometers (193,000 square miles) by mid-February. Sensor drift, although infrequent, does occasionally occur and it is one of the things that we account for during quality control measures prior to archiving the data.”
The problem stemmed from a failure of the sea ice algorithm caused by degradation of one of the sensor channels on the DMSP F15 satellite. Upon further investigation, it was found that data quality had begun to degrade over the month preceding the catastrophic sensor failure. The NSIDC relies on an older, less-reliable method of tracking sea ice extent called SSM/I that does not agree with a newer method called AMSR-E. A comparison of the sensor drift can be seen in the accompanying chart (supersized here).
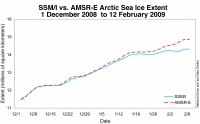
This error does not signal a change in the overall trend of sea ice reduction over the past several decades. Rather, it speaks to an all to common occurrence in the climate change debate - scientists getting caught basing dire predictions on bad data. This highlights the danger in accepting the at face value the often heard dismissal of anti-global warming arguments because the authors are not “real climate scientists.” Given the frequency of this type of data problem, we are forced to conclude that many climate scientists are really poor scientists, rushing to publish results that reinforce their own bias without ensuring the integrity of those results.
Once again we have misleading climate change pronouncements being based on data errors, data errors detected by non-UN, non-IPCC, non-peer-reviewed external observers. Sometimes it is the scientists themselves who discover the errors, as with the non-disappearing ice sheets of Greenland. More often than not, it is outside observers uncovering the errors, casting doubt on the trustworthiness of all science. This is exactly what happens when you base your arguments on “consensus science” and not scientific fact. What is happening to the Arctic ice this year? So far, the sea ice extent is tracking ahead of 2005, 2006, 2007, and 2008, so the predictions of an ice-free north pole might be a bit premature.
Professor Dr. Doug L. Hoffman, mathematician, computer programmer, and engineer, worked on environmental models and conducted research in molecular dynamics simulations and continues to teach at Hendrix College and the University of Central Arkansas. Hoffman co-authored a 2009 book The Resilient Earth, which touts itself as “bringing a dose of skeptical reality to climate science and the global warming debate.”
|


