
|
Dec 17, 2007
Easing Kids Fears on Global Warming
By Laryy Chiaroni, KCBS, San Francisco
A new book aims to soothe children’s fears over global warming. Holly Fretwell wrote, “The Sky’s Not Falling: Why it’s Ok to Chill About Global Warming,†because she says today’s environmental hysteria was scaring her two kids. â€I really wanted to provide something for kids that gave them the whole gambit. Something that gave them the full piece of information, and not just a little tiny piece of it to try to distort their view of the world,†said Fretwell, a natural resources policy expert, and economics college professor.

â€It’s a great book for kids, as well as parents, as well as just adults who want to get some kind of a primer on what’s actually happening out there, and what global warming really is,†said Fretwell. “It says what the policy recommendations are, what the costs of some of those recommendations are, and what some alternatives are for us.†No matter where parents stand on global warming, Fretwell says the best thing we can do for our kids is to encourage them to be critical thinkers. See story here.
For how to access this book, see this release here.
Dec 15, 2007
Is a New Solar Cycle Beginning?
Science at NASA
The solar physics community is abuzz this week. No, there haven’t been any great eruptions or solar storms. The source of the excitement is a modest knot of magnetism that popped over the sun’s eastern limb on Dec. 11th, pictured below in a pair of images from the orbiting Solar and Heliospheric Observatory (SOHO). It may not look like much, but “this patch of magnetism could be a sign of the next solar cycle,” says solar physicist David Hathaway of the Marshall Space Flight Center.
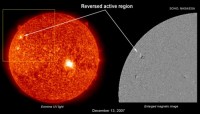
See full size image here.
For more than a year, the sun has been experiencing a lull in activity, marking the end of Solar Cycle 23, which peaked with many furious storms in 2000--2003. “Solar minimum is upon us,” he says. The big question now is, when will the next solar cycle begin?
It could be starting now. “New solar cycles always begin with a high-latitude, reversed polarity sunspot,” explains Hathaway. “Reversed polarity “ means a sunspot with opposite magnetic polarity compared to sunspots from the previous solar cycle. “High-latitude” refers to the sun’s grid of latitude and longitude. Old cycle spots congregate near the sun’s equator. New cycle spots appear higher, around 25 or 30 degrees latitude. The region that appeared on Dec. 11th fits both these criteria. It is high latitude (24 degrees N) and magnetically reversed. Just one problem: There is no sunspot. So far the region is just a bright knot of magnetic fields. If, however, these fields coalesce into a dark sunspot, scientists are ready to announce that Solar Cycle 24 has officially begun.
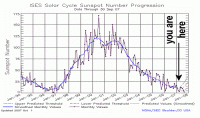
Peaking in 2011 or 2012, the cycle to come could have significant impacts on telecommunications, air traffic, power grids and GPS systems. (And don’t forget the Northern Lights!) In this age of satellites and cell phones, the next solar cycle could make itself felt as never before.
Icecap Note: Though Hathaway is among some solar physicists who believe cycle 24 will be very active (though 25 very quiet), the majority believe it will continue the decline started in cycle 23 which peaked 25% lower than the two previous cycles and forecasts. See a compilations of forecasts here. Also note cycle 23 would have lasted 11 years 7 plus months, more than a full two years longer than cycle 22. Longer cycles usually lead to colder temperatures. Leif Svalgaard notes it was at rather low latitude (for a new cycle spot). This is usually a sign of a weak cycle. The stronger the cycle the higher the latitude of the first spots.
Dec 14, 2007
Current Melting Of Greenland’s Ice Mimicks 1920s-1940s Event
Science Daily
Two researchers here spent months scouring through old expedition logs and reports, and reviewing 70-year-old maps and photos before making a surprising discovery: They found that the effects of the current warming and melting of Greenland’s glaciers that has alarmed the world’s climate scientists occurred in the decades following an abrupt warming in the 1920s.
Their evidence reinforces the belief that glaciers and other bodies of ice are exquisitely hyper-sensitive to climate change and bolsters the concern that rising temperatures will speed the demise of that island’s ice fields, hastening sea level rise.
The work, recently reported at the annual meeting of the American Geophysical Union in San Francisco , may help to discount critics’ notion that the melting of Greenland ‘s glaciers is merely an isolated, regional event. They recently recognized from using weather station records from the past century that temperatures in Greenland had warmed in the 1920s at rates equivalent to the recent past. But they hadn’t confirmed that the island’s glaciers responded to that earlier warming, until now. Read more here.
Icecap Note: This supports what we and others have been saying is that the changes observed are cyclical and related to the Atlantic Multidecadal Oscillation and not greeenhouse gases
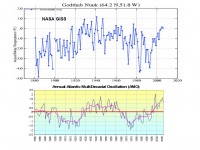
For full size image go here.
Dec 13, 2007
Magma May Be Melting Greenland Ice
By Karl Ritter, Associated Press
Global warming may not be the only thing melting Greenland. Scientists have found at least one natural magma hotspot under the Arctic island that could be pitching in.
clues to a new natural contribution to the melt arose when scientists discovered a thin spot in the Earth’s crust under the northeast corner of the Greenland Ice Sheet where heat from Earth’s insides could seep through, scientists will report here this week at a meeting of the American Geophysical Union.
The corner of Greenland where the hotspot was found had no known ice streams, the rivers of ice that run through the main ice sheet and out to sea, until one was discovered in 1991. What exactly caused the stream to form was uncertain. “Ice streams have to have some reason for being there,†von Frese said, “and it’s pretty surprising to suddenly see one in the middle of the ice sheet.†The newly discovered hotspot, an area where Earth’s crust is thinner, allowing hot magma from Earth’s mantle to come closer to the surface, is just below the ice sheet and could have caused it to form, von Frese and his team suggest.

Ammassalik Island
“Where the crust is thicker, things are cooler, and where it’s thinner, things are warmer,†von Frese explained. “And under a big place like Greenland or Antarctica, natural variations in the crust will makes some parts of the ice sheet warmer than others.â€
Dec 12, 2007
Snowcover Increased Rapidly Even Before December
By Joseph D’Aleo, CCM
Even before the flurry of snow and ice storms in December, the hemispheric snowcover rapidly increased in November so by the end of the month (week 48 of the year), we were above the average shown in the red dashed line according to Rutger’s Snowlab. In fact we already ranked 15th highest in the 42 years records have been kept. With the snow so far this month and expected in the next week, we will rise in the rankings.
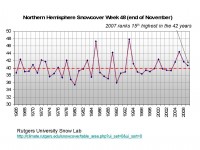
For a larger image go here.
Of course, the AGW PR machine picks these times when the last thing on people’s mind is global warming, as they sit in the dark and cold ice covered homes to issue press releases warning the arctic melting is accelerating with potentially disastrous consequences. The young scientists and agenda driven journalists and politicans have no sense of history. This has happened before - most recently in the 1930s to 1950s and relates to ocean warming cycles and not greenhouse gases. Never a mention of nor any explanation for the record high ice extent in Antarctica at the same time.
Let’s hope they return from their junket to Bali and find their driveway looking like this.
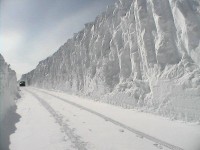
For larger image go here.
|
|
|
|


